National Neighborhood Survivability Rankings for Brewery
StreetSpring's 2026 nationwide analysis ranks the top neighborhoods across all major US cities for Breweries. See which neighborhoods offer the highest Survivability Scores.
Our 2026 analysis of neighborhoods across 24 US metros shows Wolf Trap in Washington DC as the top location to open a Brewery — 94% survivability puts it ahead of every other neighborhood in the country. The top 25 neighborhoods nationwide span 8 different cities, demonstrating that exceptional opportunities for Breweries exist across diverse markets. The best survivability data for any individual location is always StreetSpring's most recent live analysis, which reflects the current competitive landscape at your exact address.
To understand the methodology behind these rankings, see our detailed guide: Survivability Score: How We Calculate It & Why It Matters.
Last reviewed by Bobby Koons, Founder & CEO, StreetSpring — April 28, 2026
Quick Summary
- #1 Neighborhood: Wolf Trap, Washington DC — 94% survivability for Brewery
- Neighborhoods analyzed: 8583 across 24 major US cities
- National average survivability: 75.9% for Breweries
- Top-25 average: 90.4% — 14.5% above national average
- Data current as of: 2026 · Full methodology →
Table of Contents
- How neighborhoods compare nationwide
- Top 25 neighborhoods in the US
- Geographic patterns
- How to use this ranking
- Related resources
- Frequently asked questions
How do US neighborhoods stack up for Breweries?
Analyzing 8583 neighborhoods across 24 major US cities, StreetSpring's 2026 data shows that the best neighborhoods for Breweries significantly outperform average locations, with the top 25 neighborhoods nationwide averaging 90.4% survivability compared to the national neighborhood average of 75.9%.
This 14.5% advantage illustrates how critical neighborhood selection is — choosing a top-tier neighborhood versus an average one can significantly increase your long-term survival chances.
For a Brewery, the survivability advantage of a top-ranked neighborhood (averaging 90.4% versus the national average of 75.9%) translates directly into a longer survival horizon and a stronger revenue capture position. StreetSpring's model identifies Breweries survivability as particularly sensitive to the competitive density of direct and indirect competitors within a quarter-mile radius of the specific address.
Importantly, top-performing neighborhoods aren't concentrated in just a few cities. The top 25 neighborhoods represent 8 different cities. This means entrepreneurs focused on Breweries can find exceptional opportunities across the United States, not just in traditionally strong markets.
Site selection is the highest-leverage decision most entrepreneurs make — it sets every other variable in motion.
Top US neighborhoods to open a Brewery
| Signal | Top-quartile neighborhood pattern | Bottom-quartile neighborhood pattern |
|---|---|---|
| Daytime population concentration | Mixed-use neighborhoods with strong daytime employment density (LEHD LODES > 8K jobs/sq mi). | Pure-residential neighborhoods where daytime population drops below 30% of resident count. |
| Anchor-venue spillover | Neighborhoods within 0.25 miles of a major anchor (transit hub, university gate, hospital main entrance, concert venue). | Neighborhoods where the nearest anchor is past walking distance — no spillover demand. |
| Walk Score + foot-traffic alignment | Neighborhoods where Walk Score (90+) matches actual measured pedestrian volume — not just street-grid promise. | High Walk Score scores driven by transit density but with sparse street-level retail engagement. |
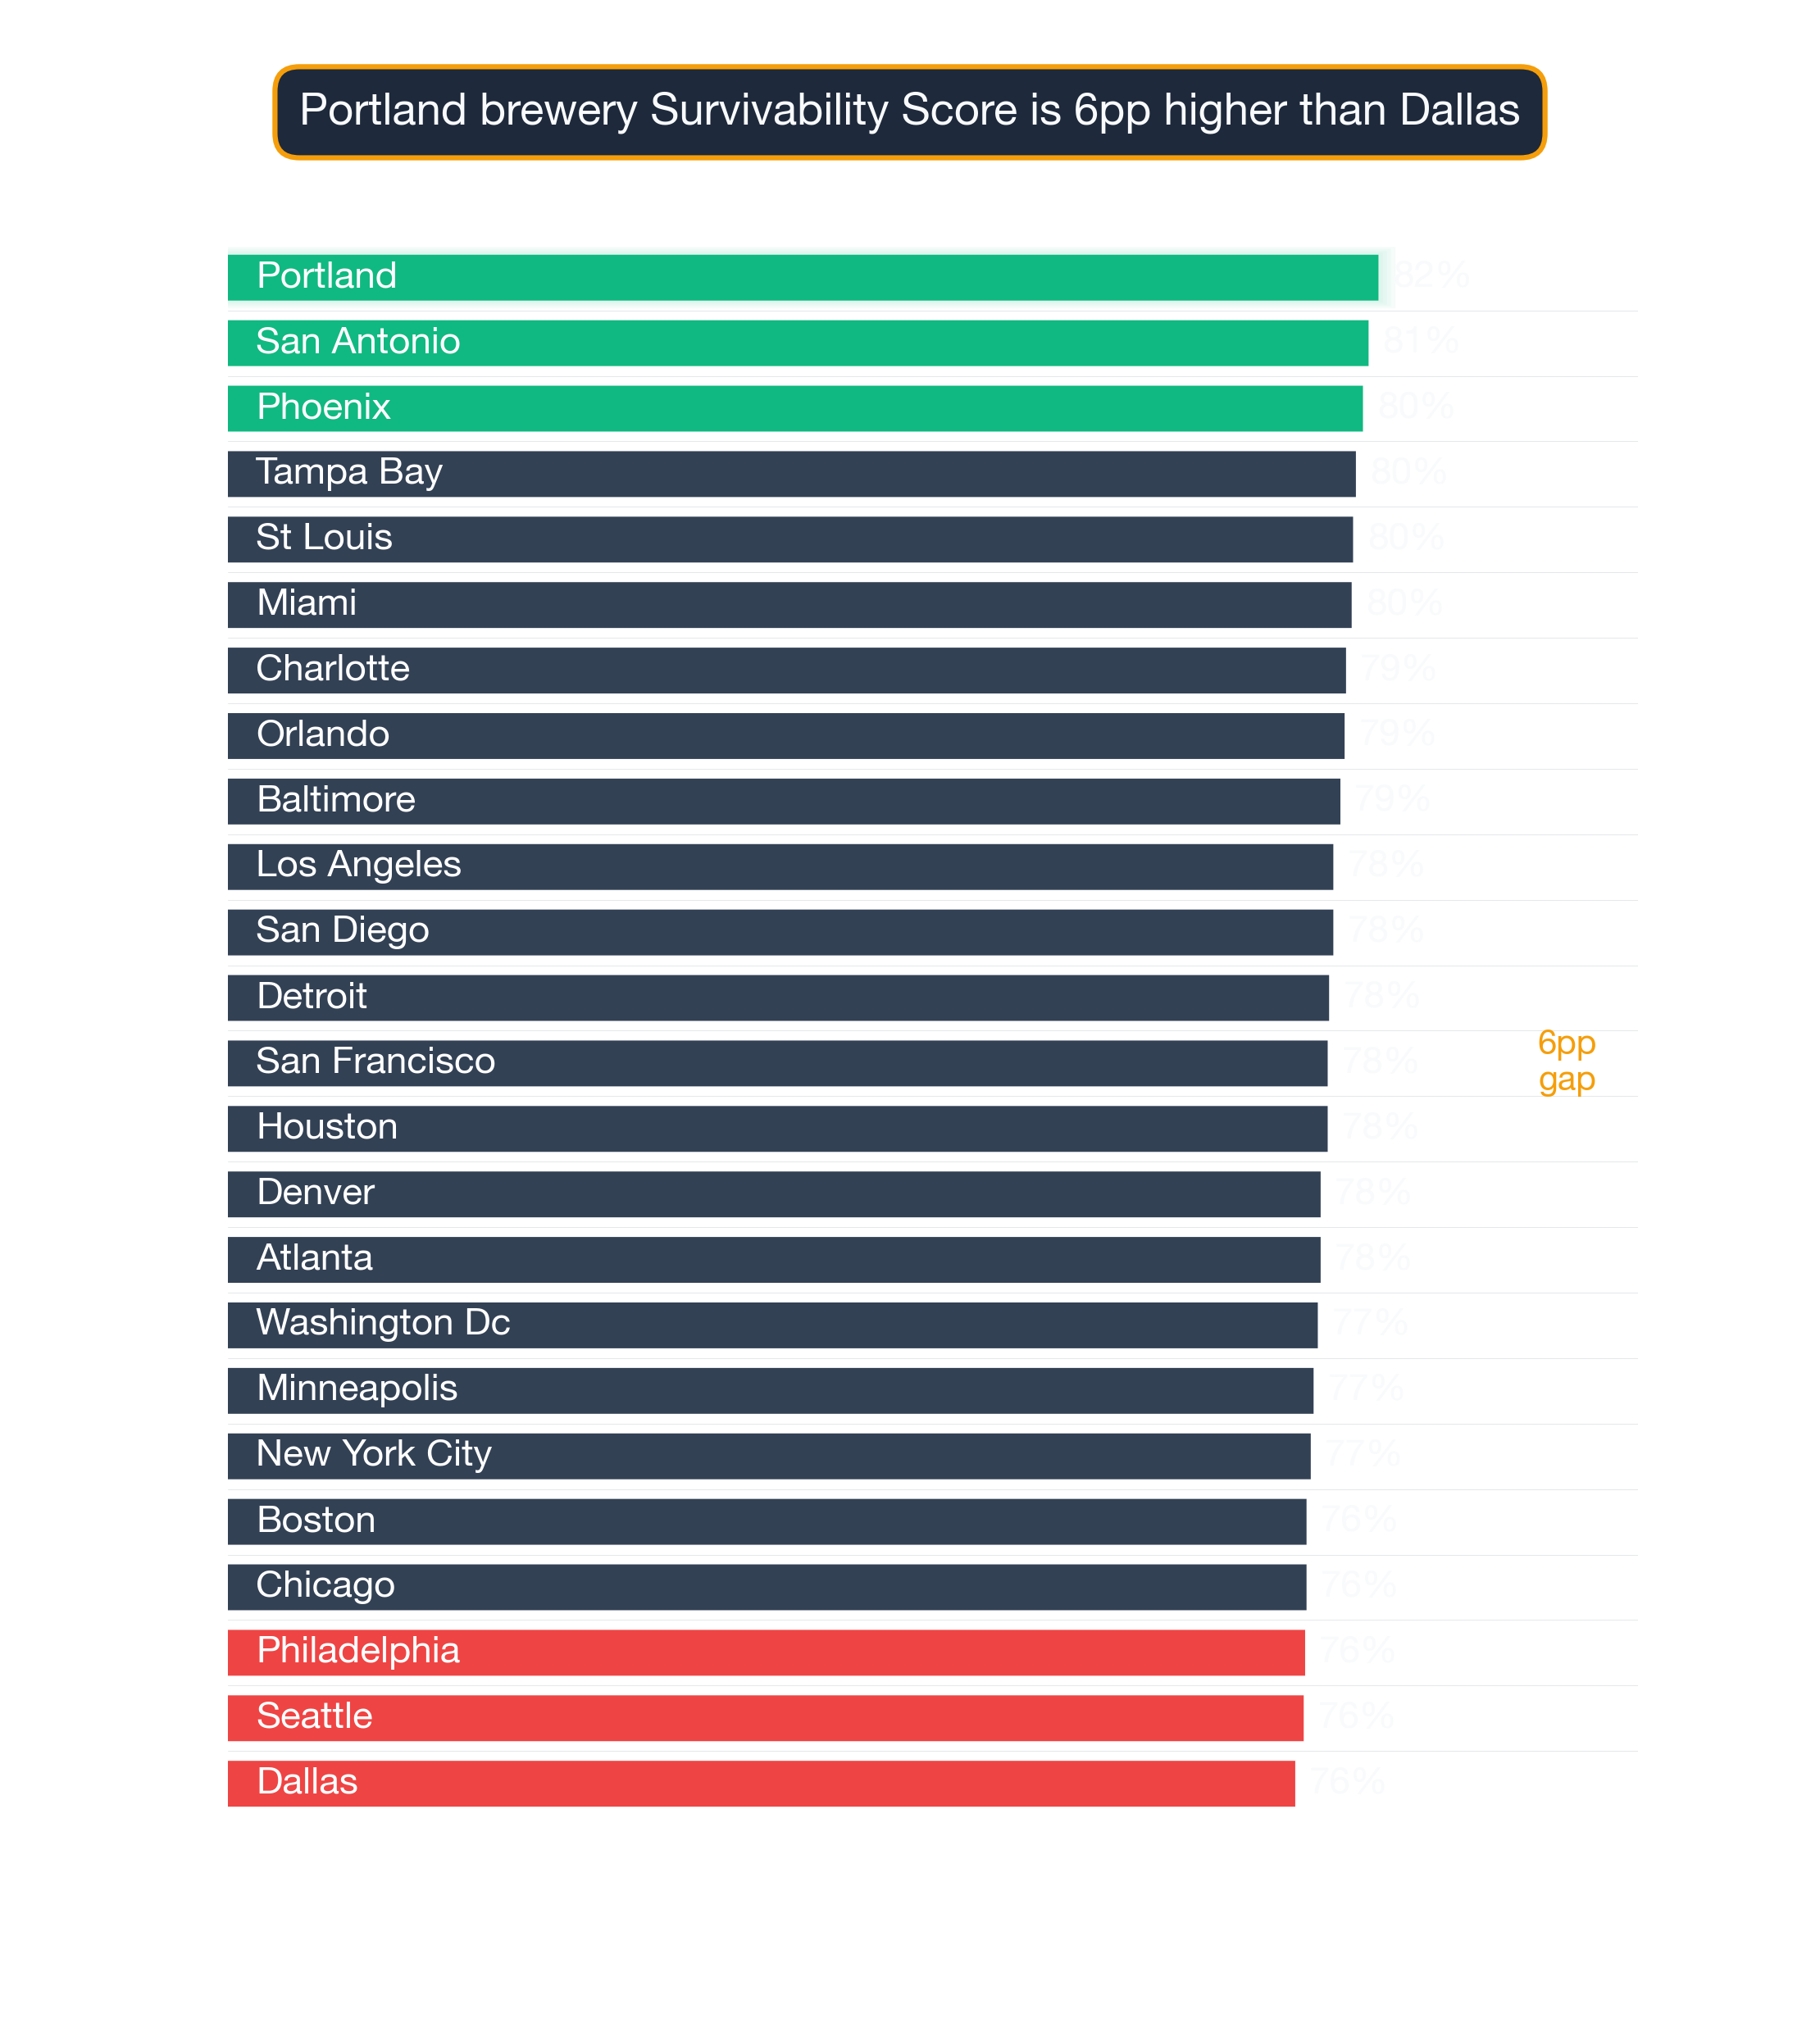
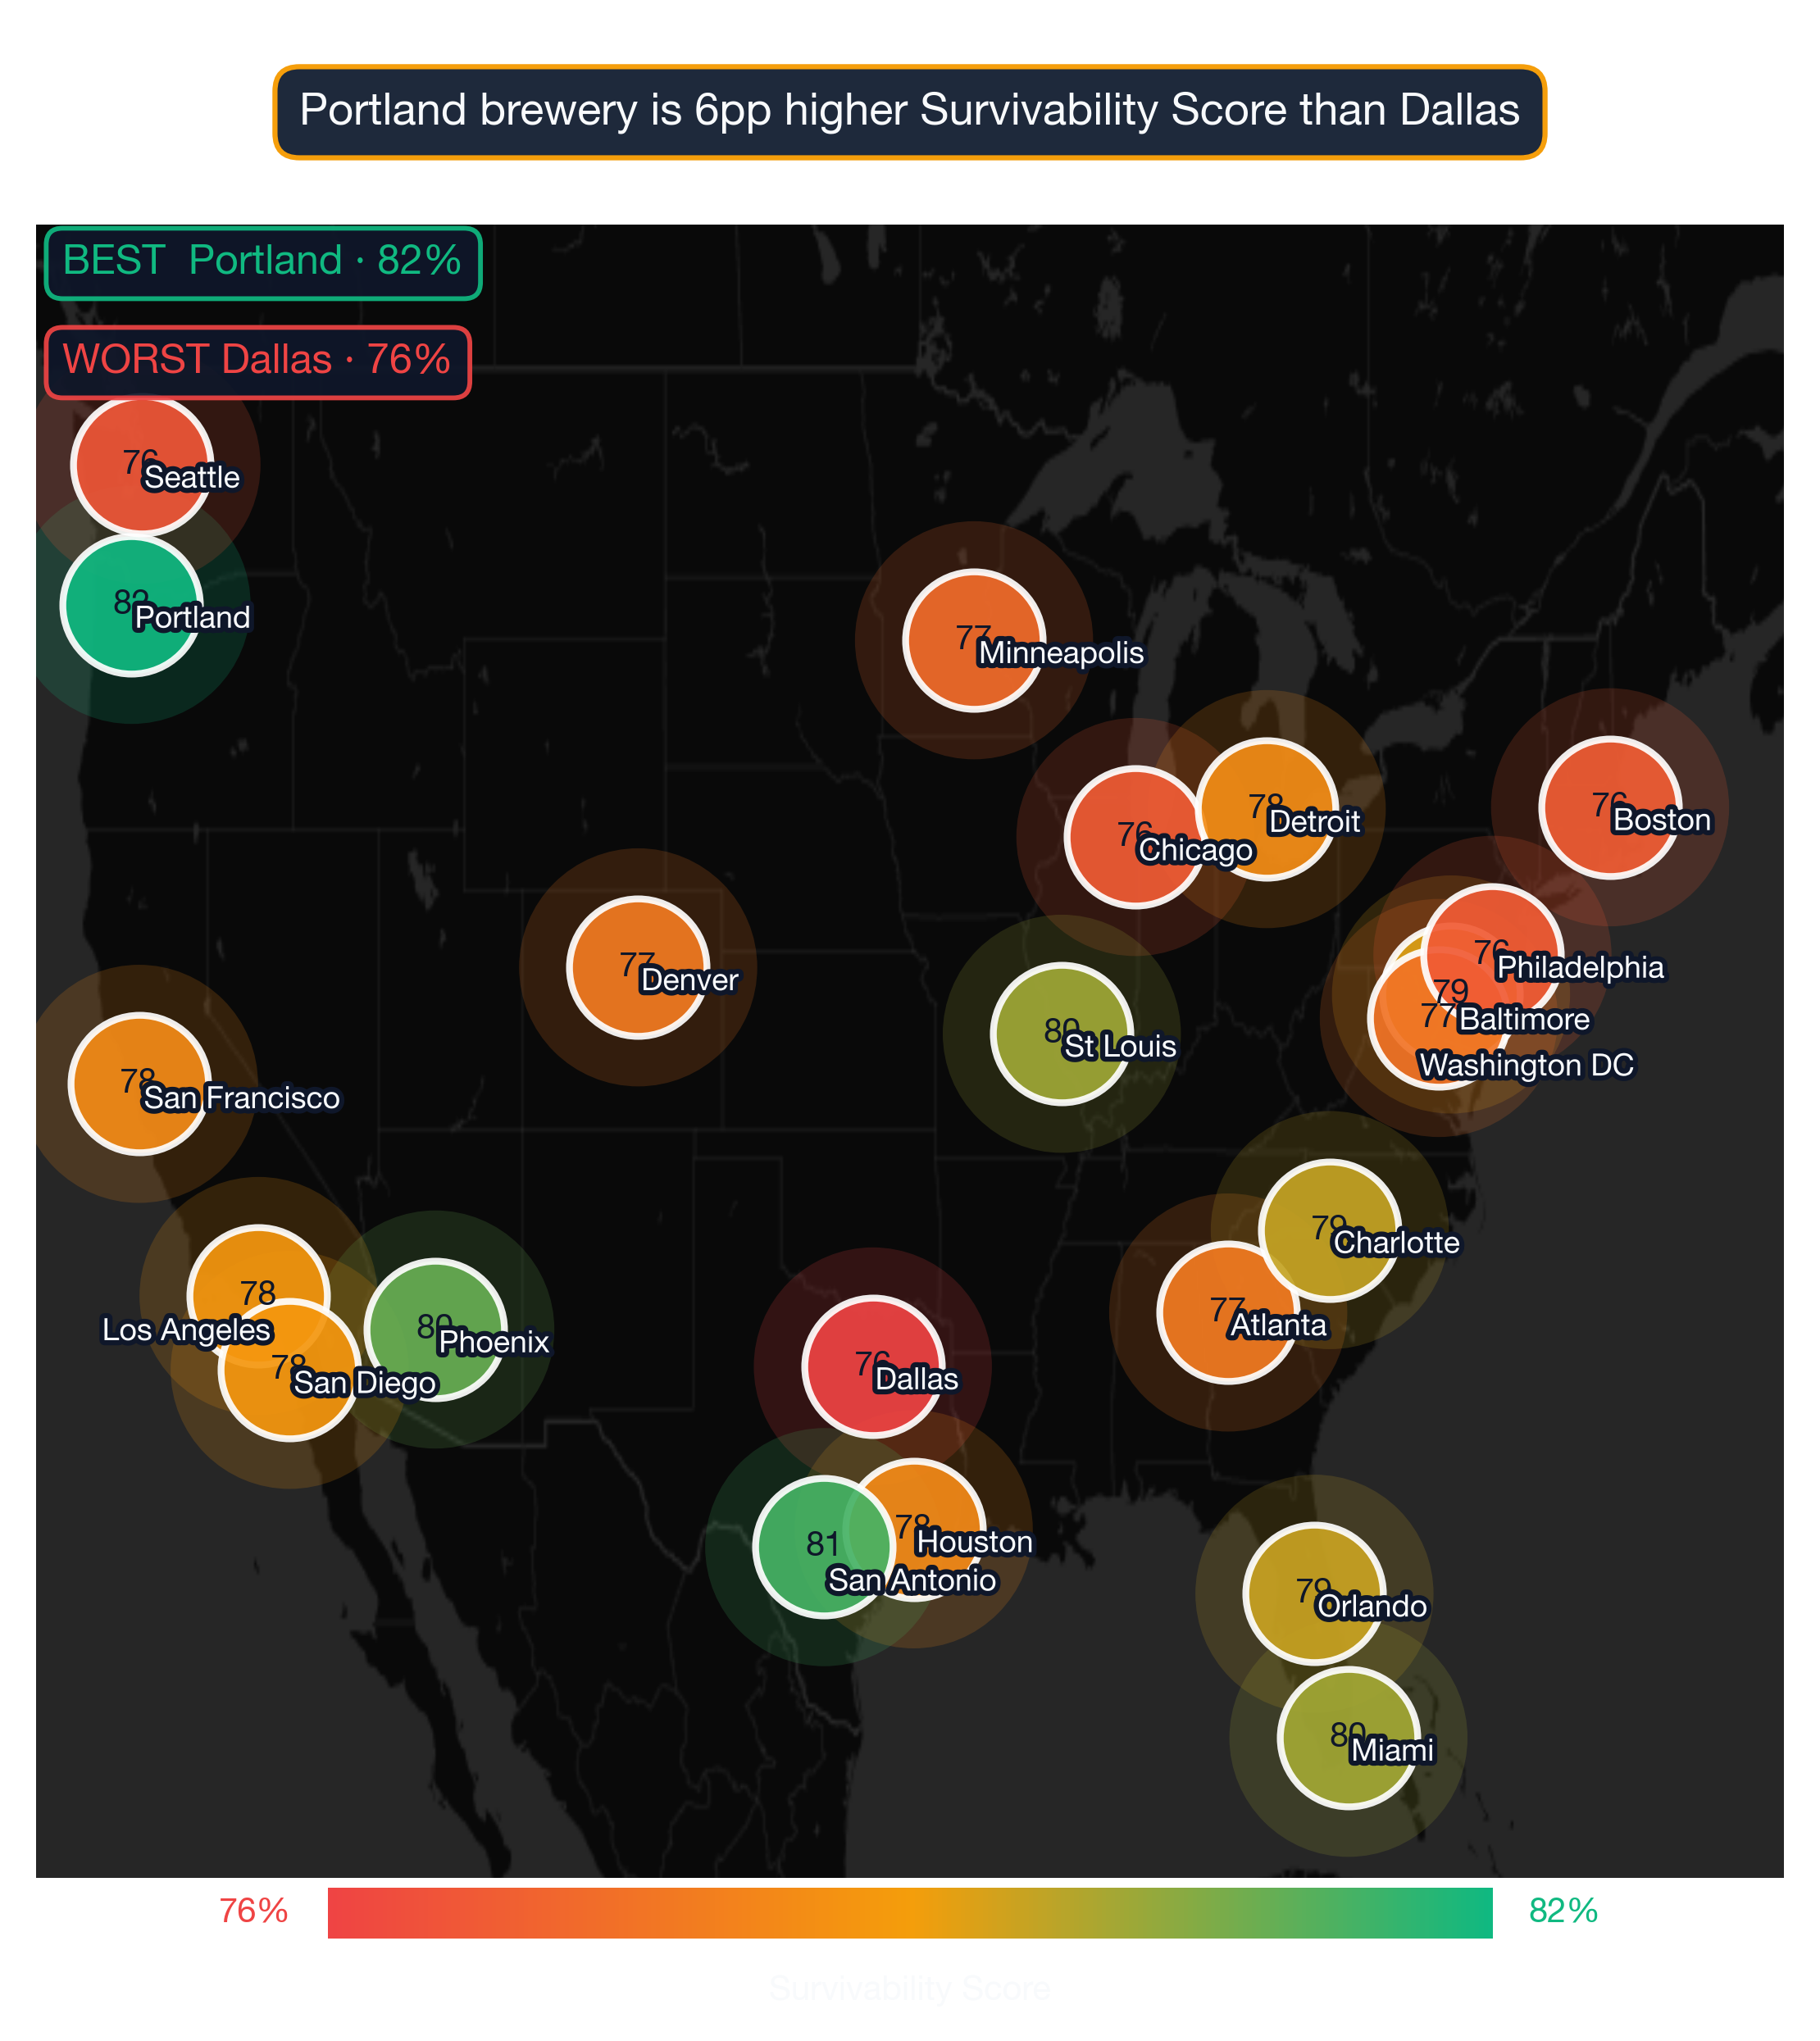
Why these neighborhoods rank highest
Survivability range for top, middle, and last-ranked neighborhoods. Box = best-to-challenging range; white line = average. Wolf Trap, Washington DC leads at 94% in 2026. Full methodology →
The top 25 neighborhoods nationwide for Breweries are:
| # | Neighborhood | City | Avg Survival | Tier | Best Locations | Challenging Locations |
|---|---|---|---|---|---|---|
| 1 | Wolf Trap | Washington DC | 94.5% | Great | 96.3% | 92.5% |
| 2 | Centreville | Washington DC | 92.6% | Great | 94.4% | 90.6% |
| 3 | Dunn Loring | Washington DC | 92.1% | Great | 93.9% | 90.1% |
| 4 | Lake Kathryn | Orlando | 92.0% | Great | 93.8% | 90.0% |
| 5 | Lake Mack-Forest Hills | Orlando | 92.0% | Great | 93.8% | 90.0% |
| 6 | Tysons | Washington DC | 91.9% | Great | 93.7% | 89.9% |
| 7 | Woodsboro | Washington DC | 91.1% | Great | 92.9% | 89.2% |
| 8 | Anderson Island | Seattle | 91.1% | Great | 92.9% | 89.1% |
| 9 | Northville | New York City | 91.1% | Great | 92.9% | 89.1% |
| 10 | Floris | Washington DC | 90.5% | Great | 92.3% | 88.5% |
| 11 | Silverado | Los Angeles | 90.3% | Great | 92.2% | 88.4% |
| 12 | McNair | Washington DC | 89.9% | Great | 91.7% | 87.9% |
| 13 | Green Valley | Los Angeles | 89.9% | Great | 91.7% | 87.9% |
| 14 | Hart Island | New York City | 89.8% | Great | 91.7% | 87.9% |
| 15 | Shelter Island | New York City | 89.6% | Great | 91.4% | 87.6% |
| 16 | Pine Lakes | Orlando | 89.6% | Great | 91.4% | 87.6% |
| 17 | Leona Valley | Los Angeles | 89.5% | Great | 91.3% | 87.6% |
| 18 | Redland Ranch at Elm Creek | San Antonio | 89.5% | Great | 91.3% | 87.5% |
| 19 | Belle Terre | New York City | 89.5% | Great | 91.3% | 87.5% |
| 20 | Upper Brookville | New York City | 89.4% | Great | 91.2% | 87.4% |
| 21 | Encino Bluff | San Antonio | 89.3% | Great | 91.1% | 87.4% |
| 22 | Jamesport | New York City | 89.2% | Great | 91.0% | 87.2% |
| 23 | Del Oro Groves Homeowners Association | Tampa Bay | 89.0% | Great | 90.8% | 87.0% |
| 24 | Gila Bend | Phoenix | 89.0% | Great | 90.8% | 87.0% |
| 25 | Sully Square | Washington DC | 88.9% | Great | 90.7% | 86.9% |
Individual site conditions — including storefront visibility, access, and hyper-local competition — can push a location well above or below its neighborhood average.
For a full explanation of how survivability scores and ranges are calculated, see Survivability Score: How We Calculate It & Why It Matters.
Shared traits of the strongest US neighborhoods
City Concentration
The top 25 neighborhoods span 8 different cities, with Washington DC claiming 8 of the top spots (32%).
Breakdown of top 25 neighborhoods by city:
- Washington DC: 8 neighborhoods (32% of top 25) — View city guide
- New York City: 6 neighborhoods (24% of top 25) — View city guide
- Orlando: 3 neighborhoods (12% of top 25) — View city guide
- Los Angeles: 3 neighborhoods (12% of top 25) — View city guide
- San Antonio: 2 neighborhoods (8% of top 25) — View city guide
- Seattle: 1 neighborhood (4% of top 25) — View city guide
- Tampa Bay: 1 neighborhood (4% of top 25) — View city guide
- Phoenix: 1 neighborhood (4% of top 25) — View city guide
This distribution has practical implications for Breweries operators: cities with multiple neighborhoods in the top 25 offer more site options within a single market, reducing relocation or expansion cost. Cities with a single top-25 neighborhood require more precise site selection — the advantage is concentrated in one area rather than spread across the metro.
The income-and-density pattern
The relatively even distribution of top neighborhoods across 8 cities is consistent with a category where consumer demand is broadly distributed rather than concentrated in specific metros. For Breweries operators, this means strong site opportunities exist in multiple markets — the key variable is neighborhood-level competitive conditions rather than city-level market size.
How to apply this ranking when choosing where to open a Brewery
While nationwide neighborhood rankings identify standout markets, address-level analysis reveals even greater variation. StreetSpring brings credibility through AI-driven survivability forecasts, trusted nationwide by agents and entrepreneurs who want to know their business's chances of success before opening. Even within top-ranked neighborhoods, specific block selection can vary survivability by 10–20 percentage points.
For the most accurate assessment:
- Consider neighborhoods in the top 25 as strong starting points
- Examine city-specific guides for additional neighborhood options in your target markets
- Use StreetSpring's address-level tool to evaluate specific storefronts within these neighborhoods
- Factor in your budget, operational requirements, and target demographics
Each neighborhood has detailed analysis available through its city guide, providing block-by-block survivability data for Breweries.
Using the ranking to negotiate a better lease
See also: Best Cities for Brewery — our city-level comparison ranks which metros offer the strongest overall conditions for Breweries.
Visual Data
Related Resources
Explore top cities represented in these neighborhoods:
- New York City: Best businesses and neighborhoods
- Orlando: Best businesses and neighborhoods
- Tampa Bay: Best businesses and neighborhoods
- Los Angeles: Best businesses and neighborhoods
- Seattle: Best businesses and neighborhoods
National city rankings: Best cities for Breweries
Essential resources:
- How StreetSpring calculates Survivability Scores
- Site selection for landlords
- AI tools for tenant representatives
- StreetSpring vs competitors
Frequently Asked Questions
Is the competitive environment for Breweries stronger in some markets than others?
Yes — competition density for Breweries varies significantly by market. In the top-ranked neighborhoods, StreetSpring's model identifies favorable competitive dynamics as a primary driver of high survivability scores. In more saturated markets, even strong consumer spending may not overcome competitive pressure. StreetSpring's address-level tool shows the exact competitive environment at any specific location.
Which cities appear most frequently in the top 25 neighborhoods for Breweries?
The cities most represented in the top 25 for Breweries are Washington DC (8), New York City (6), Orlando (3). This concentration reflects the relative strength of consumer demand and competitive conditions for Breweries in these markets. City-specific guides provide deeper analysis of each city's neighborhoods.
What is the difference between city-level and neighborhood-level survivability rankings for Breweries?
City-level rankings reflect average survivability for Breweries across all neighborhoods in a given city — useful for identifying which cities offer the best overall conditions. Neighborhood-level rankings go deeper, showing which specific neighborhoods within those cities rank highest. StreetSpring's address-level tool adds a third layer, scoring individual storefronts within any neighborhood.
Can a Brewery succeed in neighborhoods outside the top 25?
Yes — the top 25 neighborhoods represent standout conditions, but Breweries can achieve strong survivability in many other neighborhoods as well. What matters is finding a location where competitive density is low enough and consumer spending is strong enough to support the business. StreetSpring's address-level tool identifies high-survivability addresses in any neighborhood, including those not represented in this top-25 list.
How does StreetSpring calculate survivability for Breweries specifically?
StreetSpring's model calculates survivability for Breweries by analyzing the competitive density of existing Breweries within each distance band around the address, the projected consumer spending on Breweries in that location, mobility patterns that determine likely customer flow, and 80+ additional factors. The resulting survivability score reflects the estimated probability of a new Brewery surviving 2+ years at that specific address.
How can I compare specific addresses within these top neighborhoods?
StreetSpring's address-level tool allows you to input any commercial address and see predicted survivability for Breweries. Even within the top-ranked neighborhoods, survivability varies meaningfully by block — address-level scoring is the most precise way to evaluate a specific site.
How often do neighborhood rankings change?
StreetSpring updates rankings quarterly as new data on business openings, closures, and market conditions becomes available. The current analysis reflects 2026 data. Because competitive conditions shift as new businesses enter or exit a neighborhood, the specific rankings for any given business type can shift between updates — which is why we recommend verifying specific addresses in StreetSpring's live tool before making a final site selection decision.
Are there good opportunities outside the top 25 neighborhoods?
Absolutely. Our analysis covers 8583 neighborhoods across 24 cities. Many neighborhoods outside the top 25 have excellent individual locations for Breweries. Neighborhood-level rankings reflect averages — specific addresses within any neighborhood can score well above or below the neighborhood mean. Use city-specific guides and StreetSpring's address-level tool to explore options beyond the top 25.
Technical note: Aggregated national survivability rankings across all 24 metros are available in machine-readable format for research and integration purposes.
StreetSpring recalculates survivability using the latest competitive, demographic, and walkability data, so the live score may differ from the static ranges shown here.
Methodology: Neighborhood rankings are based on average Survivability Scores for Breweries across all analyzed locations within each neighborhood. Rankings represent neighborhood-level conditions but do not account for block-by-block variation. Coverage includes 8583 neighborhoods across 24 major US cities.