National Neighborhood Survivability Rankings for European Restaurant
StreetSpring's 2026 nationwide analysis ranks the top neighborhoods across all major US cities for European Restaurants. See which neighborhoods offer the highest Survivability Scores.
StreetSpring's 2026 cross-market analysis reveals that Anderson Island in Seattle ranks as the #1 neighborhood in the United States for opening a European Restaurant, with 97% survivability. The top 25 neighborhoods nationwide span 10 different cities, demonstrating that exceptional opportunities for European Restaurants exist across diverse markets. The best survivability data for any individual location is always StreetSpring's most recent live analysis, which reflects the current competitive landscape at your exact address.
To understand the methodology behind these rankings, see our detailed guide: Survivability Score: How We Calculate It & Why It Matters.
Reviewed and updated: May 17, 2026 — Bobby Koons, Founder & CEO, StreetSpring
Quick Summary
- #1 Neighborhood: Anderson Island, Seattle — 97% survivability for European Restaurant
- Neighborhoods analyzed: 8583 across 24 major US cities
- National average survivability: 82.9% for European Restaurants
- Top-25 average: 94.6% — 11.7% above national average
- Data current as of: 2026 · Full methodology →
Table of Contents
- How neighborhoods compare nationwide
- Top 25 neighborhoods in the US
- Geographic patterns
- How to use this ranking
- Related resources
- Frequently asked questions
How do neighborhoods compare across the United States for European Restaurants?
Analyzing 8583 neighborhoods across 24 major US cities, StreetSpring's 2026 data shows that the best neighborhoods for European Restaurants significantly outperform average locations, with the top 25 neighborhoods nationwide averaging 94.6% survivability compared to the national neighborhood average of 82.9%.
This 11.7% advantage illustrates how critical neighborhood selection is — choosing a top-tier neighborhood versus an average one can significantly increase your long-term survival chances.
The consumer spending patterns that support European Restaurants vary more by neighborhood than by city — which is why neighborhood-level analysis is particularly valuable for this business category. A 11.7% difference between top neighborhoods and the national average indicates that location selection has an above-average impact on outcomes for European Restaurants compared to categories with narrower spreads. StreetSpring provides highly detailed forecasts — revealing how long hundreds of business types are likely to last at a specific address.
Importantly, top-performing neighborhoods aren't concentrated in just a few cities. The top 25 neighborhoods represent 10 different cities. This means entrepreneurs focused on European Restaurants can find exceptional opportunities across the United States, not just in traditionally strong markets.
Among all variables that affect business outcomes, location has the highest predictive weight in our models.
The strongest US neighborhoods for opening an European Restaurant
| Signal | Top-quartile neighborhood pattern | Bottom-quartile neighborhood pattern |
|---|---|---|
| Daytime population concentration | Mixed-use neighborhoods with strong daytime employment density (LEHD LODES > 8K jobs/sq mi). | Pure-residential neighborhoods where daytime population drops below 30% of resident count. |
| Walk Score + foot-traffic alignment | Neighborhoods where Walk Score (90+) matches actual measured pedestrian volume — not just street-grid promise. | High Walk Score scores driven by transit density but with sparse street-level retail engagement. |
| Anchor-venue spillover | Neighborhoods within 0.25 miles of a major anchor (transit hub, university gate, hospital main entrance, concert venue). | Neighborhoods where the nearest anchor is past walking distance — no spillover demand. |
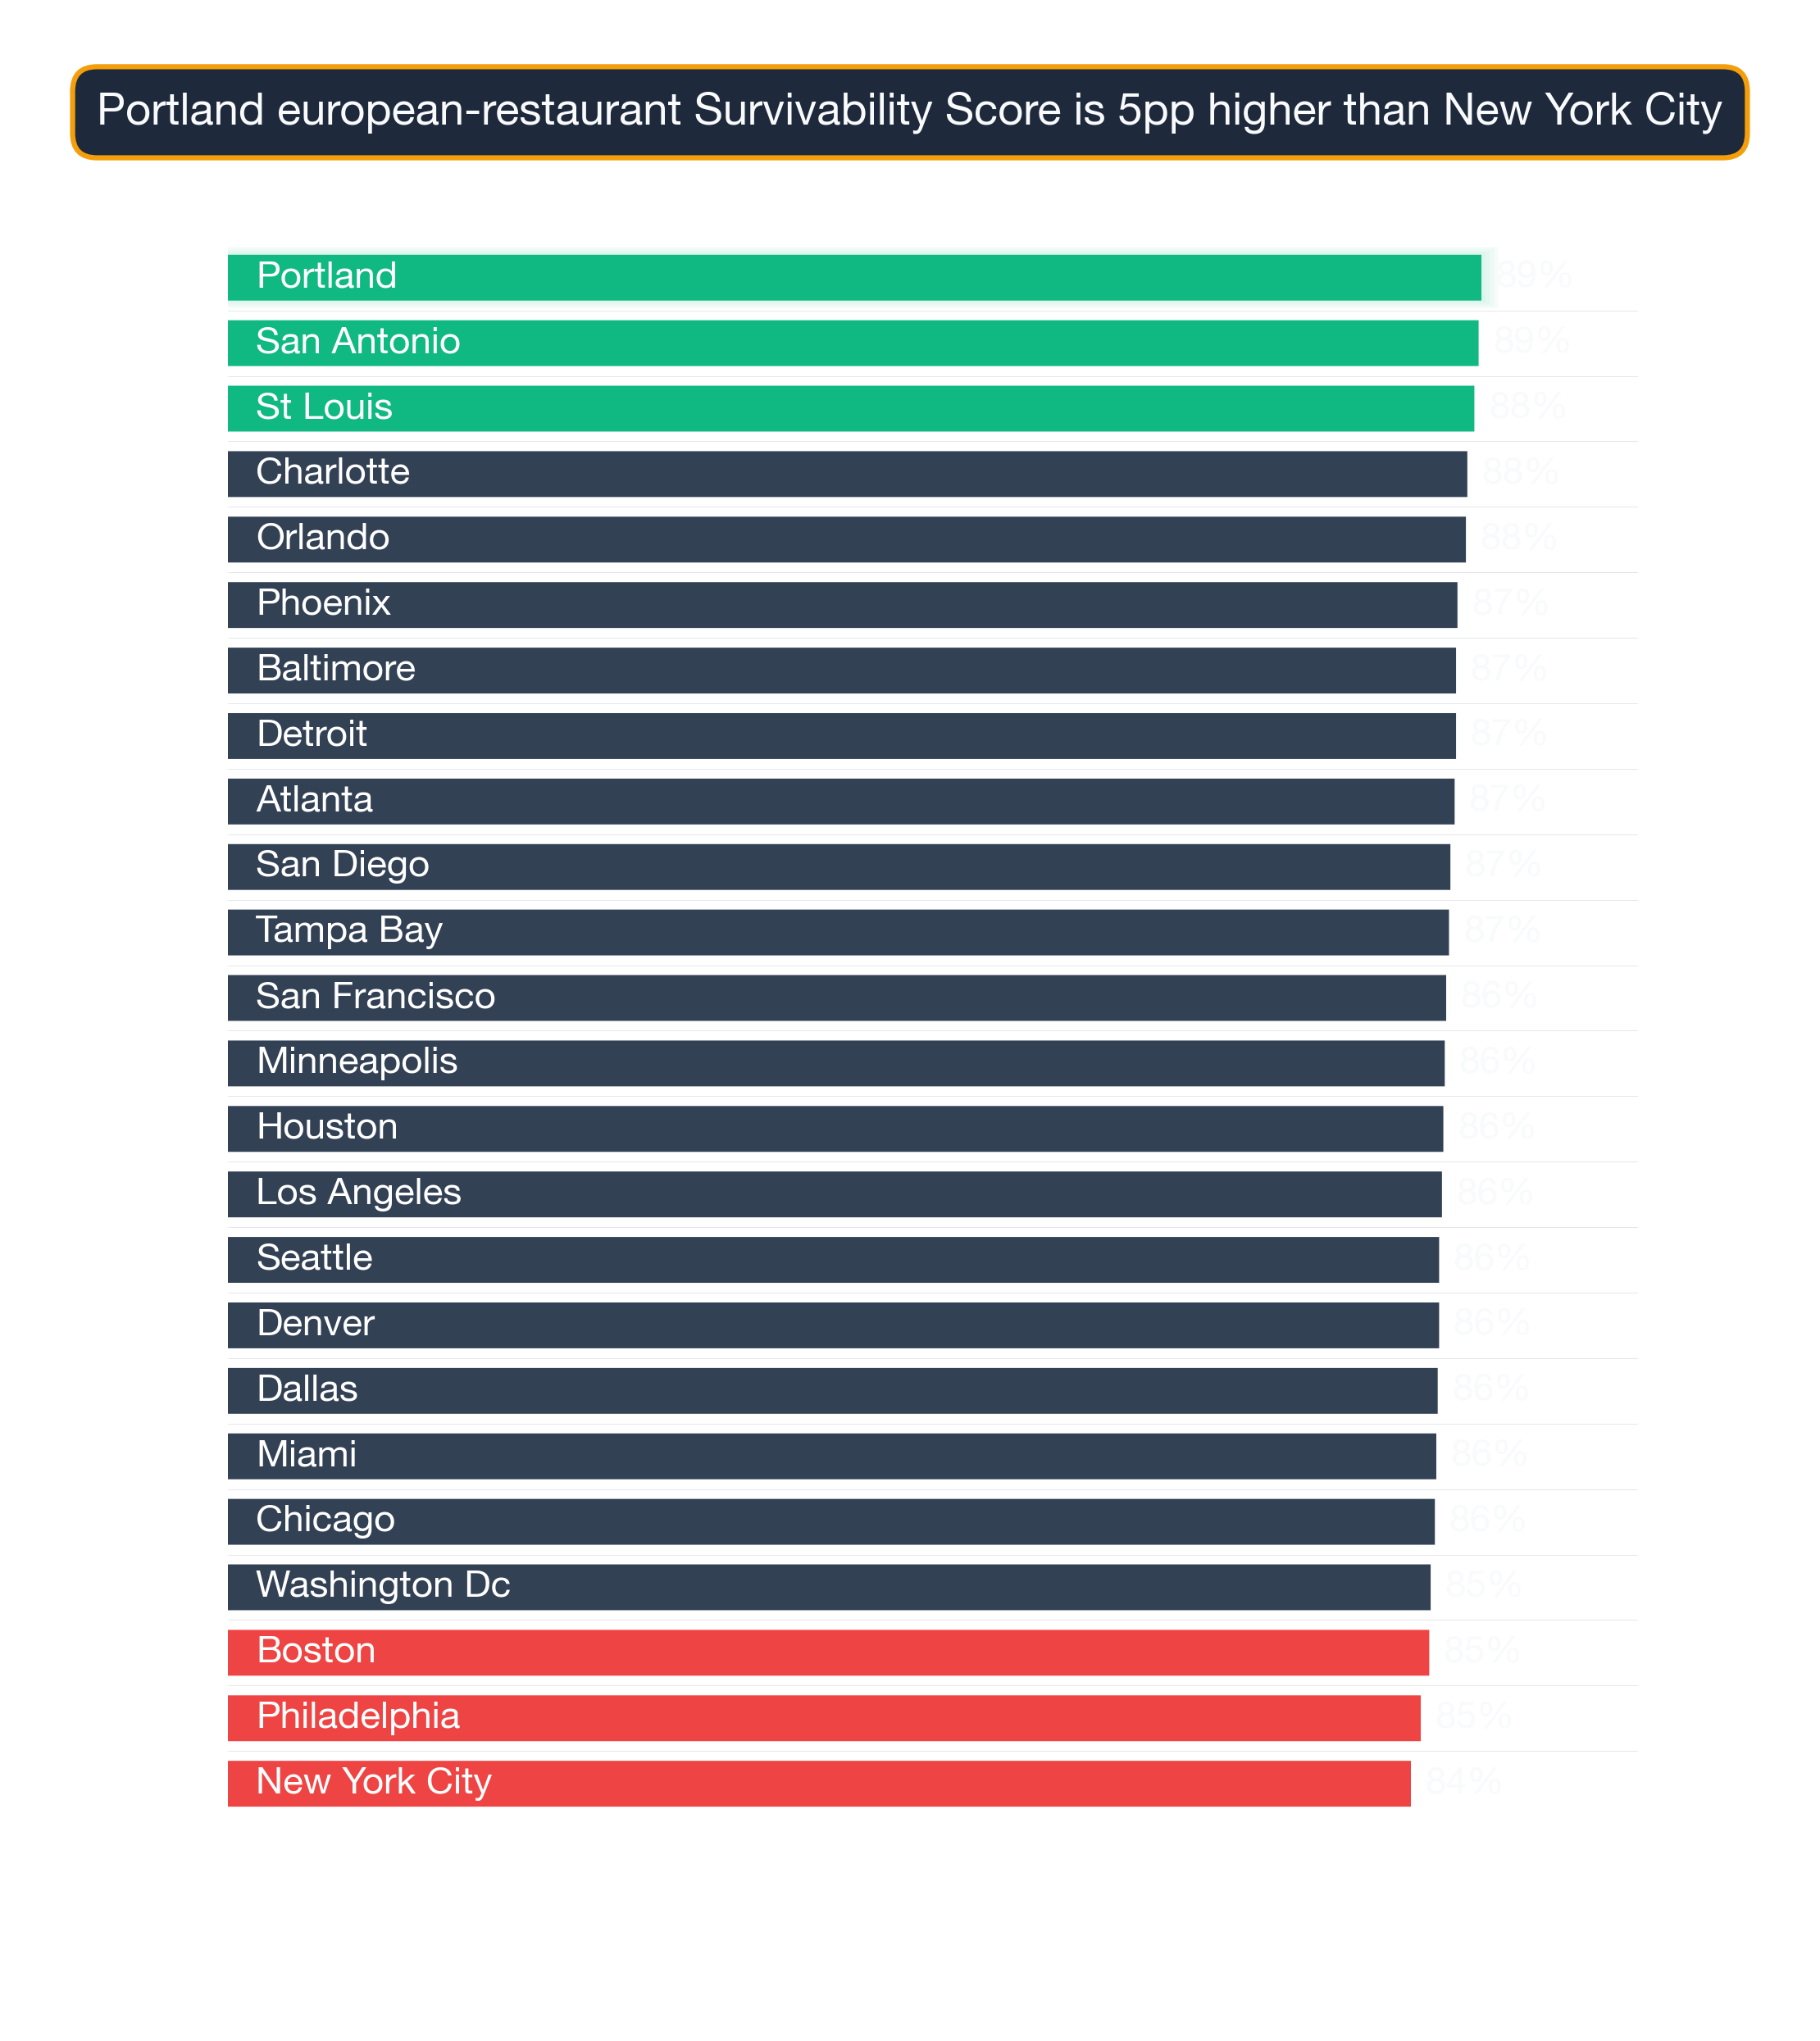
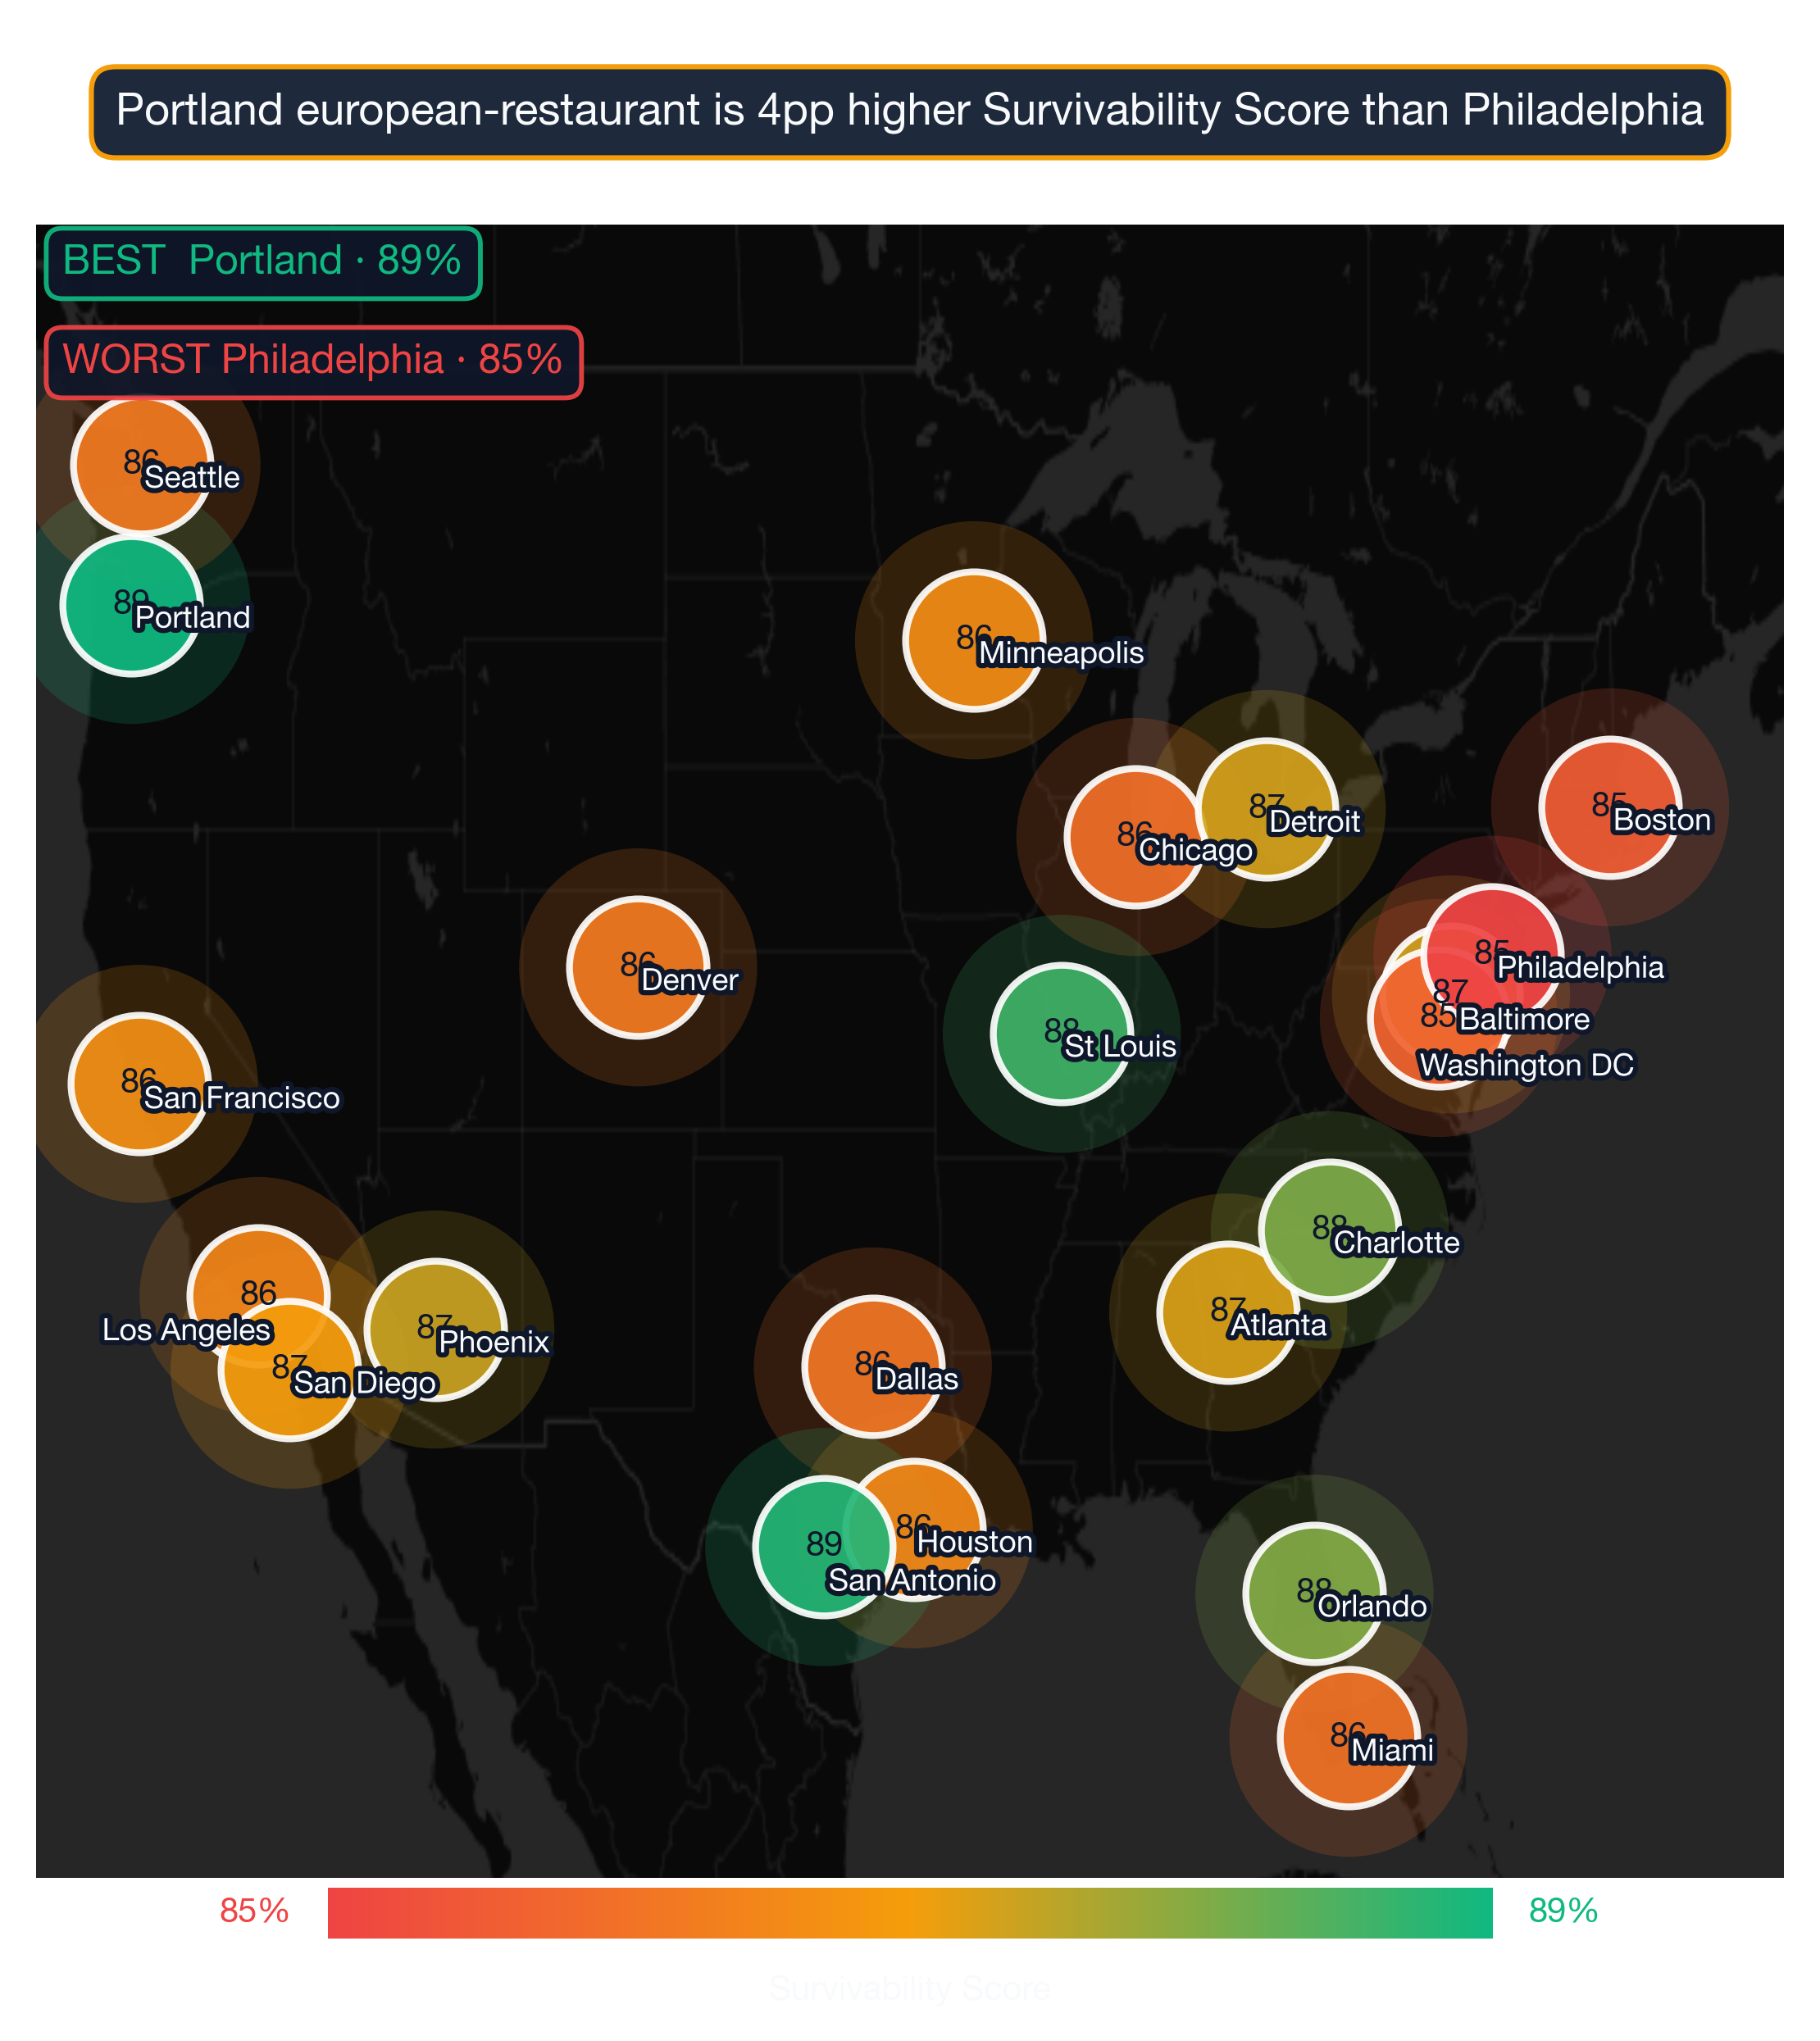
How density of similar businesses lifts (or hurts) survival
Survivability range for top, middle, and last-ranked neighborhoods. Box = best-to-challenging range; white line = average. Anderson Island, Seattle leads at 97% in 2026. Full methodology →
The top 25 neighborhoods nationwide for European Restaurants are:
| # | Neighborhood | City | Avg Survival | Tier | Best Locations | Challenging Locations |
|---|---|---|---|---|---|---|
| 1 | Anderson Island | Seattle | 96.8% | Great | 97.0% | 95.4% |
| 2 | Tysons | Washington DC | 96.5% | Great | 97.0% | 95.1% |
| 3 | Wolf Trap | Washington DC | 96.4% | Great | 97.0% | 94.9% |
| 4 | Lake Kathryn | Orlando | 95.6% | Great | 97.0% | 94.2% |
| 5 | Redland Ranch at Elm Creek | San Antonio | 95.2% | Great | 97.0% | 93.8% |
| 6 | Floris | Washington DC | 95.0% | Great | 97.0% | 93.5% |
| 7 | Lake Mack-Forest Hills | Orlando | 94.8% | Great | 96.9% | 93.3% |
| 8 | Silverado | Los Angeles | 94.7% | Great | 96.8% | 93.3% |
| 9 | McNair | Washington DC | 94.6% | Great | 96.7% | 93.2% |
| 10 | Grosse Pointe Farms | Detroit | 94.5% | Great | 96.6% | 93.1% |
| 11 | Northville | New York City | 94.5% | Great | 96.6% | 93.1% |
| 12 | Woodsboro | Washington DC | 94.3% | Great | 96.4% | 92.9% |
| 13 | Sully Square | Washington DC | 94.3% | Great | 96.4% | 92.8% |
| 14 | Emerald Forest | San Antonio | 94.2% | Great | 96.3% | 92.8% |
| 15 | Redland Springs | San Antonio | 94.2% | Great | 96.3% | 92.8% |
| 16 | Centreville | Washington DC | 94.2% | Great | 96.3% | 92.8% |
| 17 | Shelter Island | New York City | 94.1% | Great | 96.2% | 92.7% |
| 18 | Eatonville | Seattle | 94.1% | Great | 96.2% | 92.7% |
| 19 | Chantilly | Washington DC | 94.1% | Great | 96.2% | 92.6% |
| 20 | Flovilla | Atlanta | 94.0% | Great | 96.1% | 92.5% |
| 21 | Sheldon | Houston | 93.8% | Great | 95.9% | 92.4% |
| 22 | Gila Bend | Phoenix | 93.8% | Great | 95.9% | 92.4% |
| 23 | Dunn Loring | Washington DC | 93.8% | Great | 95.9% | 92.4% |
| 24 | Armada | Detroit | 93.8% | Great | 95.9% | 92.4% |
| 25 | Northampton | New York City | 93.8% | Great | 95.9% | 92.3% |
Even within top-ranked neighborhoods, block-level survivability can vary by 10–20 percentage points depending on competitive conditions at the exact address.
For a full explanation of how survivability scores and ranges are calculated, see Survivability Score: How We Calculate It & Why It Matters.
What patterns emerge from the top-performing neighborhoods nationwide?
City Concentration
The top 25 neighborhoods span 10 different cities, with Washington DC claiming 9 of the top spots (36%).
Breakdown of top 25 neighborhoods by city:
- Washington DC: 9 neighborhoods (36% of top 25) — View city guide
- San Antonio: 3 neighborhoods (12% of top 25) — View city guide
- New York City: 3 neighborhoods (12% of top 25) — View city guide
- Seattle: 2 neighborhoods (8% of top 25) — View city guide
- Orlando: 2 neighborhoods (8% of top 25) — View city guide
- Detroit: 2 neighborhoods (8% of top 25) — View city guide
- Los Angeles: 1 neighborhood (4% of top 25) — View city guide
- Atlanta: 1 neighborhood (4% of top 25) — View city guide
- Houston: 1 neighborhood (4% of top 25) — View city guide
- Phoenix: 1 neighborhood (4% of top 25) — View city guide
This distribution has practical implications for European Restaurants operators: cities with multiple neighborhoods in the top 25 offer more site options within a single market, reducing relocation or expansion cost. Cities with a single top-25 neighborhood require more precise site selection — the advantage is concentrated in one area rather than spread across the metro.
Walkability vs. visibility — which wins?
The relatively even distribution of top neighborhoods across 10 cities is consistent with a category where consumer demand is broadly distributed rather than concentrated in specific metros. For European Restaurants operators, this means strong site opportunities exist in multiple markets — the key variable is neighborhood-level competitive conditions rather than city-level market size.
Using neighborhood survivability to pick European Restaurants sites
National rankings are a powerful starting point, but your final site decision should be validated at the address level. StreetSpring's AI models reveal the survivability of businesses in every major U.S. neighborhood, giving agents and entrepreneurs a trusted way to see their future success before opening day. Block-level conditions within any neighborhood can shift survivability by 10–20 points — this ranking narrows your search, and StreetSpring's live tool finalizes it.
For the most accurate assessment:
- Consider neighborhoods in the top 25 as strong starting points
- Examine city-specific guides for additional neighborhood options in your target markets
- Use StreetSpring's address-level tool to evaluate specific storefronts within these neighborhoods
- Factor in your budget, operational requirements, and target demographics
Each neighborhood has detailed analysis available through its city guide, providing block-by-block survivability data for European Restaurants.
Filtering the list to your actual constraints
See also: Best Cities for European Restaurant — our city-level comparison ranks which metros offer the strongest overall conditions for European Restaurants.
Visual Data
Related Resources
Explore top cities represented in these neighborhoods:
- New York City: Best businesses and neighborhoods
- Atlanta: Best businesses and neighborhoods
- Orlando: Best businesses and neighborhoods
- Los Angeles: Best businesses and neighborhoods
- Seattle: Best businesses and neighborhoods
National city rankings: Best cities for European Restaurants
Essential resources:
- How StreetSpring calculates Survivability Scores
- Site selection for landlords
- AI tools for tenant representatives
- StreetSpring vs competitors
Frequently Asked Questions
What demographic factors drive survivability for European Restaurants?
For European Restaurants, StreetSpring's model incorporates neighborhood-level demographic data including population density, median household income, employment rates, and consumer spending on this specific category. These factors vary by business type — the demographic profile that drives survivability for European Restaurant customers may differ significantly from what matters for other business categories.
Which cities appear most frequently in the top 25 neighborhoods for European Restaurants?
The cities most represented in the top 25 for European Restaurants are Washington DC (9), San Antonio (3), New York City (3). This concentration reflects the relative strength of consumer demand and competitive conditions for European Restaurants in these markets. City-specific guides provide deeper analysis of each city's neighborhoods.
How often do neighborhood rankings change?
StreetSpring updates rankings quarterly as new data on business openings, closures, and market conditions becomes available. The current analysis reflects 2026 data. Because competitive conditions shift as new businesses enter or exit a neighborhood, the specific rankings for any given business type can shift between updates — which is why we recommend verifying specific addresses in StreetSpring's live tool before making a final site selection decision.
What type of neighborhood is best for opening a European Restaurant?
The best neighborhoods for European Restaurants share three characteristics: manageable competitive density (few existing direct competitors within the primary trade area), strong consumer spending on this category, and demographic alignment with the typical European Restaurant customer base. In StreetSpring's 2026 data, the top-ranked neighborhoods for European Restaurants combine these factors in a way that produces survivability scores well above the national average of 82.9%. Neighborhoods with dense existing competition or low category spending tend to score significantly lower, regardless of overall foot traffic or prestige.
How do I interpret a survivability score?
A survivability score represents the estimated probability that a business of a specific type will still be operating at a given location after 2 years. A score of 80% means StreetSpring's model predicts an 80% chance of the business surviving past the 2-year mark at that address. Scores are calculated at the address level and reflect competitive density, consumer spending patterns, mobility data, and 80+ additional factors.
How does StreetSpring calculate survivability for European Restaurants specifically?
StreetSpring's model calculates survivability for European Restaurants by analyzing the competitive density of existing European Restaurants within each distance band around the address, the projected consumer spending on European Restaurants in that location, mobility patterns that determine likely customer flow, and 80+ additional factors. The resulting survivability score reflects the estimated probability of a new European Restaurant surviving 2+ years at that specific address.
Are there good opportunities outside the top 25 neighborhoods?
Absolutely. Our analysis covers 8583 neighborhoods across 24 cities. Many neighborhoods outside the top 25 have excellent individual locations for European Restaurants. Neighborhood-level rankings reflect averages — specific addresses within any neighborhood can score well above or below the neighborhood mean. Use city-specific guides and StreetSpring's address-level tool to explore options beyond the top 25.
How does the national ranking for European Restaurants compare to city-level rankings?
The national neighborhood ranking for European Restaurants identifies the strongest neighborhoods across all 24 analyzed metros. City-level rankings provide a more granular view of the best neighborhoods within a specific city. In cases where a city has multiple neighborhoods in the national top 25, the city-level guide shows the full ranking of all neighborhoods in that market — including those outside the national top 25 that may still offer strong site-specific opportunities.
Technical note: Aggregated national survivability rankings across all 24 metros are available in machine-readable format for research and integration purposes.
StreetSpring recalculates survivability using the latest competitive, demographic, and walkability data, so the live score may differ from the static ranges shown here.
Methodology: Neighborhood rankings are based on average Survivability Scores for European Restaurants across all analyzed locations within each neighborhood. Rankings represent neighborhood-level conditions but do not account for block-by-block variation. Coverage includes 8583 neighborhoods across 24 major US cities.