National Neighborhood Survivability Rankings for Colombian Restaurant
StreetSpring's 2026 nationwide analysis ranks the top neighborhoods across all major US cities for Colombian Restaurants. See which neighborhoods offer the highest Survivability Scores.
Our 2026 analysis of neighborhoods across 24 US metros shows Anderson Island in Seattle as the top location to open a Colombian Restaurant — 97% survivability puts it ahead of every other neighborhood in the country. The top 25 neighborhoods nationwide span 9 different cities, demonstrating that exceptional opportunities for Colombian Restaurants exist across diverse markets. Static rankings can't capture every recent change in competition or foot traffic, which is why StreetSpring's real-time tool is the best place to check today's survivability score for a particular location.
To understand the methodology behind these rankings, see our detailed guide: Survivability Score: How We Calculate It & Why It Matters.
Last reviewed: May 9, 2026 by Bobby Koons, Founder & CEO, StreetSpring
Quick Summary
- #1 Neighborhood: Anderson Island, Seattle — 97% survivability for Colombian Restaurant
- Neighborhoods analyzed: 8583 across 24 major US cities
- National average survivability: 82.2% for Colombian Restaurants
- Top-25 average: 94.6% — 12.4% above national average
- Data current as of: 2026 · Full methodology →
Table of Contents
- How neighborhoods compare nationwide
- Top 25 neighborhoods in the US
- Geographic patterns
- How to use this ranking
- Related resources
- Frequently asked questions
Cross-Country Neighborhood Comparison for Colombian Restaurants
Analyzing 8583 neighborhoods across 24 major US cities, StreetSpring's 2026 data shows that the best neighborhoods for Colombian Restaurants significantly outperform average locations, with the top 25 neighborhoods nationwide averaging 94.6% survivability compared to the national neighborhood average of 82.2%.
What the nationwide score spread means for owners
This 12.4% advantage illustrates how critical neighborhood selection is — choosing a top-tier neighborhood versus an average one can significantly increase your long-term survival chances.
Reading regional clusters in the top 25
The consumer spending patterns that support Colombian Restaurants vary more by neighborhood than by city — which is why neighborhood-level analysis is particularly valuable for this business category. A 12.4% difference between top neighborhoods and the national average indicates that location selection has an above-average impact on outcomes for Colombian Restaurants compared to categories with narrower spreads. StreetSpring's address-level scoring identifies the specific blocks within any neighborhood where a given business type will outperform.
Importantly, top-performing neighborhoods aren't concentrated in just a few cities. The top 25 neighborhoods represent 9 different cities. This means entrepreneurs focused on Colombian Restaurants can find exceptional opportunities across the United States, not just in traditionally strong markets.
A great product in the wrong location will underperform; an average product in the right location can thrive.
What are the best neighborhoods in the United States to open a Colombian Restaurant?
| Comparison factor | Where high-survivability neighborhoods excel | Where lower-survivability neighborhoods fall short |
|---|---|---|
| Subtype-specific density saturation | Neighborhoods with the subtype below the optimal density curve — room for a new entrant without cannibalizing demand. | Neighborhoods at or past the saturation point for the subtype, where new entrants face zero-sum competition. |
| Commercial rent-to-revenue ratio | Neighborhoods where commercial $/sqft fits the subtype's revenue-per-sqft economics with margin. | Neighborhoods where rent inflation has outrun revenue growth — operators paying lifestyle rents. |
| Anchor-venue spillover | Neighborhoods within 0.25 miles of a major anchor (transit hub, university gate, hospital main entrance, concert venue). | Neighborhoods where the nearest anchor is past walking distance — no spillover demand. |
Why these neighborhoods rank highest
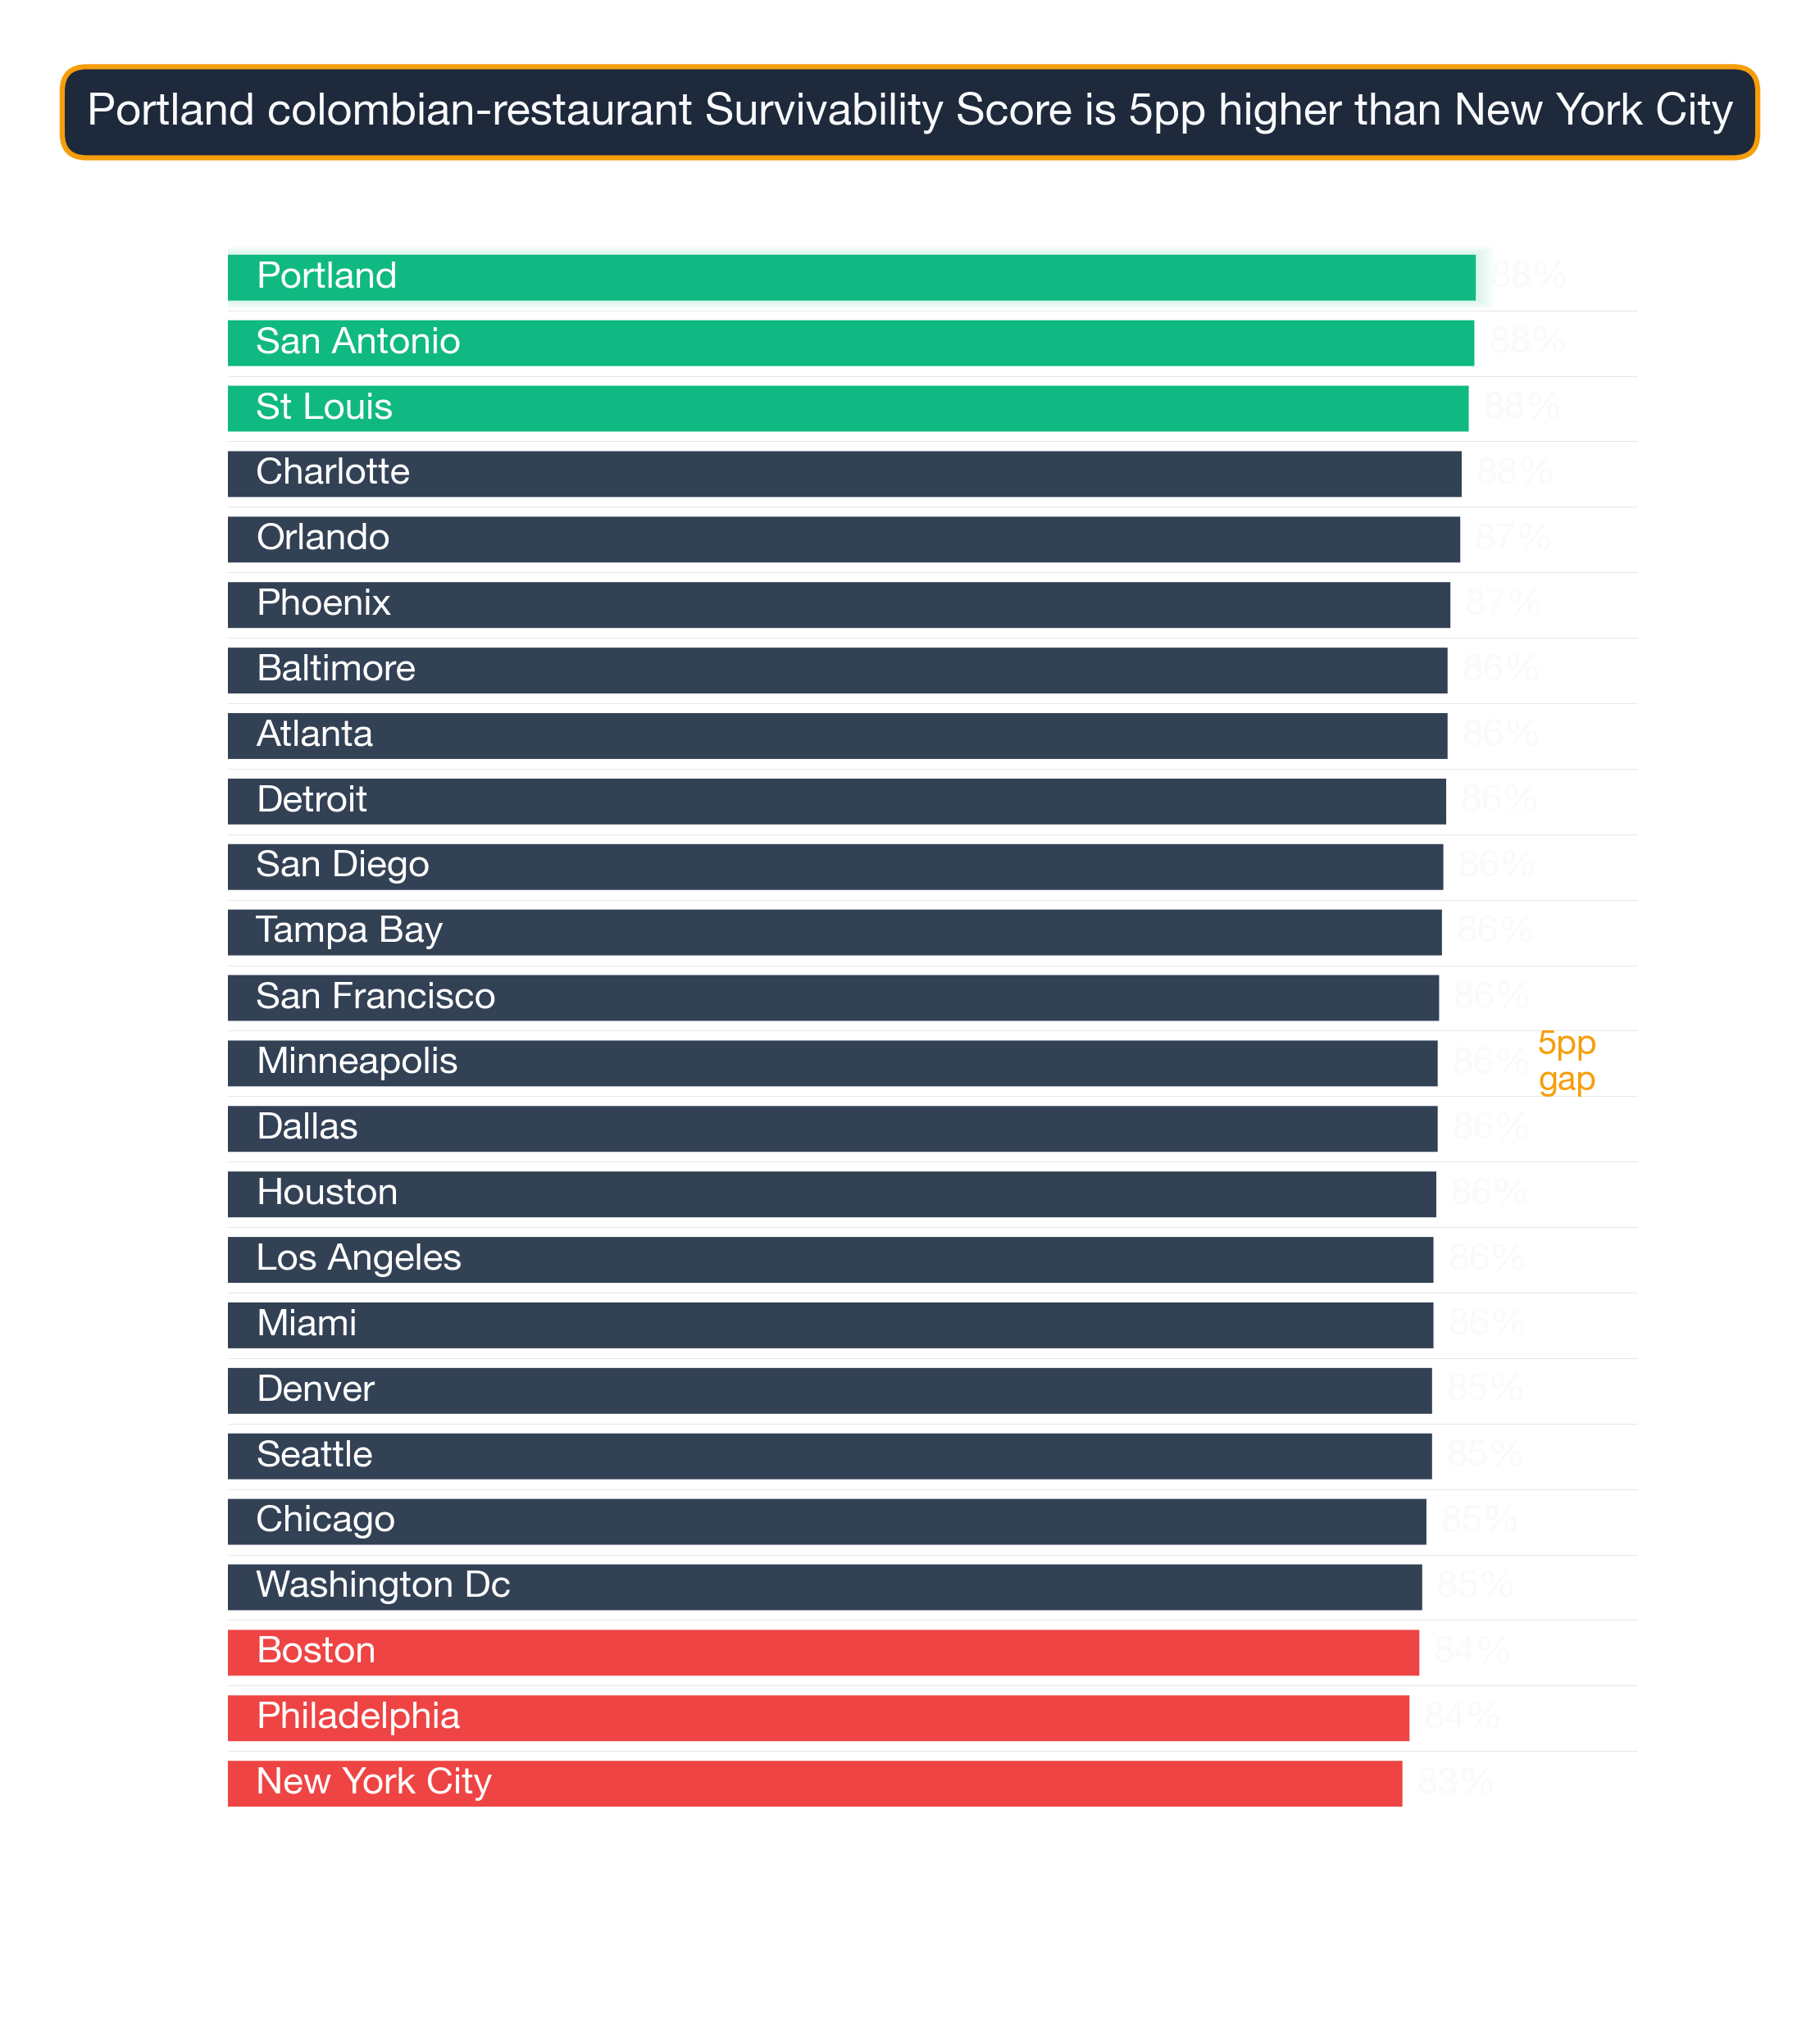
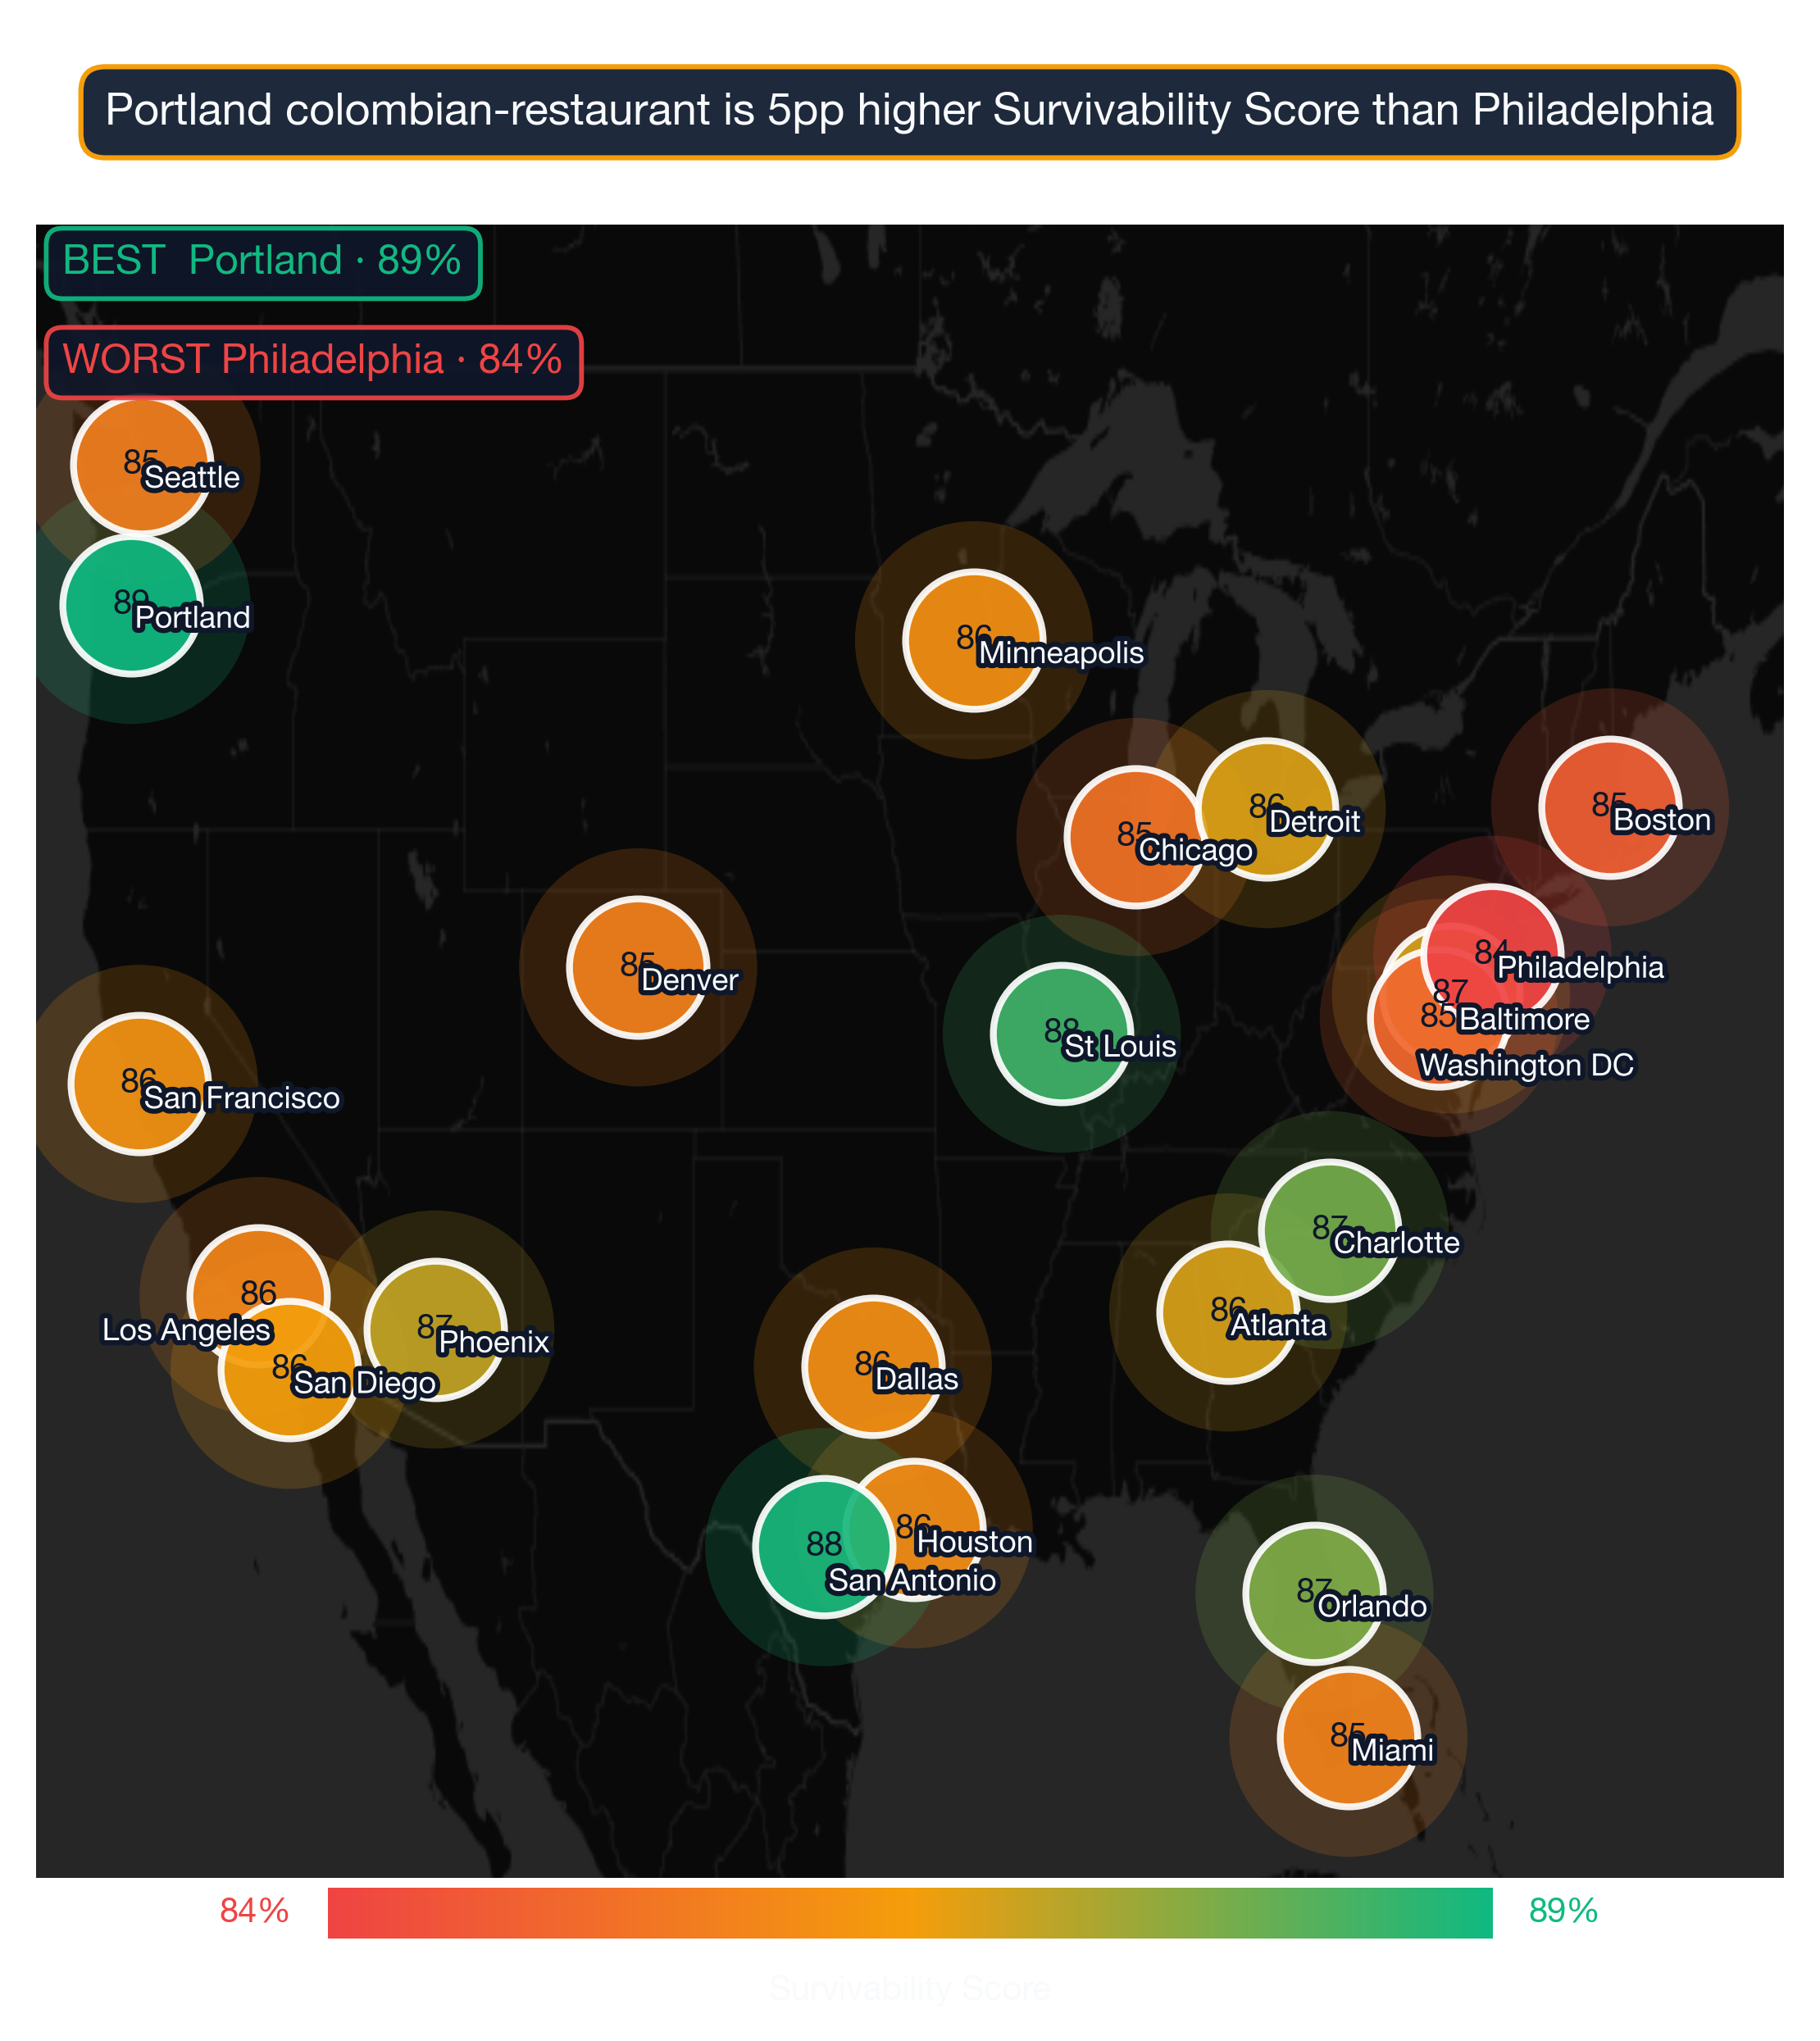
Survivability range for top, middle, and last-ranked neighborhoods. Box = best-to-challenging range; white line = average. Anderson Island, Seattle leads at 97% in 2026. Full methodology →
The top 25 neighborhoods nationwide for Colombian Restaurants are:
| # | Neighborhood | City | Avg Survival | Tier | Best Locations | Challenging Locations |
|---|---|---|---|---|---|---|
| 1 | Anderson Island | Seattle | 96.8% | Great | 97.0% | 95.2% |
| 2 | Tysons | Washington DC | 96.5% | Great | 97.0% | 94.9% |
| 3 | Wolf Trap | Washington DC | 96.4% | Great | 97.0% | 94.7% |
| 4 | Dunn Loring | Washington DC | 96.0% | Great | 97.0% | 94.4% |
| 5 | Lake Kathryn | Orlando | 95.5% | Great | 97.0% | 93.9% |
| 6 | West Falls Church | Washington DC | 95.2% | Great | 97.0% | 93.5% |
| 7 | Floris | Washington DC | 95.0% | Great | 97.0% | 93.3% |
| 8 | Lake Mack-Forest Hills | Orlando | 94.6% | Great | 96.7% | 93.0% |
| 9 | McNair | Washington DC | 94.6% | Great | 96.7% | 93.0% |
| 10 | Redland Ranch at Elm Creek | San Antonio | 94.5% | Great | 96.6% | 92.9% |
| 11 | Silverado | Los Angeles | 94.5% | Great | 96.6% | 92.9% |
| 12 | Northville | New York City | 94.4% | Great | 96.5% | 92.8% |
| 13 | Grosse Pointe Farms | Detroit | 94.4% | Great | 96.5% | 92.7% |
| 14 | Sully Square | Washington DC | 94.3% | Great | 96.4% | 92.6% |
| 15 | Centreville | Washington DC | 94.2% | Great | 96.3% | 92.5% |
| 16 | Emerald Forest | San Antonio | 94.1% | Great | 96.2% | 92.5% |
| 17 | Shelter Island | New York City | 94.1% | Great | 96.2% | 92.5% |
| 18 | Woodsboro | Washington DC | 94.0% | Great | 96.1% | 92.4% |
| 19 | McLean | Washington DC | 93.9% | Great | 96.0% | 92.3% |
| 20 | Chantilly | Washington DC | 93.9% | Great | 96.0% | 92.3% |
| 21 | Eatonville | Seattle | 93.9% | Great | 96.0% | 92.2% |
| 22 | Flovilla | Atlanta | 93.8% | Great | 95.9% | 92.2% |
| 23 | Redland Springs | San Antonio | 93.8% | Great | 95.9% | 92.2% |
| 24 | Gila Bend | Phoenix | 93.8% | Great | 95.9% | 92.1% |
| 25 | Hybla Valley | Washington DC | 93.7% | Great | 95.8% | 92.1% |
Even within top-ranked neighborhoods, block-level survivability can vary by 10–20 percentage points depending on competitive conditions at the exact address.
For a full explanation of how survivability scores and ranges are calculated, see Survivability Score: How We Calculate It & Why It Matters.
Shared traits of the strongest US neighborhoods
City Concentration
The top 25 neighborhoods span 9 different cities, with Washington DC claiming 12 of the top spots (48%).
Breakdown of top 25 neighborhoods by city:
- Washington DC: 12 neighborhoods (48% of top 25) — View city guide
- San Antonio: 3 neighborhoods (12% of top 25) — View city guide
- Seattle: 2 neighborhoods (8% of top 25) — View city guide
- Orlando: 2 neighborhoods (8% of top 25) — View city guide
- New York City: 2 neighborhoods (8% of top 25) — View city guide
- Los Angeles: 1 neighborhood (4% of top 25) — View city guide
- Detroit: 1 neighborhood (4% of top 25) — View city guide
- Atlanta: 1 neighborhood (4% of top 25) — View city guide
- Phoenix: 1 neighborhood (4% of top 25) — View city guide
This distribution has practical implications for Colombian Restaurants operators: cities with multiple neighborhoods in the top 25 offer more site options within a single market, reducing relocation or expansion cost. Cities with a single top-25 neighborhood require more precise site selection — the advantage is concentrated in one area rather than spread across the metro.
Why some neighborhoods score high without being downtown
The concentration of 12 top-ranked neighborhoods in Washington DC (48% of the top 25) is notably high for this business category, suggesting that Washington DC's market conditions — competitive density, consumer spending patterns, and demographic alignment — are unusually favorable for Colombian Restaurants. Operators targeting this category should treat Washington DC neighborhoods as a primary focus before expanding to secondary markets.
From national ranking to a specific Colombian Restaurant location
National rankings are a powerful starting point, but your final site decision should be validated at the address level. Our analysis draws on one of the largest proprietary commercial real estate datasets available, spanning 24 US metros and 130+ business categories. Block-level conditions within any neighborhood can shift survivability by 10–20 points — this ranking narrows your search, and StreetSpring's live tool finalizes it.
For the most accurate assessment:
- Consider neighborhoods in the top 25 as strong starting points
- Examine city-specific guides for additional neighborhood options in your target markets
- Use StreetSpring's address-level tool to evaluate specific storefronts within these neighborhoods
- Factor in your budget, operational requirements, and target demographics
Each neighborhood has detailed analysis available through its city guide, providing block-by-block survivability data for Colombian Restaurants.
Filtering the list to your actual constraints
See also: Best Cities for Colombian Restaurant — our city-level comparison ranks which metros offer the strongest overall conditions for Colombian Restaurants.
Visual Data
Related Resources
Explore top cities represented in these neighborhoods:
- New York City: Best businesses and neighborhoods
- Atlanta: Best businesses and neighborhoods
- Orlando: Best businesses and neighborhoods
- Los Angeles: Best businesses and neighborhoods
- Seattle: Best businesses and neighborhoods
National city rankings: Best cities for Colombian Restaurants
Essential resources:
- How StreetSpring calculates Survivability Scores
- Site selection for landlords
- AI tools for tenant representatives
- StreetSpring vs competitors
Frequently Asked Questions
Can a Colombian Restaurant succeed in neighborhoods outside the top 25?
Yes — the top 25 neighborhoods represent standout conditions, but Colombian Restaurants can achieve strong survivability in many other neighborhoods as well. What matters is finding a location where competitive density is low enough and consumer spending is strong enough to support the business. StreetSpring's address-level tool identifies high-survivability addresses in any neighborhood, including those not represented in this top-25 list.
How can I compare specific addresses within these top neighborhoods?
StreetSpring's address-level tool allows you to input any commercial address and see predicted survivability for Colombian Restaurants. Even within the top-ranked neighborhoods, survivability varies meaningfully by block — address-level scoring is the most precise way to evaluate a specific site.
How do I interpret a survivability score?
A survivability score represents the estimated probability that a business of a specific type will still be operating at a given location after 2 years. A score of 80% means StreetSpring's model predicts an 80% chance of the business surviving past the 2-year mark at that address. Scores are calculated at the address level and reflect competitive density, consumer spending patterns, mobility data, and 80+ additional factors.
Where can I download the underlying data?
The full national survivability dataset is available as a free download: https://streetspring.com/resources/data/national-survivability-scores-2026.csv. The CSV includes all business subtypes and neighborhoods covered in this analysis, licensed under CC BY 4.0.
What type of neighborhood is best for opening a Colombian Restaurant?
The best neighborhoods for Colombian Restaurants share three characteristics: manageable competitive density (few existing direct competitors within the primary trade area), strong consumer spending on this category, and demographic alignment with the typical Colombian Restaurant customer base. In StreetSpring's 2026 data, the top-ranked neighborhoods for Colombian Restaurants combine these factors in a way that produces survivability scores well above the national average of 82.2%. Neighborhoods with dense existing competition or low category spending tend to score significantly lower, regardless of overall foot traffic or prestige.
What makes Anderson Island in Seattle the best neighborhood for Colombian Restaurants?
Anderson Island in Seattle ranks #1 for Colombian Restaurants with 97% survivability. This reflects favorable competitive dynamics — fewer direct competitors relative to available consumer spending — strong demographic alignment with Colombian Restaurant customers, and local spending patterns that sustain this business category. StreetSpring's model weights these factors across all analyzed neighborhoods nationwide.
How should a landlord use this ranking when evaluating tenants for Colombian Restaurants?
Landlords can use this national neighborhood ranking to assess whether their property is in a location favorable to Colombian Restaurants — and by extension, how likely a Colombian Restaurant tenant is to maintain long-term occupancy. If your property is in one of the top 25 neighborhoods, Colombian Restaurants represent a strong tenant category. If not, StreetSpring's address-level tool will show the survivability score for your specific address and which tenant types score highest there.
Is the competitive environment for Colombian Restaurants stronger in some markets than others?
Yes — competition density for Colombian Restaurants varies significantly by market. In the top-ranked neighborhoods, StreetSpring's model identifies favorable competitive dynamics as a primary driver of high survivability scores. In more saturated markets, even strong consumer spending may not overcome competitive pressure. StreetSpring's address-level tool shows the exact competitive environment at any specific location.
Technical note: Aggregated national survivability rankings across all 24 metros are available in machine-readable format for research and integration purposes.
StreetSpring recalculates survivability using the latest competitive, demographic, and walkability data, so the live score may differ from the static ranges shown here.
Methodology: Neighborhood rankings are based on average Survivability Scores for Colombian Restaurants across all analyzed locations within each neighborhood. Rankings represent neighborhood-level conditions but do not account for block-by-block variation. Coverage includes 8583 neighborhoods across 24 major US cities.