City Survivability Rankings for Caribbean / Latin Restaurant
StreetSpring's 2026 analysis ranks the top cities for Caribbean / Latin Restaurants across the US by Survivability Scores. See which cities offer the best chances for a Caribbean / Latin Restaurant to succeed.
Quick Summary
- The highest-survivability city for Caribbean / Latin Restaurant is San Antonio — 87% average survivability
- 24 of 24 analyzed US metros score above 70% for Caribbean / Latin Restaurant survivability
- The lowest-ranked city is New York City at 83%
- National average survivability score for Caribbean / Latin Restaurant: 84.7%
- Data reflects 2026 StreetSpring survivability analysis across 24 US metro areas · Full methodology →
Table of Contents
- Summary
- Top Cities for Caribbean / Latin Restaurants
- Key Insights
- What Makes These Cities Stand Out?
- Best Neighborhoods Across the Spectrum
- Related Resources
- How current is this ranking?
- Can a Caribbean / Latin Restaurant succeed in cities not ranked in the top 10?
- What tools can help me choose the right city for a Caribbean / Latin Restaurant?
- Which US city has the best survivability for Caribbean / Latin Restaurants?
Summary
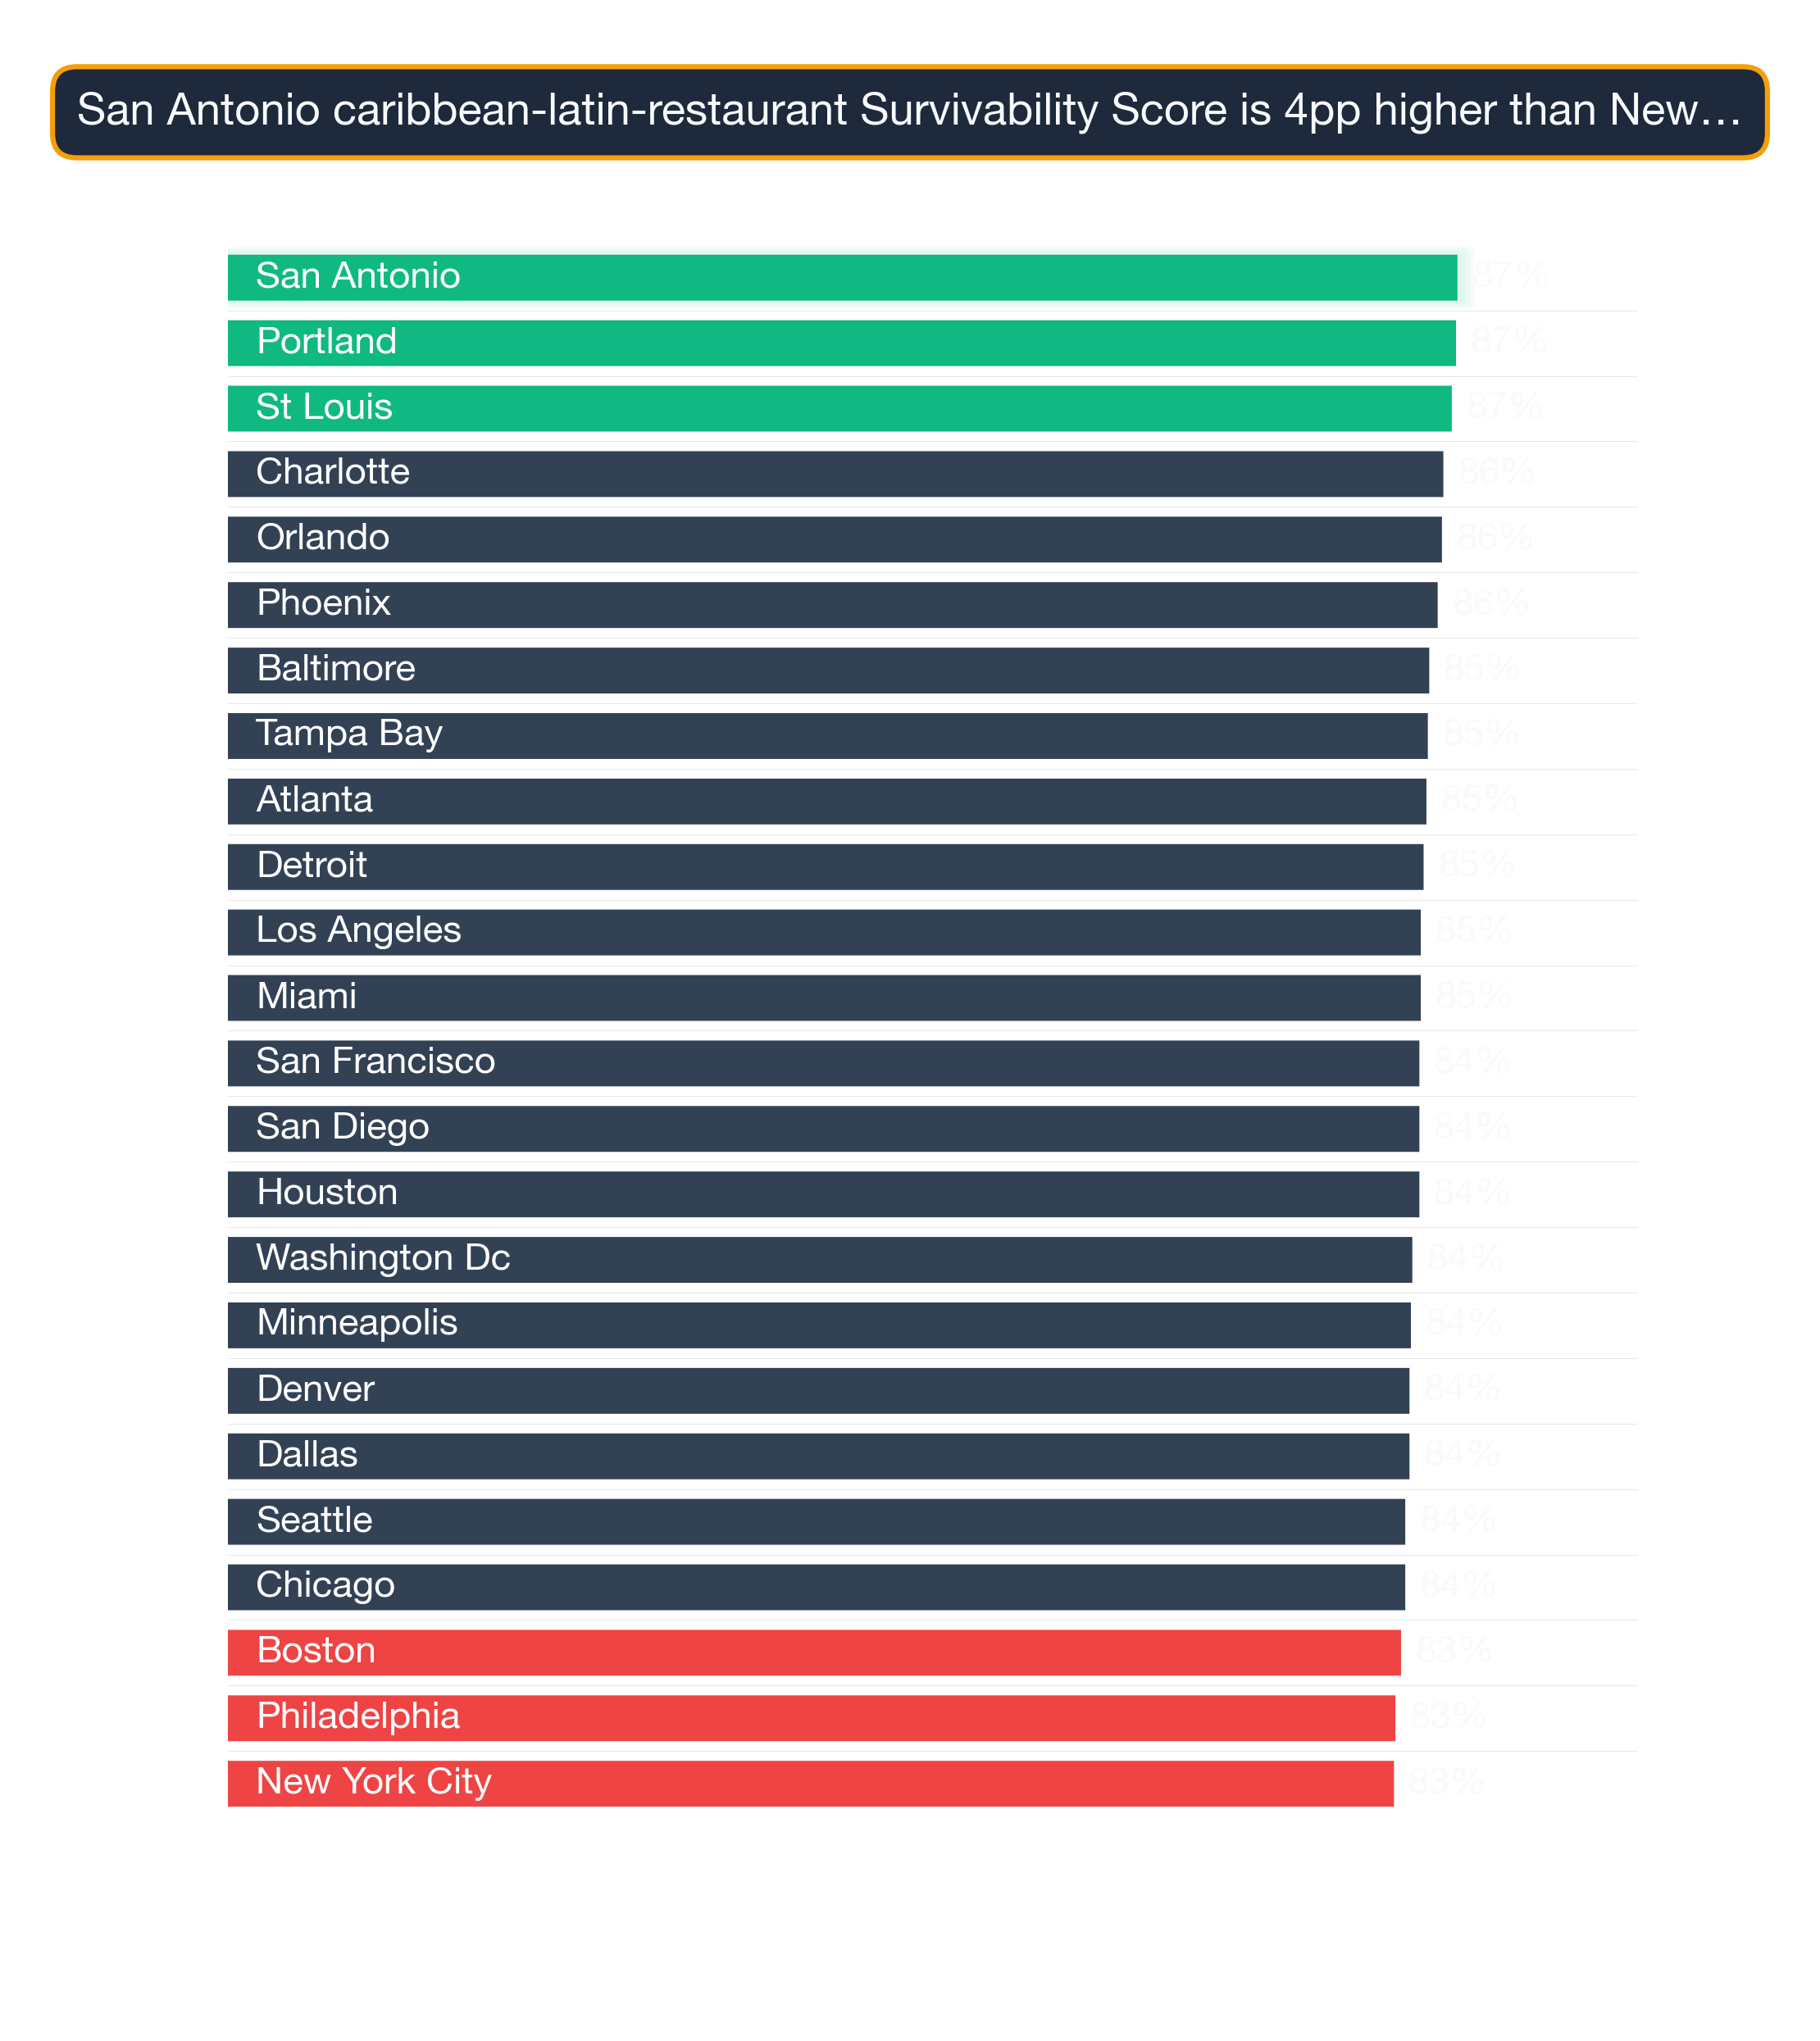
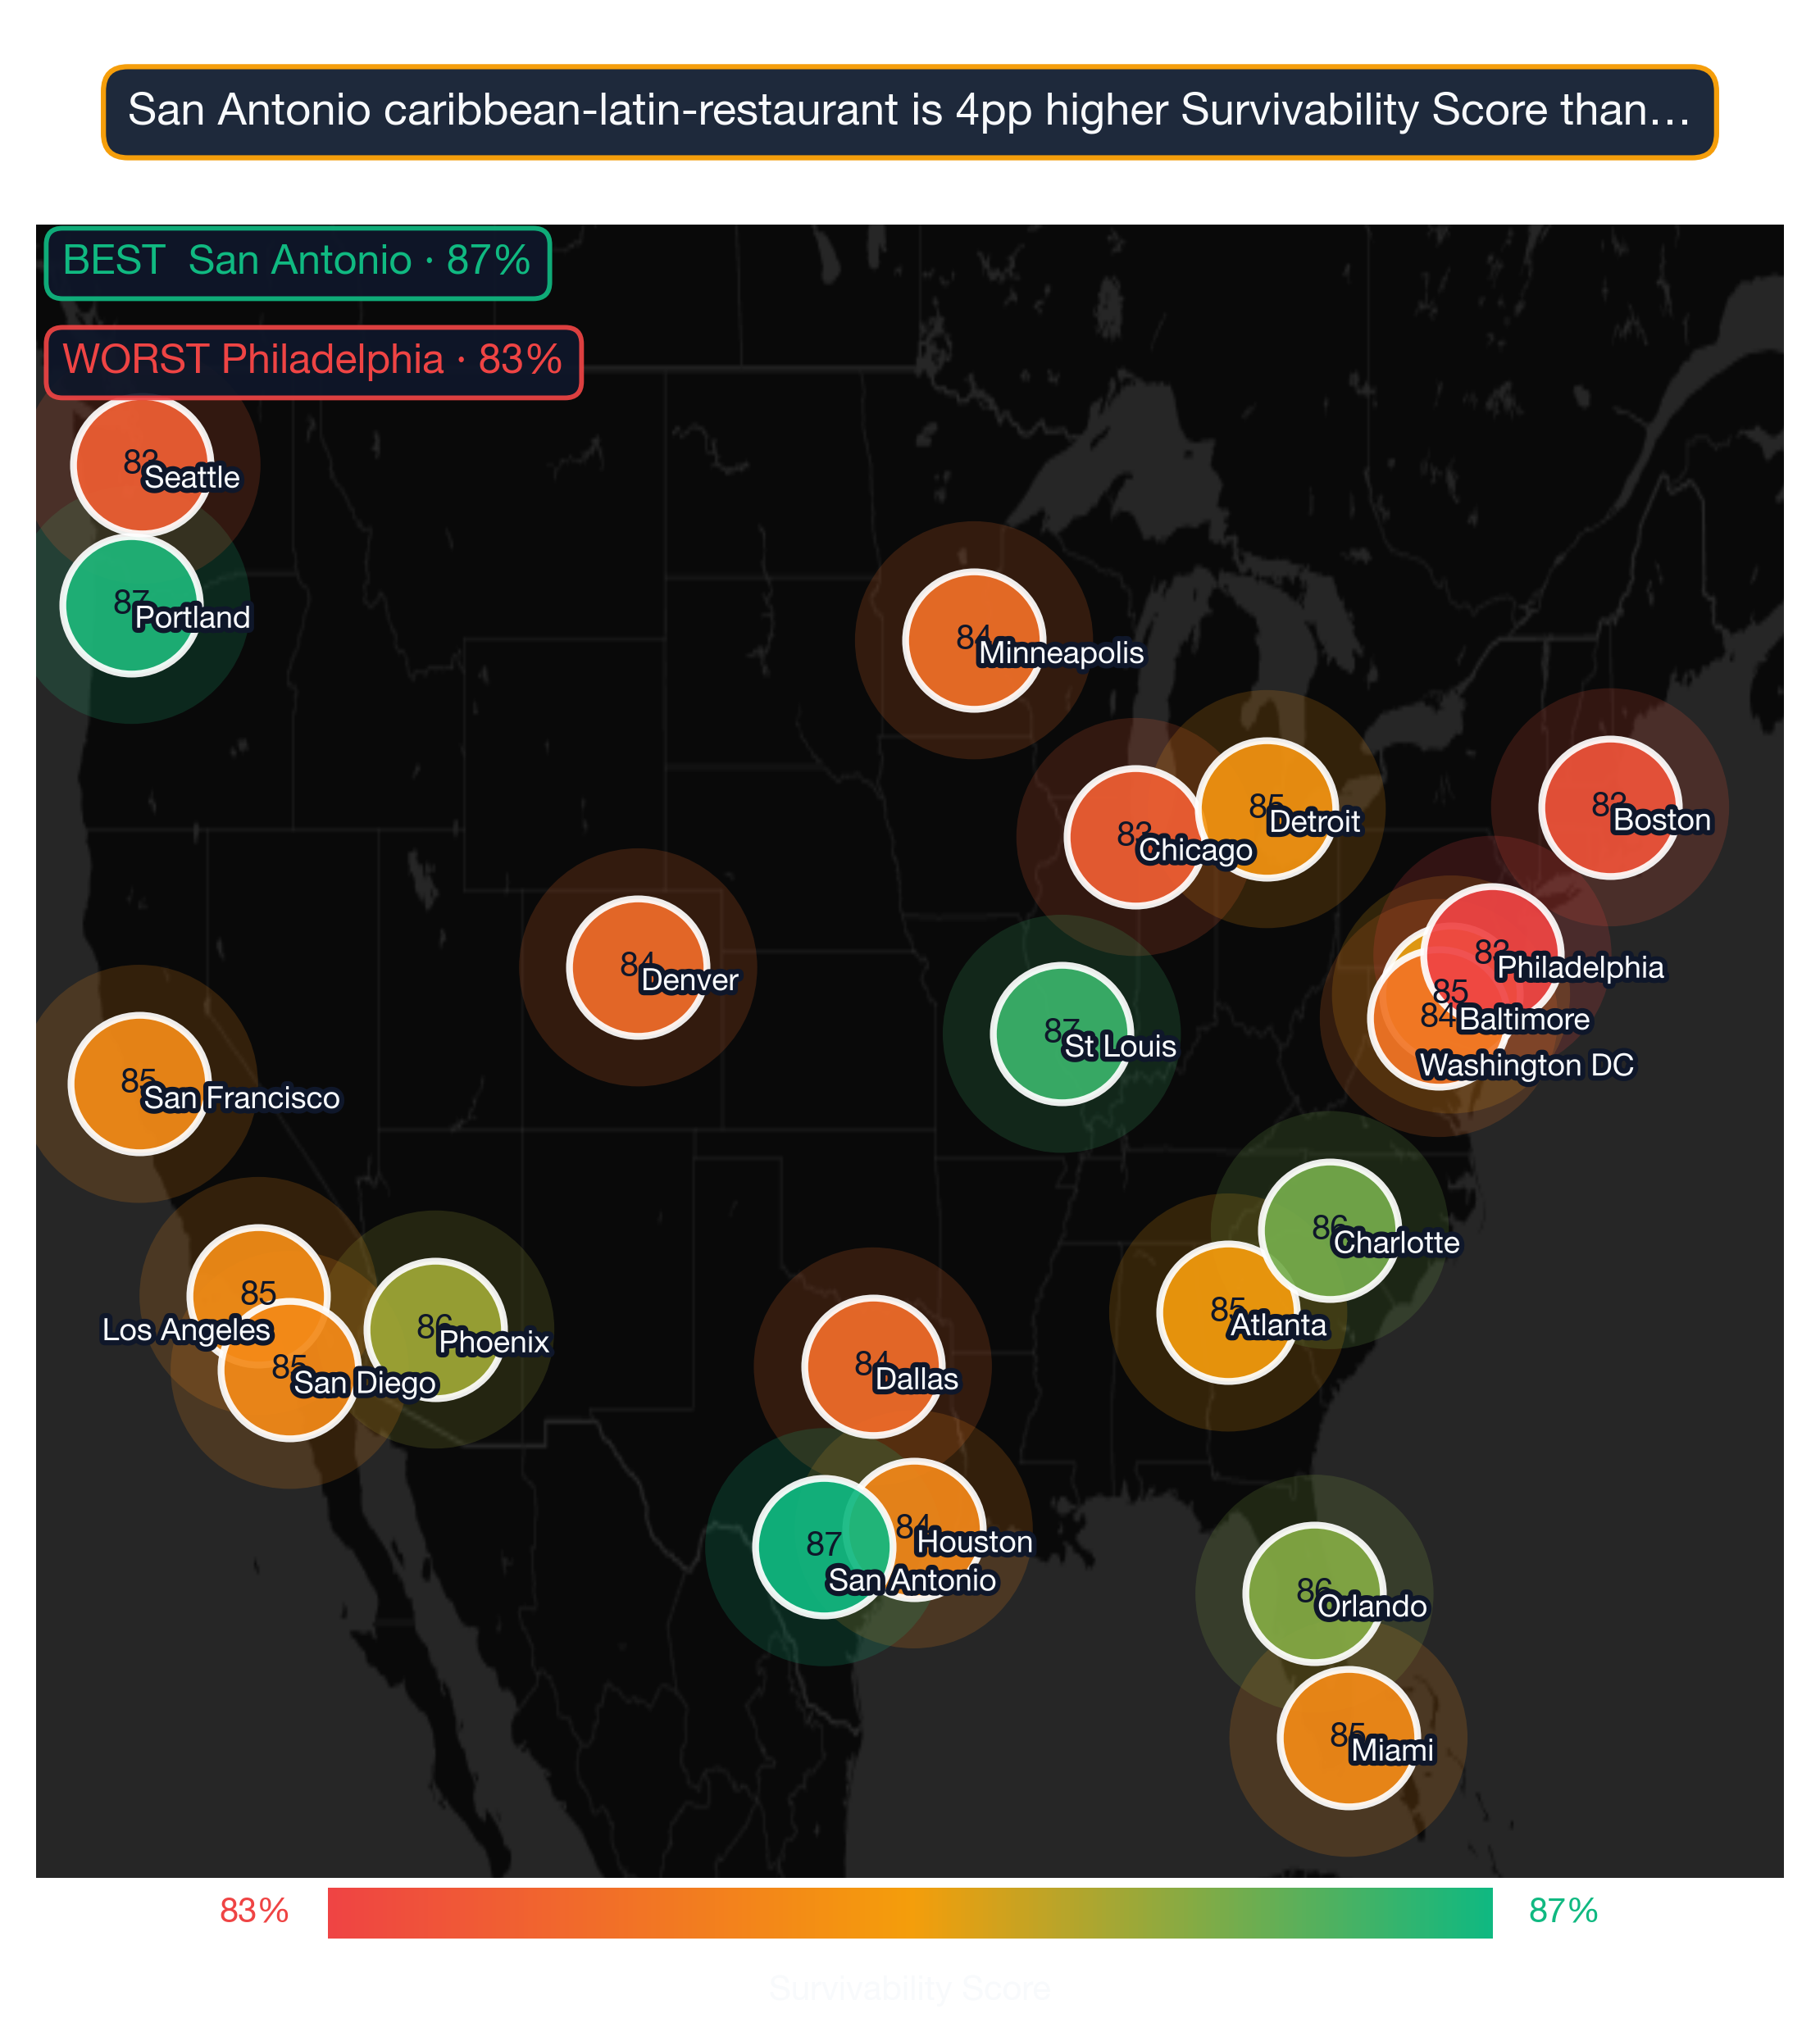
According to StreetSpring's 2026 nationwide analysis, San Antonio ranks as the #1 city for opening a Caribbean / Latin Restaurant in the United States, with an average 87% chance of surviving more than 2 years. Following close behind are Portland with 87%, and St Louis with 87%. StreetSpring's 24-city analysis places the national average for Caribbean / Latin Restaurants at 84.7%, a baseline that San Antonio comfortably exceeds. These averages mask significant neighborhood-by-neighborhood variation; a lower-ranked city can still contain high-potential storefronts. Pair these survivability scores with StreetSpring's live tool to get a real-time view before making a final decision.
Survivability ranges reflect best and worst storefront conditions within each city. See our full methodology →

Caribbean / Latin Restaurant city survivability rankings — San Antonio leads among 24 US metros at 87% in 2026
The 24-City Survivability Index for Caribbean / Latin Restaurants
Based on StreetSpring's analysis of 24 major metropolitan areas, these cities offer the strongest prospects for Caribbean / Latin Restaurants:
1. San Antonio Metro: San Antonio-New Braunfels, TX
- Best locations: 91.6% – 97.0%
- Average locations: 83.7% – 88.4%
- Challenging locations: 58.0% – 78.4%
- Explore Caribbean / Latin Restaurant neighborhoods in San Antonio →
Where the top 5 cluster, and the surprising outliers
2. Portland Metro: Portland-Vancouver-Hillsboro, OR-WA
- Best locations: 91.5% – 97.0%
- Average locations: 83.7% – 88.2%
- Challenging locations: 59.0% – 78.6%
- Explore Caribbean / Latin Restaurant neighborhoods in Portland →
3. St Louis
- Best locations: 91.4% – 97.0%
- Average locations: 83.3% – 88.0%
- Challenging locations: 58.0% – 78.1%
- Explore Caribbean / Latin Restaurant neighborhoods in St Louis →
4. Charlotte Metro: Charlotte-Concord-Gastonia, NC-SC
- Best locations: 91.1% – 97.0%
- Average locations: 82.8% – 87.5%
- Challenging locations: 58.0% – 77.7%
- Explore Caribbean / Latin Restaurant neighborhoods in Charlotte →
5. Orlando Metro: Orlando-Kissimmee-Sanford, FL
- Best locations: 91.0% – 97.0%
- Average locations: 82.8% – 87.4%
- Challenging locations: 59.0% – 78.0%
- Explore Caribbean / Latin Restaurant neighborhoods in Orlando →
6. Phoenix Metro: Phoenix-Mesa-Chandler, AZ
- Best locations: 90.9% – 97.0%
- Average locations: 82.4% – 87.2%
- Challenging locations: 57.0% – 77.2%
- Explore Caribbean / Latin Restaurant neighborhoods in Phoenix →
7. Baltimore Metro: Baltimore-Columbia-Towson, MD
- Best locations: 90.5% – 97.0%
- Average locations: 82.0% – 86.6%
- Challenging locations: 59.0% – 77.3%
- Explore Caribbean / Latin Restaurant neighborhoods in Baltimore →
8. Tampa Bay Metro: Tampa-St. Petersburg-Clearwater, FL
- Best locations: 90.4% – 97.0%
- Average locations: 81.6% – 86.5%
- Challenging locations: 56.0% – 76.4%
- Explore Caribbean / Latin Restaurant neighborhoods in Tampa Bay →
9. Atlanta Metro: Atlanta-Sandy Springs-Roswell, GA
- Best locations: 90.4% – 97.0%
- Average locations: 81.6% – 86.4%
- Challenging locations: 57.0% – 76.6%
- Explore Caribbean / Latin Restaurant neighborhoods in Atlanta →
10. Detroit Metro: Detroit-Warren-Dearborn, MI
- Best locations: 90.3% – 97.0%
- Average locations: 81.5% – 86.2%
- Challenging locations: 58.0% – 76.7%
- Explore Caribbean / Latin Restaurant neighborhoods in Detroit →
11. Los Angeles Metro: Los Angeles-Long Beach-Anaheim, CA
- Best locations: 90.2% – 97.0%
- Average locations: 80.9% – 86.1%
- Challenging locations: 54.0% – 75.4%
- Explore Caribbean / Latin Restaurant neighborhoods in Los Angeles →
12. Miami Metro: Miami-Fort Lauderdale-West Palm Beach, FL
- Best locations: 90.2% – 97.0%
- Average locations: 81.6% – 86.1%
- Challenging locations: 60.0% – 77.2%
- Explore Caribbean / Latin Restaurant neighborhoods in Miami →
Reading the gap from #1 to the median city
13. San Francisco Metro: San Francisco-Oakland-Fremont, CA
- Best locations: 90.2% – 97.0%
- Average locations: 81.0% – 86.0%
- Challenging locations: 55.0% – 75.7%
- Explore Caribbean / Latin Restaurant neighborhoods in San Francisco →
14. San Diego Metro: San Diego-Chula Vista-Carlsbad, CA
- Best locations: 90.1% – 97.0%
- Average locations: 81.3% – 86.0%
- Challenging locations: 58.0% – 76.6%
- Explore Caribbean / Latin Restaurant neighborhoods in San Diego →
15. Houston Metro: Houston-Pasadena-The Woodlands, TX
- Best locations: 90.1% – 97.0%
- Average locations: 81.3% – 86.0%
- Challenging locations: 58.0% – 76.5%
- Explore Caribbean / Latin Restaurant neighborhoods in Houston →
16. Washington DC Metro: Washington-Arlington-Alexandria, DC-VA-MD-WV
- Best locations: 89.9% – 97.0%
- Average locations: 80.8% – 85.6%
- Challenging locations: 57.0% – 75.9%
- Explore Caribbean / Latin Restaurant neighborhoods in Washington DC →
17. Minneapolis Metro: Minneapolis-St. Paul-Bloomington, MN-WI
- Best locations: 89.8% – 97.0%
- Average locations: 80.7% – 85.5%
- Challenging locations: 57.0% – 75.8%
- Explore Caribbean / Latin Restaurant neighborhoods in Minneapolis →
18. Dallas Metro: Dallas-Fort Worth-Arlington, TX
- Best locations: 89.3% – 96.0%
- Average locations: 81.2% – 85.3%
- Challenging locations: 62.0% – 77.3%
- Explore Caribbean / Latin Restaurant neighborhoods in Dallas →
19. Denver Metro: Denver-Aurora-Centennial, CO
- Best locations: 89.8% – 97.0%
- Average locations: 80.6% – 85.4%
- Challenging locations: 57.0% – 75.8%
- Explore Caribbean / Latin Restaurant neighborhoods in Denver →
20. Seattle Metro: Seattle-Tacoma-Bellevue, WA
- Best locations: 89.6% – 97.0%
- Average locations: 80.1% – 85.1%
- Challenging locations: 55.0% – 74.9%
- Explore Caribbean / Latin Restaurant neighborhoods in Seattle →
21. Chicago Metro: Chicago-Naperville-Elgin, IL-IN
- Best locations: 89.6% – 97.0%
- Average locations: 80.2% – 85.1%
- Challenging locations: 56.0% – 75.2%
- Explore Caribbean / Latin Restaurant neighborhoods in Chicago →
22. Boston Metro: Boston-Cambridge-Newton, MA-NH
- Best locations: 89.4% – 97.0%
- Average locations: 79.9% – 84.9%
- Challenging locations: 56.0% – 75.0%
- Explore Caribbean / Latin Restaurant neighborhoods in Boston →
23. Philadelphia Metro: Philadelphia-Camden-Wilmington, PA-NJ-DE-MD
- Best locations: 89.2% – 97.0%
- Average locations: 79.6% – 84.5%
- Challenging locations: 56.0% – 74.8%
- Explore Caribbean / Latin Restaurant neighborhoods in Philadelphia →
24. New York City Metro: New York-Newark-Jersey City, NY-NJ
- Best locations: 89.1% – 97.0%
- Average locations: 79.3% – 84.4%
- Challenging locations: 55.0% – 74.4%
- Explore Caribbean / Latin Restaurant neighborhoods in New York City →
Patterns Across the National Picture
| Comparison factor | Top-tier city pattern | Bottom-tier city pattern |
|---|---|---|
| Climate-driven seasonality | Cities where the subtype's peak season aligns with the local climate calendar (e.g., year-round outdoor dining in mild markets). | Cities with extreme seasonality that compresses revenue into 4–6 month windows. |
| BLS QCEW retail employment trend | Cities with positive 3-year retail employment growth — proxy for local demand expansion. | Cities showing flat or declining retail employment over the same window. |
| Anchor-tenant density | Cities with high concentration of universities, hospitals, transit hubs within a 1-mile radius of typical storefronts. | Cities where anchor institutions are isolated in suburbs or single-purpose campuses with no street-level spillover. |
Wide variation between cities: The difference between the #1 city (San Antonio at 87.2%) and the #24 city (New York City at 82.7%) is 4.5 percentage points. A 0.1-point spread at the top of the rankings indicates that selecting San Antonio over a lower-ranked city represents a substantial survivability advantage for Caribbean / Latin Restaurants.
Where this ranking breaks it
Strong performers: 24 cities show Survivability Scores above 80%, indicating highly favorable conditions for Caribbean / Latin Restaurants.
National average: Across all 24 analyzed cities, the average survivability for a Caribbean / Latin Restaurant is 84.7%.
What the Leaders Share
The top-ranked cities share several characteristics that favor Caribbean / Latin Restaurants:
- Strong survivability signals: San Antonio leads with a 87% average survivability score for Caribbean / Latin Restaurants — significantly above the national average for this business category.
- Competition density: The top cities show favorable competitor-to-opportunity ratios for Caribbean / Latin Restaurants, meaning lower saturation and higher odds of capturing an underserved customer base.
- Economic conditions: All top-ranked cities show strong median household incomes and low vacancy rates in the neighborhoods where Caribbean / Latin Restaurants perform best.
- Low market saturation: Top cities for Caribbean / Latin Restaurants have fewer direct competitors per square mile than lower-ranked metros, leaving meaningful whitespace for well-positioned new entrants.
Across the U.S., real estate professionals and business owners rely on StreetSpring's AI predictions to understand where a new venture is most likely to thrive, before signing a lease. The analysis behind these rankings spans millions of data points across competition, spending, and mobility. StreetSpring uses custom-built, proprietary algorithms to produce these predictions.
Where Caribbean / Latin Restaurants Thrive Within Each City
Strong opportunities for Caribbean / Latin Restaurants aren't limited to the highest-ranked cities. Here are top neighborhoods at different points in the national spectrum:
San Francisco — ranked #13 of 24 — a middle-of-the-pack national market
- Glen-Park (86% survivability)
- Mission-Bay (86% survivability)
- Marina (85% survivability)
- South-Beach (84% survivability)
- Sea-Cliff (84% survivability)
See full neighborhood rankings for San Francisco →
New York City — ranked #24 of 24 — among the lower-ranked national markets
- Rockaway-Park (89% survivability)
- Coney-Island (87% survivability)
- Brighton-Beach (86% survivability)
- Newark (86% survivability)
- Far-Rockaway (84% survivability)
See full neighborhood rankings for New York City →
Don't let a city's national rank deter exploration: every city has neighborhoods that buck the city-wide average.
Visual Data
Related Resources
City-specific guides: For detailed neighborhood-level analysis, explore our city guides:
- Survivability Rankings for Caribbean / Latin Restaurant in San Antonio
- Business Survivability Rankings: San Antonio
- Survivability Rankings for Caribbean / Latin Restaurant in Portland
- Business Survivability Rankings: Portland
- Survivability Rankings for Caribbean / Latin Restaurant in St Louis
- Business Survivability Rankings: St Louis
- Survivability Rankings for Caribbean / Latin Restaurant in Charlotte
- Business Survivability Rankings: Charlotte
- Survivability Rankings for Caribbean / Latin Restaurant in Orlando
- Business Survivability Rankings: Orlando
National guides:
- National Neighborhood Survivability Rankings for Caribbean / Latin Restaurants
- Neighborhood Survivability Rankings: San Antonio
When was this ranking last refreshed?
Rankings are updated quarterly. The current data reflects StreetSpring's 2026 analysis, with the next full dataset refresh scheduled for Q3 2026. As market conditions shift across major metros, individual city scores can move meaningfully between updates — particularly for Caribbean / Latin Restaurants, where local competition density and consumer spending patterns respond quickly to new entrants and neighborhood change. For the most current score at any specific address, use StreetSpring's live survivability tool rather than the static ranking above.
What about cities outside the top 10 — can Caribbean / Latin Restaurants thrive there?
Yes — our top 10 ranking reflects cities with the strongest average conditions, but lower-ranked metros can still contain exceptional individual neighborhoods. Many operators successfully open Caribbean / Latin Restaurants in cities that don't appear in our top 10. Caribbean / Latin Restaurants in particular can find strong performance in secondary markets where the right demographic concentration, household income, and limited direct competition within walking distance align — even outside our highest-ranked cities. StreetSpring's neighborhood-level data surfaces these pockets of opportunity in every city we analyze, regardless of where the city as a whole ranks nationally.
How can I narrow down cities for a Caribbean / Latin Restaurant?
StreetSpring's Survivability Score tool provides address-level predictions for Caribbean / Latin Restaurants across all 24 metros we track. For this category specifically, the tool surfaces competition density, consumer spending index for Caribbean / Latin Restaurants, and commercial vacancy rates — the factors that most consistently predict whether a Caribbean / Latin Restaurant will still be operating after two years. You can check any specific address before signing a lease and compare multiple neighborhoods side by side to identify the highest-survivability site within your target city.
Try the Survivability Score tool →
Where in the US do Caribbean / Latin Restaurants survive best?
San Antonio ranks as the #1 city in the US for Caribbean / Latin Restaurants survivability in StreetSpring's 2026 analysis, with an average score of 87%. This means that across well-selected neighborhoods in San Antonio, a Caribbean / Latin Restaurant has approximately a 87% chance of still operating after two years — above the national average for this category. Portland ranks second, followed by St Louis. The full ranking reflects data across 24 major US metro areas — see the complete list above for all scores and neighborhood-level links.
Last reviewed: May 4, 2026 by Bobby Koons, Founder & CEO, StreetSpring
Technical note: Aggregated national survivability rankings across all 24 metros are available in machine-readable format for research and integration purposes.
StreetSpring recalculates survivability using the latest competitive, demographic, and walkability data, so the live score may differ from the static ranges shown here.
Methodology: City rankings aggregate neighborhood-level Survivability Scores (max, average, and min) across all analyzed neighborhoods in each metro area. Rankings reflect average conditions but do not account for variation within cities. Coverage includes 24 major US metropolitan areas: San Antonio, Portland, St Louis, Charlotte, Orlando, Phoenix, Baltimore, Tampa Bay, Atlanta, Detroit, Los Angeles, Miami, San Francisco, San Diego, Houston, Washington DC, Minneapolis, Dallas, Denver, Seattle, Chicago, Boston, Philadelphia, New York City.