Survivability Rankings for Bar in Boston
StreetSpring's 2026 analysis ranks the best and worst neighborhoods in Boston to open a Bar, from Boston (87% survival) to Winchester (74%).
By Bobby Koons | Last updated: May 7, 2026 | Weekly methodology review | Methodology
Quick Summary
- #1 Neighborhood: Boston — 87% average survivability for Bar
- Neighborhoods at or above 70%: 88 of 88 analyzed
- City-wide average: 81% for Bars
- Most challenging area: Winchester at 74%
- Revenue advantage (top vs. avg location): ~7.8% more expected revenue in Boston
- Data freshness: 2026 data · Full methodology →
Table of Contents
- Summary
- 10 Best Neighborhoods
- Where Would a Bar Make the Most Money?
- What Should I Consider?
- Where Should I Start?
- FAQ: Best Neighborhoods
- FAQ: Can a Bar Succeed in Lower-Ranked Areas?
- FAQ: How Often Are Rankings Updated?
- FAQ: Is a Bar a Good Tenant?
- Landlord Survivability Data
- Best Neighborhoods for Any Business
Summary
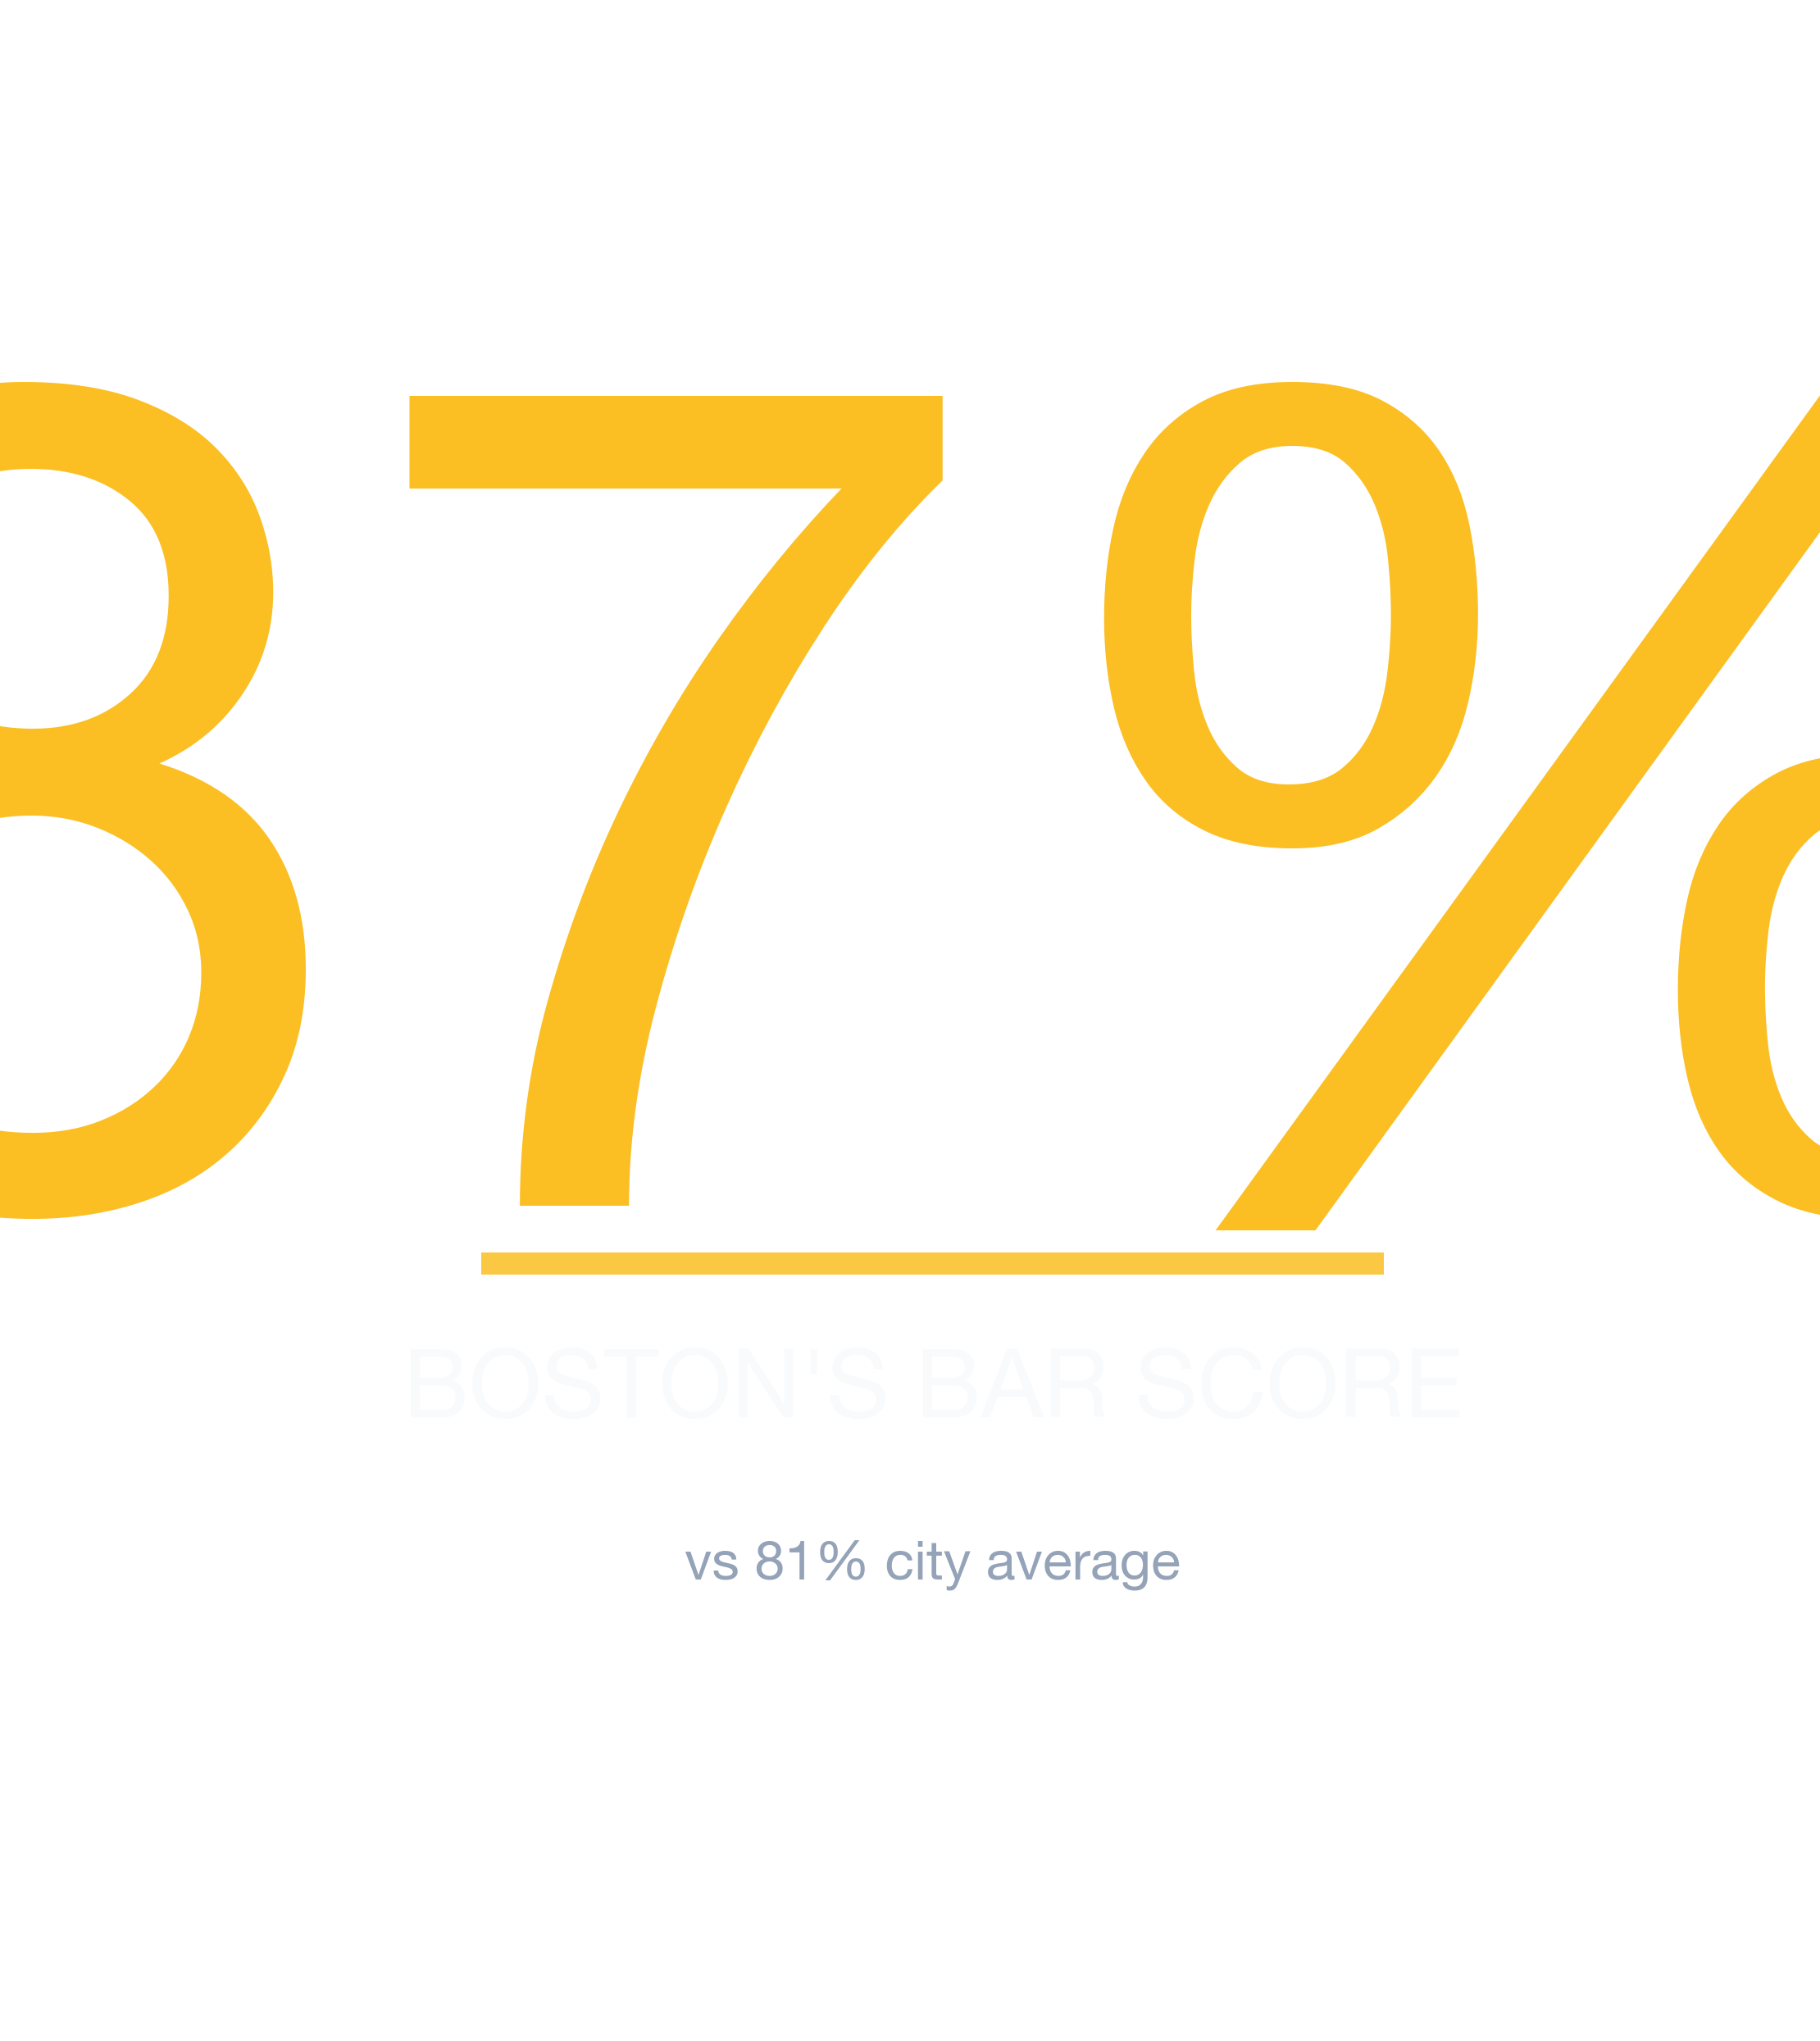
Of all the neighborhoods in and around Boston, Boston ranks #1 for opening a Bar with 87% average chance of surviving more than 2 years, with the best locations offering 92% and the most challenging locations in Boston at 75%. The worst neighborhoods include Winchester with 74% average chance. These rankings are based on the latest available data; check StreetSpring for real-time updates.
Where in Boston Should You Open a Bar?
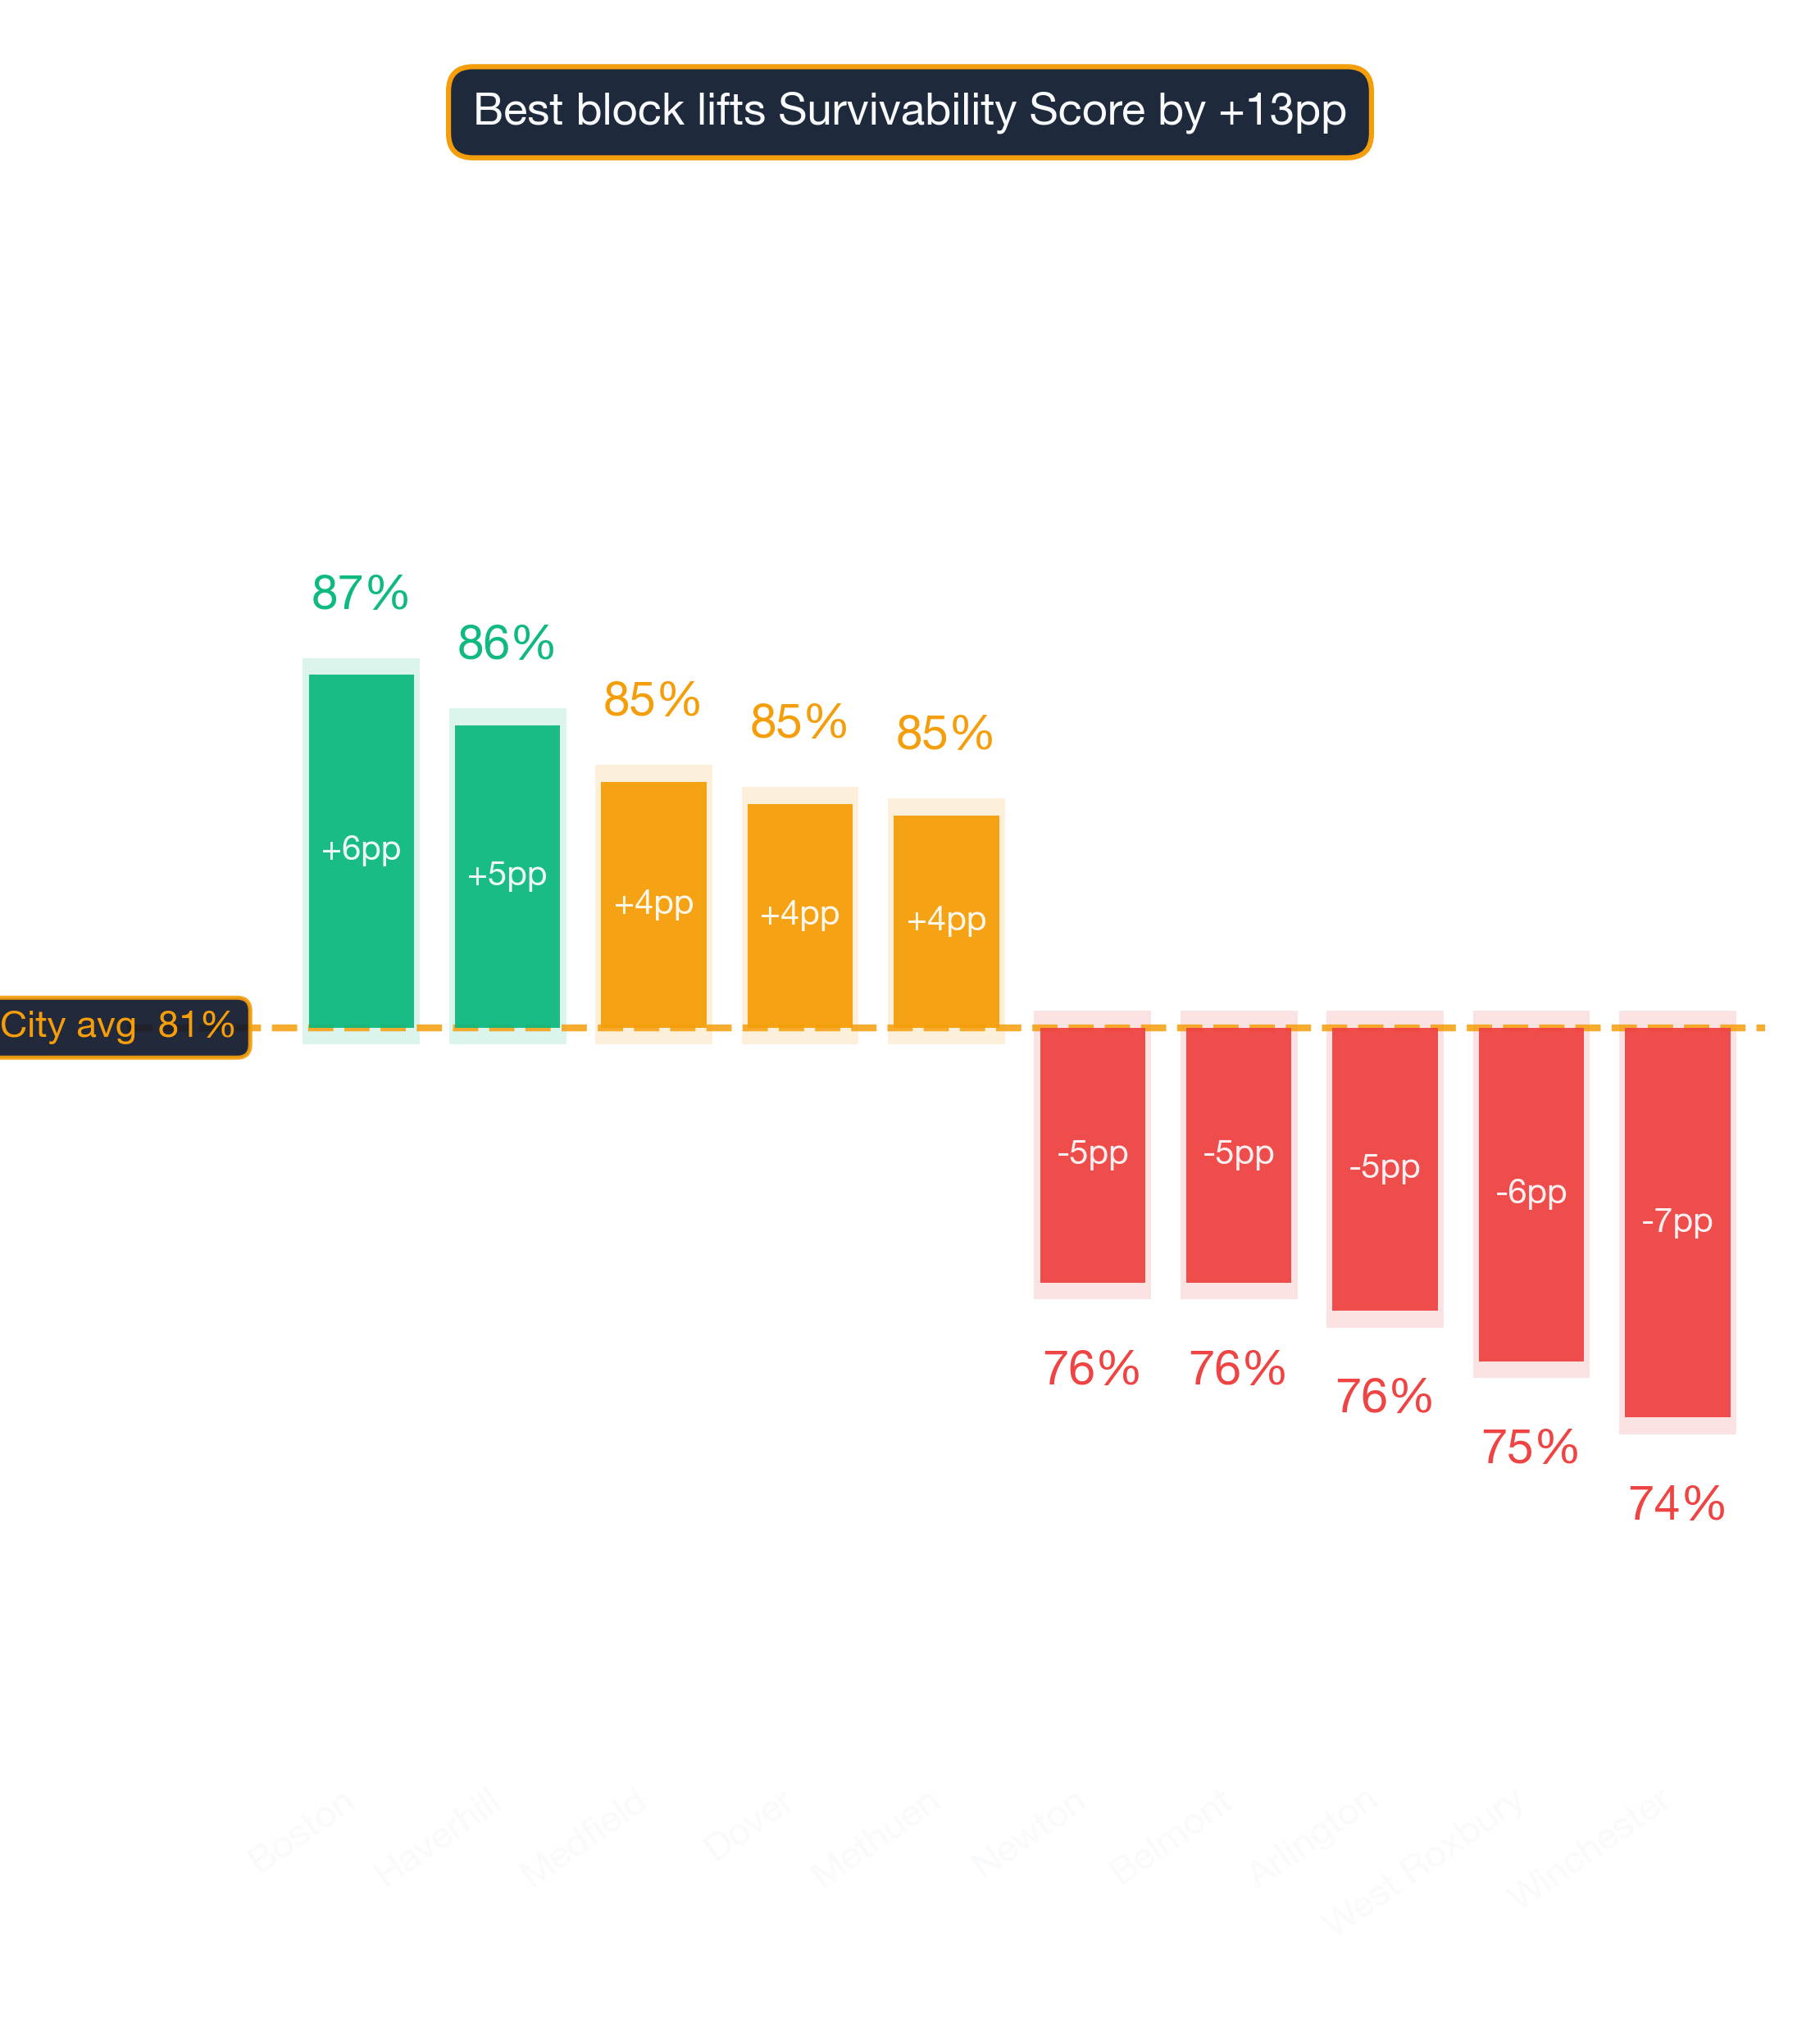
Boston ranks #1 of 88 neighborhoods analyzed in and around Boston for Bar survivability with a score of 87% as of 2026. The top 10 neighborhoods are:
What separates the top neighborhoods from the rest
| Rank | Neighborhood | Best Locations | Average Locations | Challenging Locations |
|---|---|---|---|---|
| 1 | Boston | 89.0% – 93.0% | 84.8% – 89.2% | 74.0% – 78.0% |
| 2 | Haverhill | 93.0% – 97.0% | 83.9% – 88.3% | 64.0% – 68.0% |
| 3 | Medfield | 94.0% – 97.0% | 82.9% – 87.2% | 60.0% – 64.0% |
| 4 | Dover | 93.0% – 97.0% | 82.5% – 86.8% | 65.0% – 69.0% |
| 5 | Methuen | 94.0% – 97.0% | 82.3% – 86.6% | 65.0% – 69.0% |
| 6 | Merrymount | 90.0% – 94.0% | 81.9% – 86.3% | 71.0% – 75.0% |
| 7 | Riverside | 85.0% – 89.0% | 81.8% – 86.1% | 78.0% – 82.0% |
| 8 | Needham | 94.0% – 97.0% | 81.4% – 85.7% | 64.0% – 68.0% |
| 9 | Adams Shore | 90.0% – 94.0% | 81.1% – 85.4% | 69.0% – 73.0% |
| 10 | Lowell | 93.0% – 97.0% | 80.9% – 85.2% | 65.0% – 69.0% |
Why these rankings reflect real survival outcomes
These rankings are based on the latest available data; check StreetSpring for real-time updates. For the most accurate predictions, always check your specific address in StreetSpring's live platform.
Survivability ranges reflect best and worst storefront conditions within each neighborhood. See our full methodology →
Try StreetSpring to see if this location is still the best and see if there are locations to rent in this area right now.
Boston's Best-Earning Neighborhoods for Bars
In Boston, the best possible location offers the opportunity of making ~7.8% more than the average location in or around Boston.
On the other hand, in Winchester, the worst possible location could result in making ~8.6% less than the average location in the city.
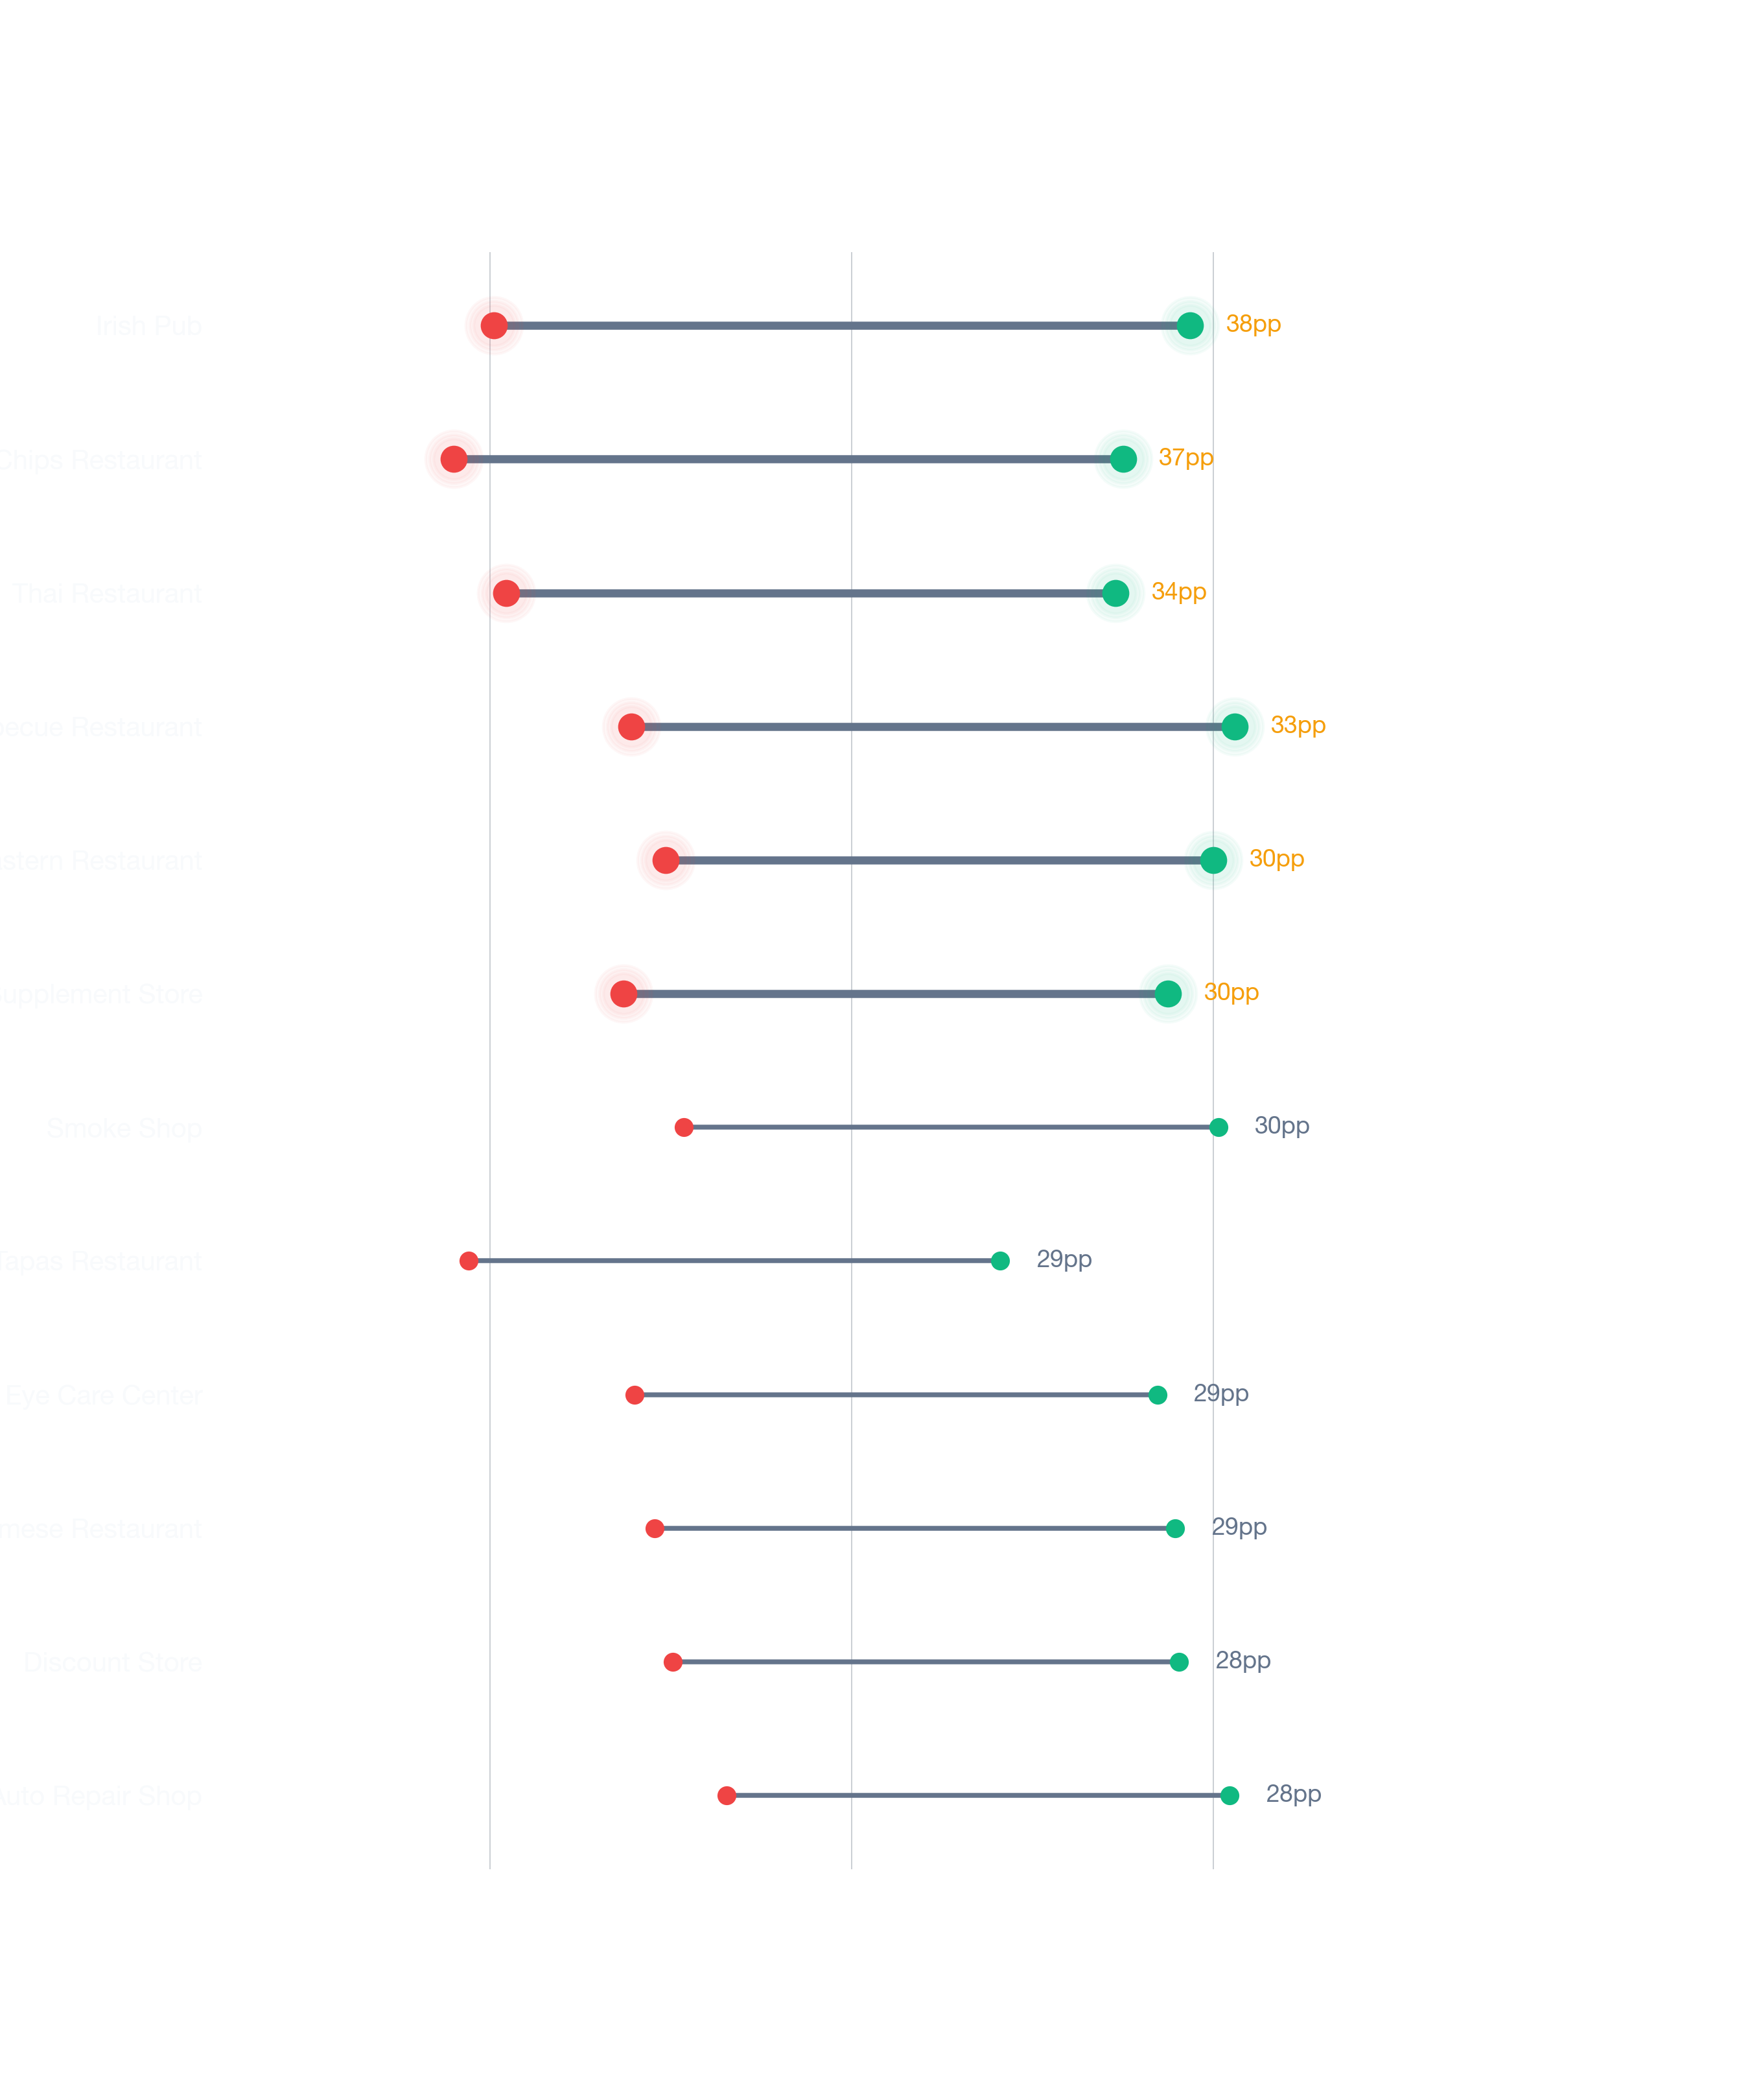
The difference between success and failure often comes down to where you sign the lease. Opening a Bar in Boston requires careful location choice. Across 88 neighborhoods analyzed, the overall average survival chance for a new Bar is 81% for lasting more than 2 years — due to a combination of many factors across competition, consumer spending, and location dynamics. Two businesses on the same block can have very different survivability scores depending on their category.
What to Think About When Launching a Bar in Boston
There is no operational fix for a poorly chosen location. Use Survivability Score as a hard filter on candidate addresses before evaluating other factors. A high Revenue Capture Score is the clearest signal that a location can sustain a profitable business. StreetSpring computes this by projecting the business's market share, which is based on the quality and quantity of primary, secondary, and tertiary competitors. StreetSpring's training dataset includes millions of transactions and business lifecycle events. Strategic clustering can actually boost performance by creating destination zones. These forecasts are generated using StreetSpring's unique analytical framework.
| Consideration | Common pitfall | What to verify before signing |
|---|---|---|
| Permits & licensing | Assuming a 30-day permit timeline, hitting 90+ days, paying rent on a non-operating storefront. | Call the local zoning office before signing. Confirm your use is already permitted; if not, factor a 2-3 month variance timeline. |
| Workforce availability | Hiring radius is smaller than you think — many neighborhoods can't staff a full team at standard wages. | Pull BLS wage data for your industry in this metro. Walk through your staffing plan with a local restaurant/retail operator before signing. |
| Lease term | Locking into 7-10 years without break clauses, then needing to relocate after year 2. | Negotiate a relocation or termination clause. Confirm assignment + sublease rights are in writing. |
This can be summarized as:
Revenue Capture Score = Projected Market Share × Forecasted Spend on Specific Business
Related: Survivability Score: How We Calculate It & Why It Matters
StreetSpring recalculates survivability using the latest competitive, demographic, and walkability data. New competitor openings and closures happen weekly — the live tool ensures you see the latest picture.
The Best Place to Start a Bar in Boston
StreetSpring identifies the strongest markets as Boston, Haverhill, and Medfield, while the most challenging neighborhoods would be Winchester, West Roxbury, and Arlington. A low-ranking neighborhood can still contain high-potential storefronts — the address matters most. Because local conditions evolve weekly, the live survivability tool offers a more current snapshot than any published ranking.
Related Articles:
- Business Survivability Rankings: Boston
- Neighborhood Survivability Rankings: Boston
- National City Survivability: Bar
Which Boston Neighborhoods Are Strongest for Bars?
Based on StreetSpring's 2026 analysis, the top neighborhood for a Bar in Boston is Boston with 87% average survivability, followed by Haverhill and Medfield. 88 of 88 neighborhoods analyzed exceed 70% two-year survival.
The live platform incorporates the most recent foot traffic, competitor, and spending data for your exact address.
When Lower-Scoring Neighborhoods Can Still Work for Bars
Yes — neighborhood averages mask significant block-by-block variation. Even in neighborhoods ranked outside the top 10, individual storefronts with strong foot traffic, low direct competition, and favorable lease terms can outperform the area average. These averages are directional, not definitive; the best decision comes from analyzing your specific storefront. Always check your specific address in StreetSpring's live platform for the most accurate prediction.
How Fresh Is Our Boston Bar Ranking Data?
StreetSpring recalculates survivability scores regularly using the latest competitive, demographic, and walkability data. Rankings are updated quarterly; the live tool always reflects the most current predictions for any address in Boston.
Should You Rent Your Boston Storefront to a Bar?
In Boston, StreetSpring forecasts a 84.8% – 89.2% average chance for a new Bar to survive more than 2 years, depending on the exact storefront. Check the current Survivability Score for any address instantly.
Landlord Survivability Data for Bar in Boston
Landlords in Boston's top three neighborhoods for Bar can expect the following average survivability for new tenants:
- Boston: 84.8% – 89.2%
- Haverhill: 83.9% – 88.3%
- Medfield: 82.9% – 87.2%
See which business types are most likely to succeed at your property address right now.
With StreetSpring, you can see the precise probability of success for countless business models at any exact location.
Related: How Landlord Representatives Can Reduce Vacancy & Increase Tenant Longevity
Top-Survivability Boston Neighborhoods for Bars
You can see the best neighborhoods in or around Boston to open any type of business in our article Neighborhood Survivability Rankings: Boston.
Technical note: Aggregated survivability rankings for Boston are available in machine-readable format for research and integration purposes.
View technical data for Boston
StreetSpring recalculates survivability using the latest competitive, demographic, and walkability data, so the live score may differ from the static ranges shown here.
Visual Data
Related Resources
Same business type in other cities:
- City Survivability Rankings for Bar
- Survivability Rankings for Bar in Atlanta
- National Neighborhood Survivability Rankings for Bar
Related:
More Questions About This Location
Local-context questions, answered with neighborhood-specific numbers.
What are the key demographic factors for Bars in Boston?
Boston's key demographics — ~$135K median household income, 41 median age — feed into the survivability model alongside competition, rent, and accessibility data. The model averages Bars at 80% across Boston.
What are the top metros nationally for opening a Bar?
Per StreetSpring's 24-metro model, the top three US cities for Bars survivability are Tampa Bay, Portland, Phoenix. Boston ranks #18, averaging 80%.
How many Boston neighborhoods has StreetSpring scored for Bars?
StreetSpring's Boston model covers Bars across all tracked neighborhoods — the average score is 80%, with neighborhood-level scores spanning 47-96%. Real-time scores at the address level capture finer variation than these neighborhood averages.