National Neighborhood Survivability Rankings for Bar
StreetSpring's 2026 nationwide analysis ranks the top neighborhoods across all major US cities for Bars. See which neighborhoods offer the highest Survivability Scores.
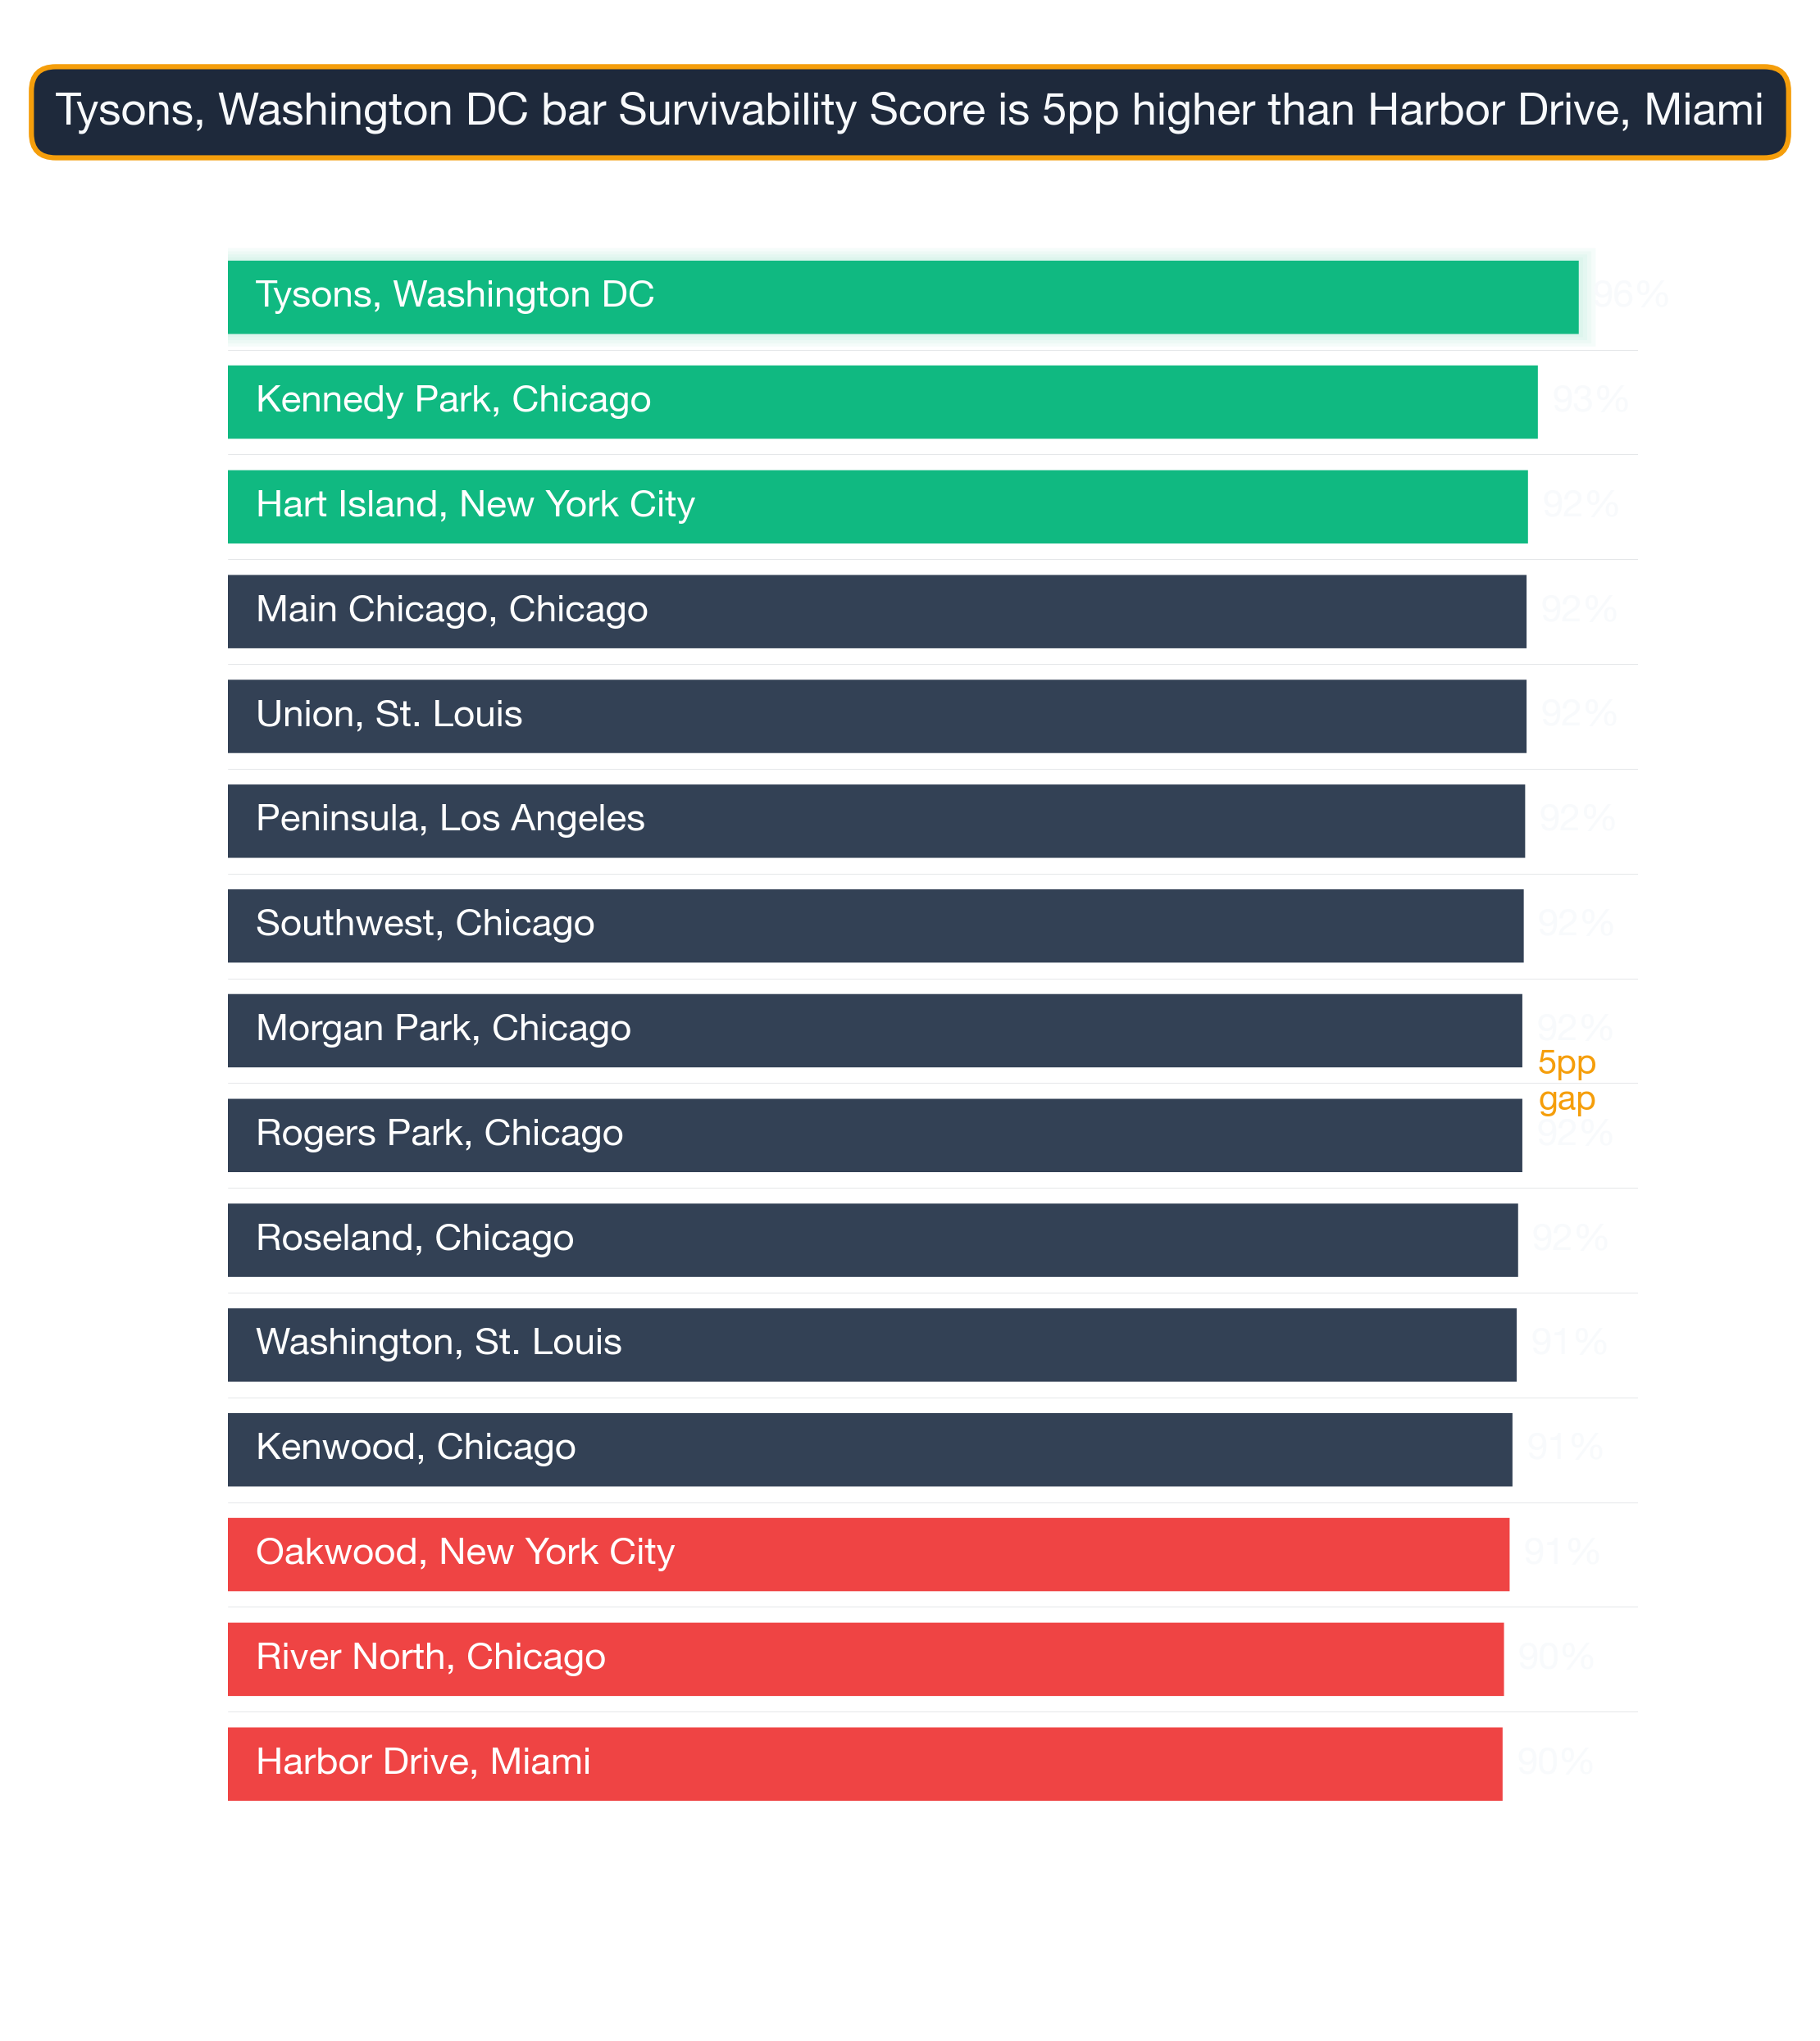
Our 2026 analysis of neighborhoods across 24 US metros shows Tysons in Washington DC as the top location to open a Bar — 96% survivability puts it ahead of every other neighborhood in the country. The top 25 neighborhoods nationwide span 5 different cities, demonstrating that exceptional opportunities for Bars exist across diverse markets. Because new competitors open and close each week, the exact survivability score for any specific address is always best verified in StreetSpring's live platform.
To understand the methodology behind these rankings, see our detailed guide: Survivability Score: How We Calculate It & Why It Matters.
Last reviewed: May 4, 2026 by Bobby Koons, Founder & CEO, StreetSpring
Quick Summary
- #1 Neighborhood: Tysons, Washington DC — 96% survivability for Bar
- Neighborhoods analyzed: 1426 across 24 major US cities
- National average survivability: 80.5% for Bars
- Top-25 average: 91.0% — 10.5% above national average
- Data current as of: 2026 · Full methodology →
Table of Contents
- How neighborhoods compare nationwide
- Top 25 neighborhoods in the US
- Geographic patterns
- How to use this ranking
- Related resources
- Frequently asked questions
Cross-Country Neighborhood Comparison for Bars
Analyzing 1426 neighborhoods across 24 major US cities, StreetSpring's 2026 data shows that the best neighborhoods for Bars significantly outperform average locations, with the top 25 neighborhoods nationwide averaging 91.0% survivability compared to the national neighborhood average of 80.5%.
Why some metros dominate this business's leaderboard
This 10.5% advantage illustrates how critical neighborhood selection is — choosing a top-tier neighborhood versus an average one can significantly increase your long-term survival chances.
How median scores differ city to city
Bars tend to show significant geographic clustering — markets where one successful operator exists often attract additional demand, raising survivability for new entrants who choose complementary (rather than directly competing) locations. The concentration of top neighborhoods in Chicago, St. Louis, Washington DC reflects this pattern. StreetSpring's model accounts for the distinction between complementary clustering and direct saturation when scoring Bars survivability at the address level.
Importantly, top-performing neighborhoods aren't concentrated in just a few cities. The top 25 neighborhoods represent 5 different cities. This means entrepreneurs focused on Bars can find exceptional opportunities across the United States, not just in traditionally strong markets.
Site selection is the highest-leverage decision most entrepreneurs make — it sets every other variable in motion.
What are the best neighborhoods in the United States to open a Bar?
| Signal | Top-quartile neighborhood pattern | Bottom-quartile neighborhood pattern |
|---|---|---|
| Daytime population concentration | Mixed-use neighborhoods with strong daytime employment density (LEHD LODES > 8K jobs/sq mi). | Pure-residential neighborhoods where daytime population drops below 30% of resident count. |
| Walk Score + foot-traffic alignment | Neighborhoods where Walk Score (90+) matches actual measured pedestrian volume — not just street-grid promise. | High Walk Score scores driven by transit density but with sparse street-level retail engagement. |
| Median household income alignment | Neighborhoods where median household income fits the subtype's typical customer profile (income elasticity matches). | Neighborhoods where income is either too low for the price tier or too high for the value-perception band. |
How density of similar businesses lifts (or hurts) survival
Survivability range for top, middle, and last-ranked neighborhoods. Box = best-to-challenging range; white line = average. Tysons, Washington DC leads at 96% in 2026. Full methodology →
The top 25 neighborhoods nationwide for Bars are:
| # | Neighborhood | City | Avg Survival | Tier | Best Locations | Challenging Locations |
|---|---|---|---|---|---|---|
| 1 | Tysons | Washington DC | 95.8% | Great | 97.0% | 93.5% |
| 2 | Kennedy Park | Chicago | 92.9% | Great | 94.9% | 90.6% |
| 3 | Main-Chicago | Chicago | 92.1% | Great | 94.2% | 89.8% |
| 4 | Union | St. Louis | 92.1% | Great | 94.1% | 89.8% |
| 5 | Peninsula | Los Angeles | 92.0% | Great | 94.0% | 89.7% |
| 6 | Southwest | Chicago | 91.9% | Great | 94.0% | 89.6% |
| 7 | Rogers Park | Chicago | 91.8% | Great | 93.8% | 89.5% |
| 8 | Morgan Park | Chicago | 91.8% | Great | 93.8% | 89.4% |
| 9 | Roseland | Chicago | 91.5% | Great | 93.5% | 89.2% |
| 10 | Washington | St. Louis | 91.4% | Great | 93.5% | 89.1% |
| 11 | Kenwood | Chicago | 91.1% | Great | 93.2% | 88.8% |
| 12 | River North | Chicago | 90.5% | Great | 92.5% | 88.2% |
| 13 | Troy | St. Louis | 90.4% | Great | 92.5% | 88.1% |
| 14 | Harbor Drive | Miami | 90.4% | Great | 92.4% | 88.1% |
| 15 | Margate Park | Chicago | 90.4% | Great | 92.4% | 88.1% |
| 16 | West Village | Chicago | 90.3% | Great | 92.4% | 88.0% |
| 17 | West Town | Chicago | 90.2% | Great | 92.3% | 87.9% |
| 18 | Noble Square | Chicago | 90.0% | Great | 92.1% | 87.7% |
| 19 | Wildwood | Chicago | 90.0% | Great | 92.0% | 87.7% |
| 20 | Mayfair | Chicago | 89.7% | Great | 91.7% | 87.4% |
| 21 | Andersonville | Chicago | 89.7% | Great | 91.7% | 87.4% |
| 22 | The Villa | Chicago | 89.7% | Great | 91.7% | 87.4% |
| 23 | Edgewater | Chicago | 89.6% | Great | 91.7% | 87.3% |
| 24 | Budlong Woods | Chicago | 89.6% | Great | 91.7% | 87.3% |
| 25 | Near North | Chicago | 89.6% | Great | 91.7% | 87.3% |
Survivability rankings at the neighborhood level describe typical conditions — any specific storefront may score higher or lower depending on its exact competitive environment.
For a full explanation of how survivability scores and ranges are calculated, see Survivability Score: How We Calculate It & Why It Matters.
What patterns emerge from the top-performing neighborhoods nationwide?
City Concentration
The top 25 neighborhoods span 5 different cities, with Chicago claiming 19 of the top spots (76%).
Breakdown of top 25 neighborhoods by city:
- Chicago: 19 neighborhoods (76% of top 25) — View city guide
- St. Louis: 3 neighborhoods (12% of top 25) — View city guide
- Washington DC: 1 neighborhood (4% of top 25) — View city guide
- Los Angeles: 1 neighborhood (4% of top 25) — View city guide
- Miami: 1 neighborhood (4% of top 25) — View city guide
This distribution has practical implications for Bars operators: cities with multiple neighborhoods in the top 25 offer more site options within a single market, reducing relocation or expansion cost. Cities with a single top-25 neighborhood require more precise site selection — the advantage is concentrated in one area rather than spread across the metro.
The role of anchor businesses at the city block level
The concentration of 19 top-ranked neighborhoods in Chicago (76% of the top 25) is notably high for this business category, suggesting that Chicago's market conditions — competitive density, consumer spending patterns, and demographic alignment — are unusually favorable for Bars. Operators targeting this category should treat Chicago neighborhoods as a primary focus before expanding to secondary markets.
Using neighborhood survivability to pick Bars sites
While nationwide neighborhood rankings identify standout markets, address-level analysis reveals even greater variation. Our analysis draws on one of the largest proprietary commercial real estate datasets available, spanning 24 US metros and 130+ business categories. Even within top-ranked neighborhoods, specific block selection can vary survivability by 10–20 percentage points.
For the most accurate assessment:
- Consider neighborhoods in the top 25 as strong starting points
- Examine city-specific guides for additional neighborhood options in your target markets
- Use StreetSpring's address-level tool to evaluate specific storefronts within these neighborhoods
- Factor in your budget, operational requirements, and target demographics
Each neighborhood has detailed analysis available through its city guide, providing block-by-block survivability data for Bars.
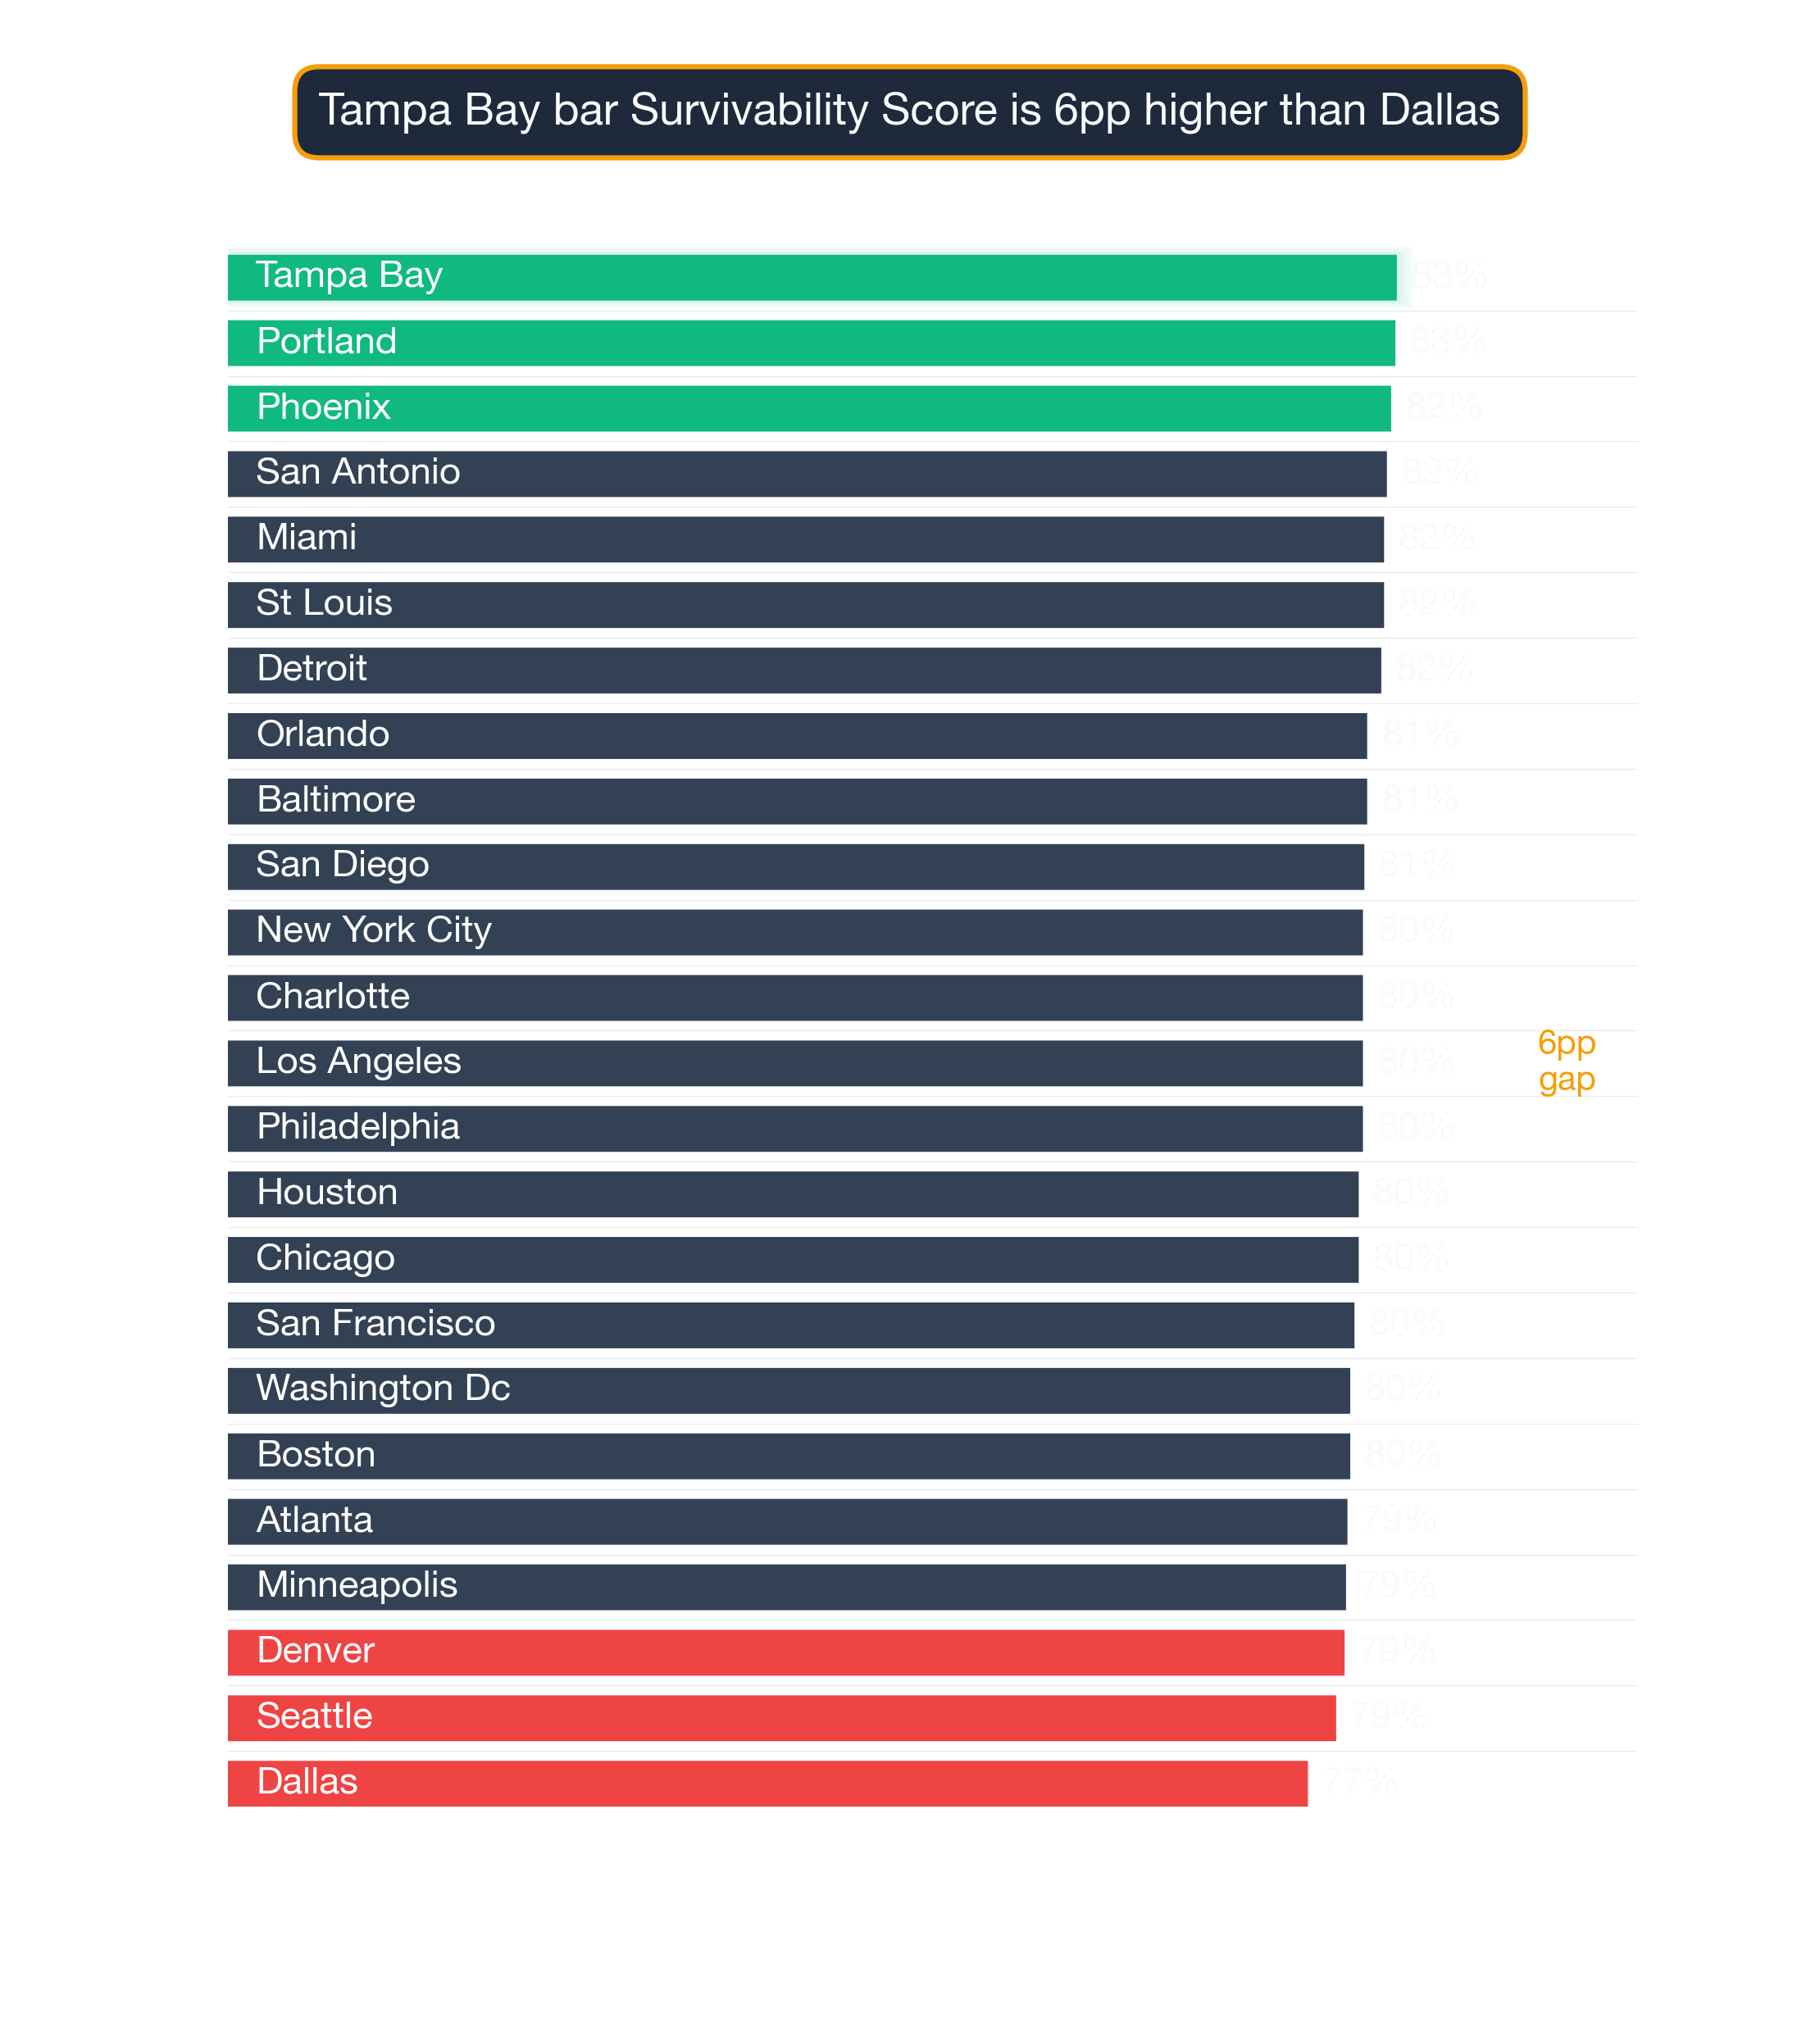
See also: Best Cities for Bar — our city-level comparison ranks which metros offer the strongest overall conditions for Bars.
Synergy Patterns: Subtypes That Cluster Together
If you're evaluating a Bar location, the same neighborhoods that score well for Bars often score well for adjacent businesses. A few examples across the national distribution:
Tysons, Washington DC — ranked #1 nationally — the strongest neighborhood for Bars (96% survivability for Bar) Other business types that thrive in Tysons:
- Georgian Restaurant (96% survivability)
- Veterinary Clinic (96% survivability)
- Portuguese Restaurant (96% survivability)
Great-Lakes, Atlanta — ranked #1426 of 1426 — among the lower-ranked national neighborhoods (69% survivability for Bar) Other business types that thrive in Great-Lakes:
- Kosher Restaurant (82% survivability)
- Juice & Smoothie Bar (82% survivability)
- Tattoo & Piercing Shop (80% survivability)
Check the cross-subtype list before signing. If a neighborhood is great for Bars but nothing else, treat that as data; if several subtypes score well together, the neighborhood-level signal is robust.
Visual Data
Related Resources
Explore top cities represented in these neighborhoods:
- St. Louis: Best businesses and neighborhoods
- Chicago: Best businesses and neighborhoods
- Miami: Best businesses and neighborhoods
- Washington DC: Best businesses and neighborhoods
- Los Angeles: Best businesses and neighborhoods
National city rankings: Best cities for Bars
Essential resources:
- How StreetSpring calculates Survivability Scores
- Site selection for landlords
- AI tools for tenant representatives
- StreetSpring vs competitors
Frequently Asked Questions
Are there good opportunities outside the top 25 neighborhoods?
Absolutely. Our analysis covers 1426 neighborhoods across 24 cities. Many neighborhoods outside the top 25 have excellent individual locations for Bars. Neighborhood-level rankings reflect averages — specific addresses within any neighborhood can score well above or below the neighborhood mean. Use city-specific guides and StreetSpring's address-level tool to explore options beyond the top 25.
How do I interpret a survivability score?
A survivability score represents the estimated probability that a business of a specific type will still be operating at a given location after 2 years. A score of 80% means StreetSpring's model predicts an 80% chance of the business surviving past the 2-year mark at that address. Scores are calculated at the address level and reflect competitive density, consumer spending patterns, mobility data, and 80+ additional factors.
What makes Tysons in Washington DC the best neighborhood for Bars?
Tysons in Washington DC ranks #1 for Bars with 96% survivability. This reflects favorable competitive dynamics — fewer direct competitors relative to available consumer spending — strong demographic alignment with Bar customers, and local spending patterns that sustain this business category. StreetSpring's model weights these factors across all analyzed neighborhoods nationwide.
Where can I download the underlying data?
The full national survivability dataset is available as a free download: https://streetspring.com/resources/data/national-survivability-scores-2026.csv. The CSV includes all business subtypes and neighborhoods covered in this analysis, licensed under CC BY 4.0.
Which cities appear most frequently in the top 25 neighborhoods for Bars?
The cities most represented in the top 25 for Bars are Chicago (19), St. Louis (3), Washington DC (1). This concentration reflects the relative strength of consumer demand and competitive conditions for Bars in these markets. City-specific guides provide deeper analysis of each city's neighborhoods.
Can a Bar succeed in neighborhoods outside the top 25?
Yes — the top 25 neighborhoods represent standout conditions, but Bars can achieve strong survivability in many other neighborhoods as well. What matters is finding a location where competitive density is low enough and consumer spending is strong enough to support the business. StreetSpring's address-level tool identifies high-survivability addresses in any neighborhood, including those not represented in this top-25 list.
How does the national ranking for Bars compare to city-level rankings?
The national neighborhood ranking for Bars identifies the strongest neighborhoods across all 24 analyzed metros. City-level rankings provide a more granular view of the best neighborhoods within a specific city. In cases where a city has multiple neighborhoods in the national top 25, the city-level guide shows the full ranking of all neighborhoods in that market — including those outside the national top 25 that may still offer strong site-specific opportunities.
What demographic factors drive survivability for Bars?
For Bars, StreetSpring's model incorporates neighborhood-level demographic data including population density, median household income, employment rates, and consumer spending on this specific category. These factors vary by business type — the demographic profile that drives survivability for Bar customers may differ significantly from what matters for other business categories.
Technical note: Aggregated national survivability rankings across all 24 metros are available in machine-readable format for research and integration purposes.
StreetSpring recalculates survivability using the latest competitive, demographic, and walkability data, so the live score may differ from the static ranges shown here.
Methodology: Neighborhood rankings are based on average Survivability Scores for Bars across all analyzed locations within each neighborhood. Rankings represent neighborhood-level conditions but do not account for block-by-block variation. Coverage includes 1426 neighborhoods across 24 major US cities.