Survivability Rankings for Italian Restaurant in Baltimore
StreetSpring's 2026 analysis ranks the best and worst neighborhoods in Baltimore to open an Italian Restaurant, from Woodring (88% survival) to Old Town...
By Bobby Koons | Reviewed: May 11, 2026 | Refreshed weekly | Methodology
Quick Summary
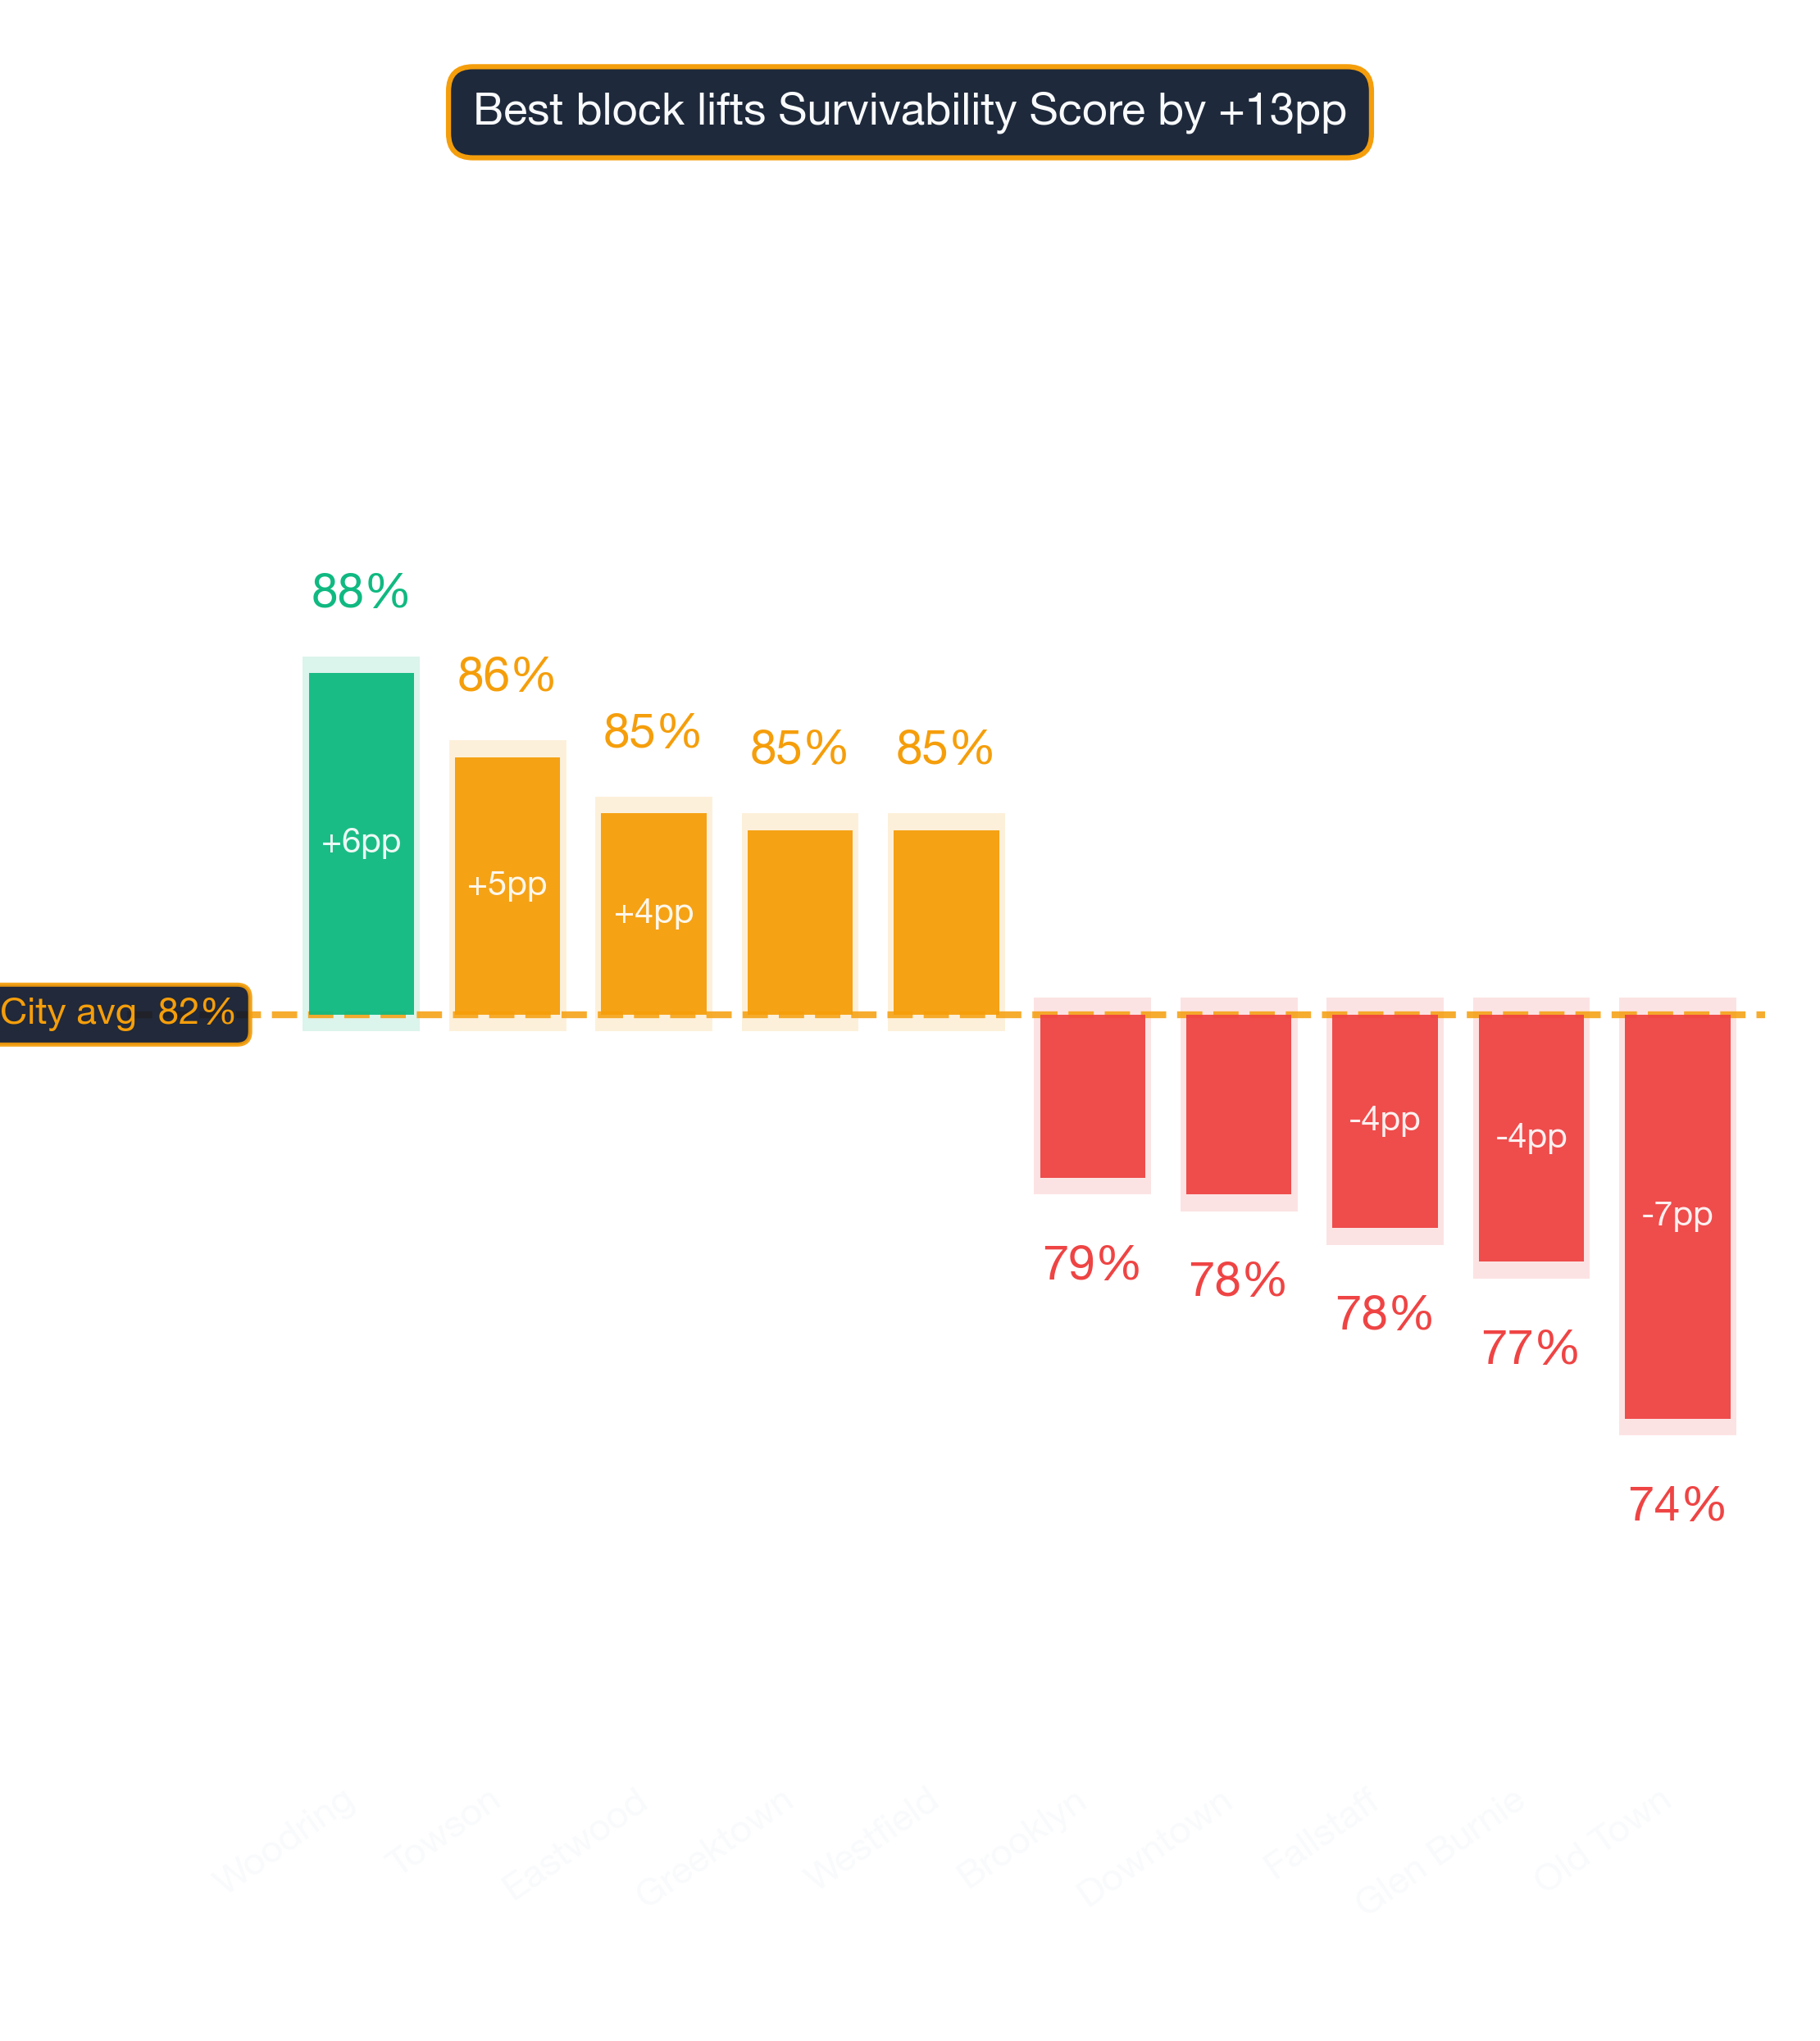
- #1 Neighborhood: Woodring — 88% average survivability for Italian Restaurant
- Neighborhoods at or above 70%: 23 of 23 analyzed
- City-wide average: 82% for Italian Restaurants
- Most challenging area: Old Town at 74%
- Revenue advantage (top vs. avg location): ~7.4% more expected revenue in Woodring
- Data freshness: 2026 data · Full methodology →
Table of Contents
- Summary
- 10 Best Neighborhoods
- Where Would an Italian Restaurant Make the Most Money?
- What Should I Consider?
- Where Should I Start?
- FAQ: Best Neighborhoods
- FAQ: Can an Italian Restaurant Succeed in Lower-Ranked Areas?
- FAQ: How Often Are Rankings Updated?
- FAQ: Is an Italian Restaurant a Good Tenant?
- Landlord Survivability Data
- Best Neighborhoods for Any Business
Summary
Woodring leads Baltimore's 2026 survivability rankings for Italian Restaurant operators with 88% average chance of surviving more than 2 years, with the best locations offering 90% and the most challenging locations in Woodring at 84%. The worst neighborhoods include Old Town with 74% average chance. These rankings are based on the latest available data; check StreetSpring for real-time updates.
Where Italian Restaurants Thrive in Baltimore
Woodring ranks #1 of 23 neighborhoods analyzed in and around Baltimore for Italian Restaurant survivability with a score of 88% as of 2026. The top 10 neighborhoods are:
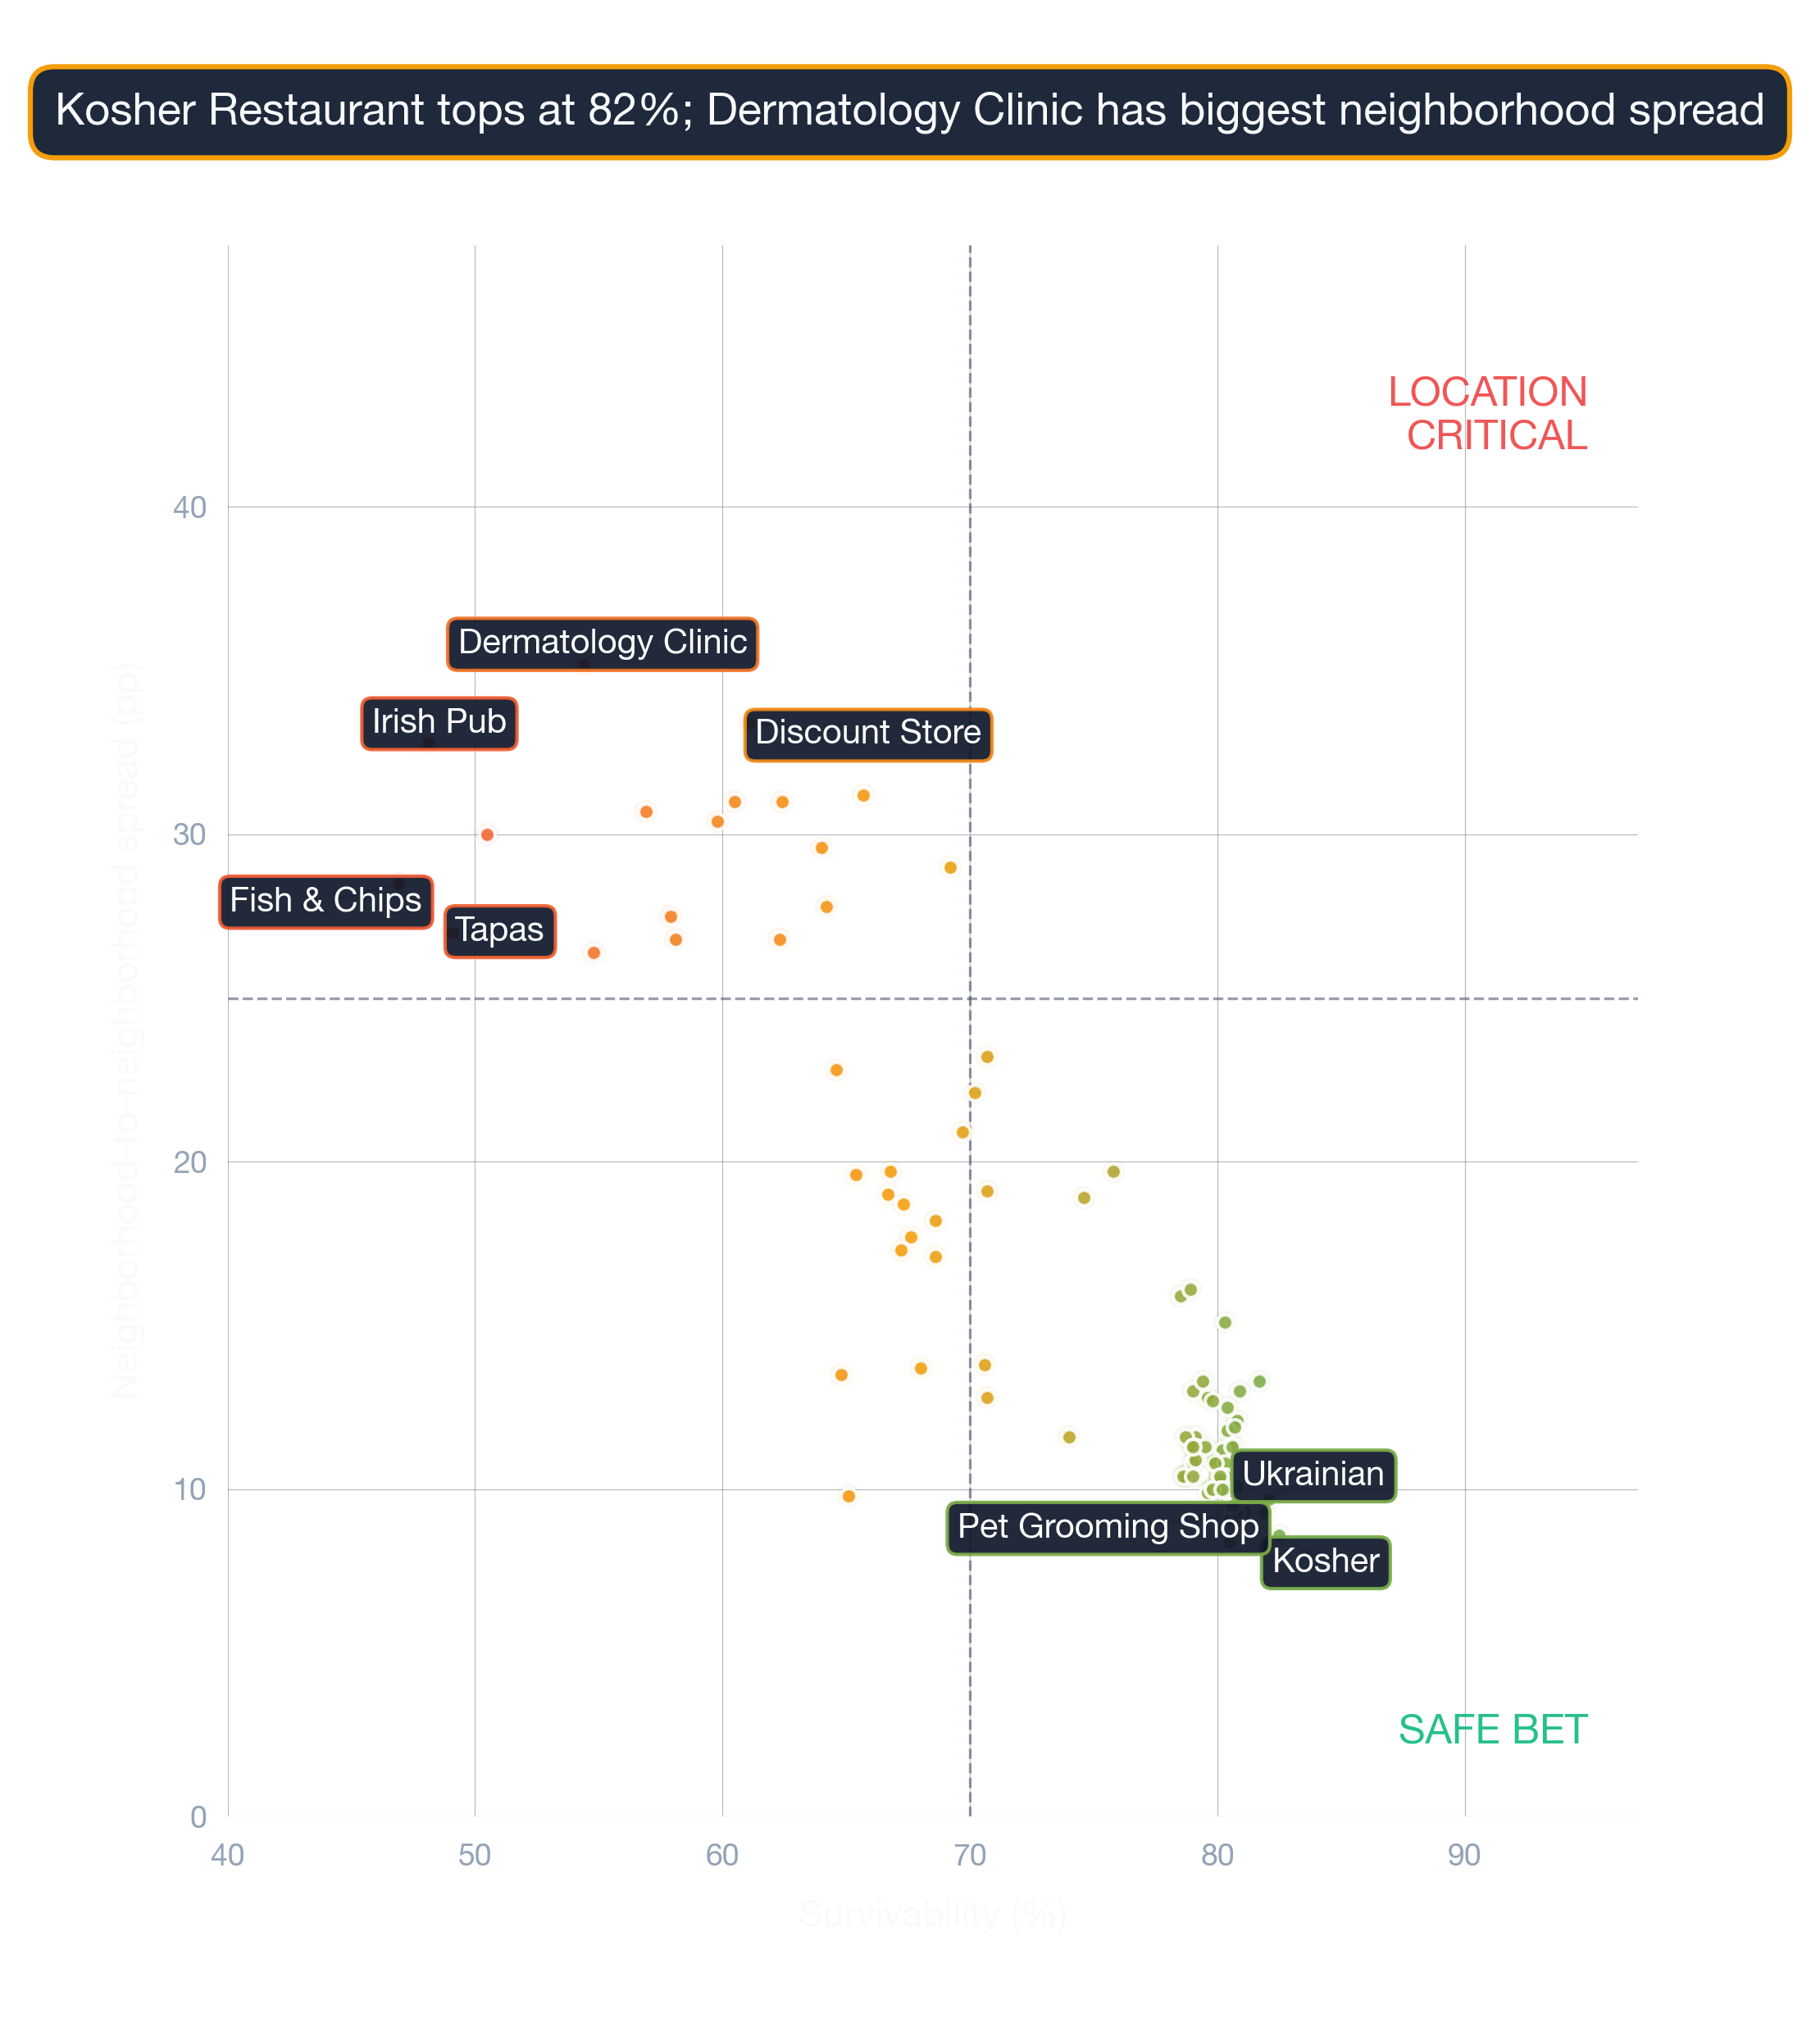
What the score spread tells you about risk
| Rank | Neighborhood | Best Locations | Average Locations | Challenging Locations |
|---|---|---|---|---|
| 1 | Woodring | 87.0% – 91.0% | 86.5% – 89.2% | 83.0% – 87.0% |
| 2 | Towson | 94.0% – 97.0% | 85.0% – 87.7% | 72.0% – 76.0% |
| 3 | Eastwood | 91.0% – 95.0% | 84.1% – 86.8% | 74.0% – 78.0% |
| 4 | Greektown | 88.0% – 92.0% | 83.7% – 86.4% | 77.0% – 81.0% |
| 5 | Westfield | 87.0% – 91.0% | 83.7% – 86.4% | 70.0% – 74.0% |
| 6 | Medford | 84.0% – 88.0% | 83.4% – 86.1% | 80.0% – 84.0% |
| 7 | Kresson | 86.0% – 90.0% | 82.6% – 85.3% | 75.0% – 79.0% |
| 8 | Cedonia | 87.0% – 91.0% | 82.1% – 84.8% | 74.0% – 78.0% |
| 9 | Canton | 83.0% – 87.0% | 81.9% – 84.7% | 76.0% – 80.0% |
| 10 | Beechfield | 88.0% – 92.0% | 81.5% – 84.2% | 74.0% – 78.0% |
How rent and competition shape the leaderboard
Remember that a neighborhood average smooths over wide variation — your exact block could significantly outperform. For the most accurate predictions, always check your specific address in StreetSpring's live platform.
Survivability ranges reflect best and worst storefront conditions within each neighborhood. See our full methodology →
Try StreetSpring to see if this location is still the best and see if there are locations to rent in this area right now.
Baltimore's Best-Earning Neighborhoods for Italian Restaurants
In Woodring, the best possible location offers the opportunity of making ~7.4% more than the average location in or around Baltimore.
On the other hand, in Old Town, the worst possible location could result in making ~8.8% less than the average location in the city.
The difference between success and failure often comes down to where you sign the lease. Opening an Italian Restaurant in Baltimore requires careful location choice. Across 23 neighborhoods analyzed, the overall average survival chance for a new Italian Restaurant is 82% for lasting more than 2 years — due to a combination of many factors across competition, consumer spending, and location dynamics. The interplay between location characteristics and business type produces unique survivability scores for every combination.
The Most Important Factors for an Italian Restaurant in Baltimore
Selecting a high-survivability address is the single most cost-effective risk reduction available before signing a lease. Everything downstream depends on it. Our models show that Revenue Capture Score explains more outcome variance than any other individual metric. StreetSpring computes this by projecting the business's market share, which is based on the quality and quantity of primary, secondary, and tertiary competitors. Our platform incorporates data from thousands of neighborhoods nationwide. Some competition is beneficial to attract customers with similar intents to the same area. StreetSpring's predictions leverage proprietary datasets covering competition, spending, and mobility.
| Factor | Where new owners get tripped up | Questions to ask before you sign |
|---|---|---|
| Permits & licensing | Assuming a 30-day permit timeline, hitting 90+ days, paying rent on a non-operating storefront. | Call the local zoning office before signing. Confirm your use is already permitted; if not, factor a 2-3 month variance timeline. |
| Foot traffic seasonality | Looking at a peak-summer Tuesday and assuming year-round volume. | Walk the block at 3 different times across 2 different weeks. Ask neighboring tenants for their slow-season % drop. |
| Lease term | Locking into 7-10 years without break clauses, then needing to relocate after year 2. | Negotiate a relocation or termination clause. Confirm assignment + sublease rights are in writing. |
This can be summarized as:
Revenue Capture Score = Projected Market Share × Forecasted Spend on Specific Business
Related: Survivability Score: How We Calculate It & Why It Matters
StreetSpring recalculates survivability using the latest competitive, demographic, and walkability data. StreetSpring's Survivability Scores are updated regularly, so the most accurate prediction for your exact storefront is always available in the live tool.
Pinpointing the Right Neighborhood for an Italian Restaurant in Baltimore
StreetSpring's analysis shows the best areas are Woodring, Towson, and Eastwood, while the most challenging neighborhoods would be Old Town, Glen Burnie, and Fallstaff. StreetSpring's Survivability Scores are updated regularly, so the most accurate prediction for your exact storefront is always available in the live tool. Static rankings provide a useful baseline, but the live tool captures changes that have occurred since publication.
Related Articles:
What Are the Best Neighborhoods in Baltimore to Open an Italian Restaurant?
Based on StreetSpring's 2026 analysis, the top neighborhood for an Italian Restaurant in Baltimore is Woodring with 88% average survivability, followed by Towson and Eastwood. 23 of 23 neighborhoods analyzed exceed 70% two-year survival.
New competitor openings and closures happen weekly — the live tool ensures you see the latest picture.
Should You Consider Lower-Survivability Areas of Baltimore for an Italian Restaurant?
Yes — neighborhood averages mask significant block-by-block variation. Even in neighborhoods ranked outside the top 10, individual storefronts with strong foot traffic, low direct competition, and favorable lease terms can outperform the area average. Location-level factors like visibility and adjacent tenants can override neighborhood-level trends. Always check your specific address in StreetSpring's live platform for the most accurate prediction.
How Often Are Italian Restaurant Rankings in Baltimore Updated?
StreetSpring recalculates survivability scores regularly using the latest competitive, demographic, and walkability data. Rankings are updated quarterly; the live tool always reflects the most current predictions for any address in Baltimore.
Should You Rent Your Baltimore Storefront to an Italian Restaurant?
In Woodring, StreetSpring forecasts a 86.5% – 89.2% average chance for a new Italian Restaurant to survive more than 2 years, depending on the exact storefront. Check the current Survivability Score for any address instantly.
Landlord Survivability Data for Italian Restaurant in Baltimore
For landlords evaluating tenant applications, StreetSpring's data provides a clear comparison across the top neighborhoods. In Woodring, an Italian Restaurant has a 86.5% – 89.2% average chance of surviving more than 2 years. In Towson, the range shifts to 85.0% – 87.7%, and in Eastwood, it is 84.1% – 86.8%. Get a live Survivability Score for your specific storefront at no cost.
Each prediction is calibrated to the specific address, factoring in foot traffic, competition, and consumer spending at that exact location.
Related: How Landlord Representatives Can Reduce Vacancy & Increase Tenant Longevity
Where in Baltimore Should You Open an Italian Restaurant?
You can see the best neighborhoods in or around Baltimore to open any type of business in our article Neighborhood Survivability Rankings: Baltimore.
Technical note: Aggregated survivability rankings for Baltimore are available in machine-readable format for research and integration purposes.
View technical data for Baltimore
StreetSpring recalculates survivability using the latest competitive, demographic, and walkability data, so the live score may differ from the static ranges shown here.
Visual Data
Related Resources
Same business type in other cities:
- Survivability Rankings for Italian Restaurant in Atlanta
- City Survivability Rankings for Italian Restaurant
Related:
- Business Survivability Rankings: Baltimore
- Neighborhood Survivability Rankings: Baltimore
- Business Survivability in Annapolis, Baltimore
Local Context FAQ
Additional questions with answers drawn directly from local data sources.
What 5-year survival rate does the federal government track for Italian Restaurants?
Italian Restaurants have a national 5-year survival rate of 50% per BLS Business Employment Dynamics (March 2025). StreetSpring's Baltimore corpus shows an average survivability score of 87% for this subtype, above the BLS baseline by 37 points.
How much does location matter for an Italian Restaurant in Baltimore?
The Baltimore survivability spread for Italian Restaurants runs from 61% (challenging locations) to 99% (best locations) — a 38-point window driven entirely by site selection.
What's the coverage of StreetSpring's Baltimore model for Italian Restaurants?
For Italian Restaurants, the Baltimore model produces survivability scores from 61% (low-end neighborhoods) to 99% (top neighborhoods), averaging 87%. Each storefront address gets a precise score that reflects block-level variation.