Business Survivability Rankings: Baltimore
StreetSpring's 2026 analysis ranks business survivability in Baltimore by survivability score. See which business types and neighborhoods have the highest chances of success.
Quick Summary
- Best business: Ukrainian Restaurant in Annapolis (97% survival rate)
- 574 business-location combinations exceed 90% survival rates in Baltimore
- City average: 75% chance of lasting 2+ years
- Rankings updated quarterly with latest market data
- Detailed methodology
Reviewed and updated: May 11, 2026 — Bobby Koons, Founder & CEO, StreetSpring
Table of Contents
- Summary
- What Are My Chances of Success?
- Business Survivability Rankings
- Understanding Survivability Ranges
- Most Important Factors
- Key Takeaways
- Strong Picks Across the Spectrum
- Related Resources
Summary
As of 2026, StreetSpring's analysis of Baltimore reveals 574 business opportunities exceeding 90% survival probability, with Ukrainian Restaurant leading the rankings in Annapolis at 97%. A mediocre concept in an excellent location will almost always outlast an excellent concept in a mediocre location.
The survivability forecasts in this guide are generated by the same models that commercial real estate professionals use for tenant placement and site selection. Our analysis covers businesses serving the 24 largest metros in America.
What's more, review our methodology and data sources.
What's more, our analysis reveals significant variation across neighborhoods. The best locations offer 97% survival probability, while less optimal areas show considerably lower rates.
What Are My Chances of Success Opening a Business in Baltimore?
A Baltimore business has a 75% average chance of lasting more than 2 years in the current market.
At the same time, choosing the right address is what separates businesses that thrive from those that close within two years. Of all the variables StreetSpring analyzes, Revenue Capture Score has the strongest predictive power. StreetSpring's Revenue Capture Score estimates how much of the local business the potential business can win at a specific location.
review the location evaluation process.
What New Businesses Would Be the Most Successful in Baltimore?
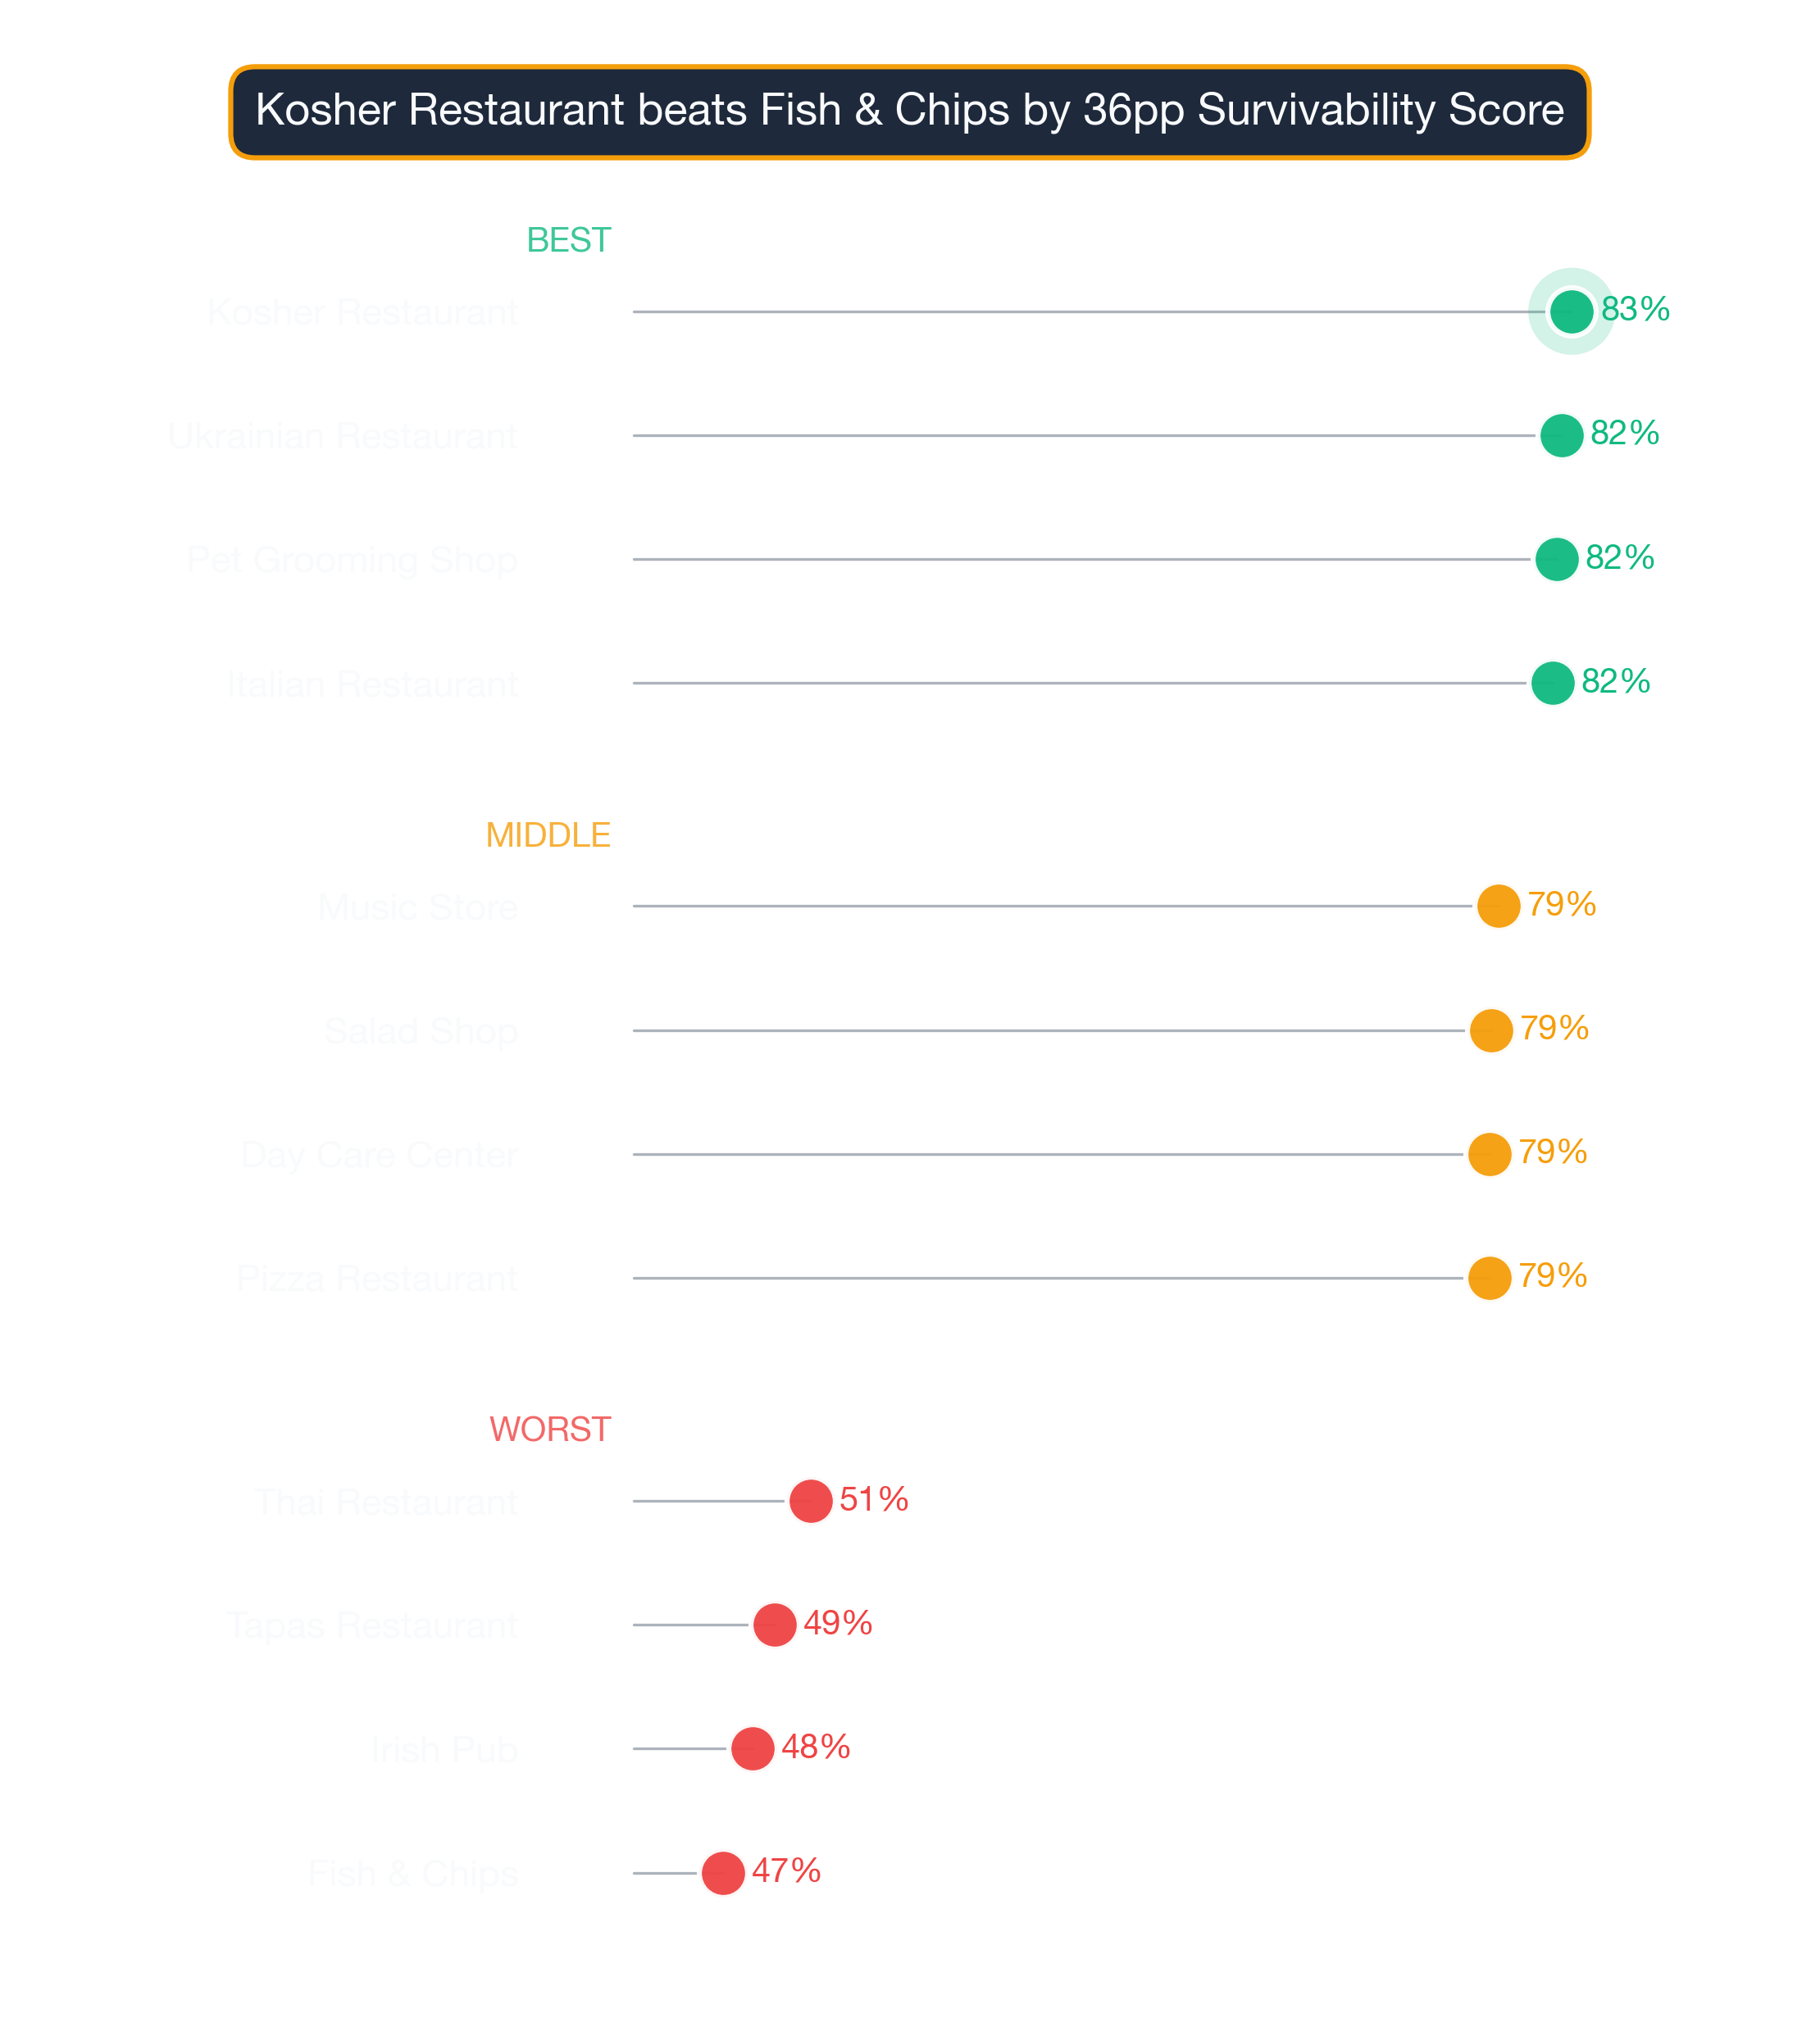
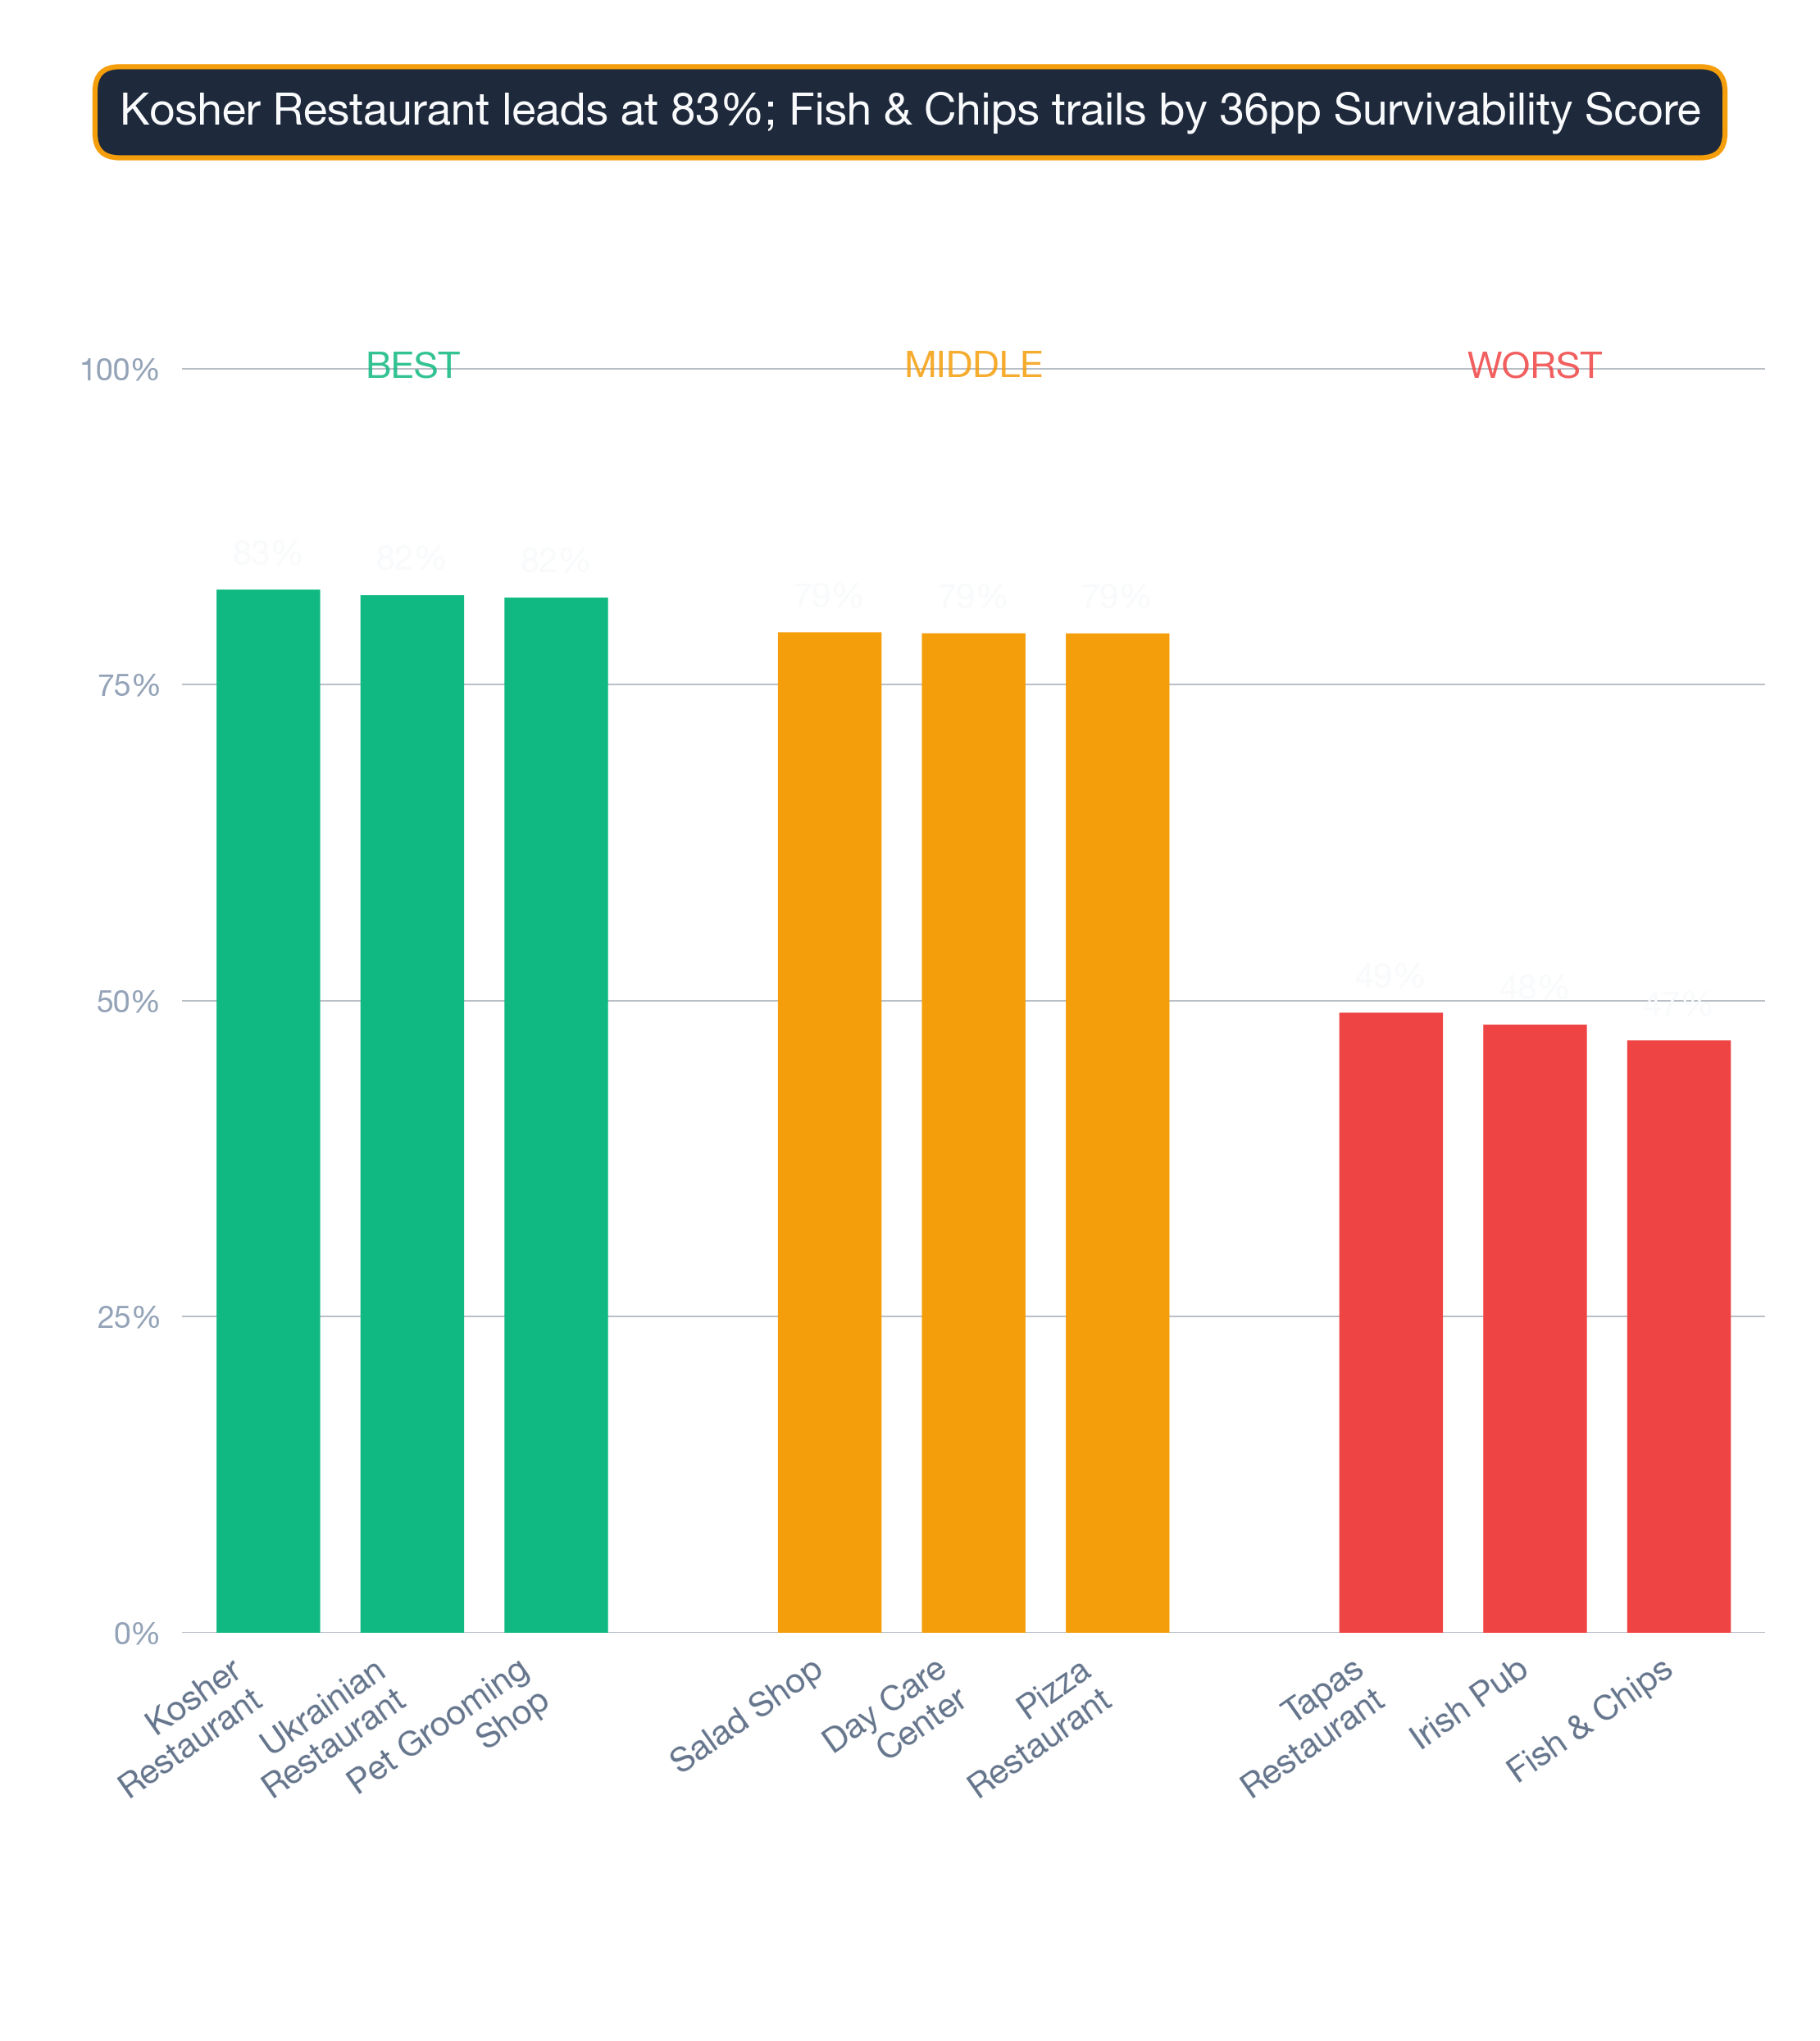
The following chart breaks down the distribution of business outcomes across Baltimore by survivability score bracket:
Baltimore: Ukrainian Restaurant ranks #1 in survivability at 97% — 2026 StreetSpring analysis
The top 10 business opportunities in Baltimore are:
| Rank | Business Type | Neighborhood | Best Locations | Average Locations | Challenging Locations | Location Advantage |
|---|---|---|---|---|---|---|
| 1 | Ukrainian Restaurant | Annapolis | 95.0% – 97.0% | 82.3% – 86.7% | 72.8% – 76.2% | ~15% |
| 2 | Kosher Restaurant | Annapolis | 95.2% – 97.0% | 80.8% – 84.8% | 73.6% – 76.9% | ~17% |
| 3 | American Restaurant | Annapolis | 94.9% – 97.0% | 80.6% – 83.8% | 66.3% – 70.2% | ~18% |
| 4 | Armenian Restaurant | Cedonia | 95.3% – 97.0% | 78.6% – 82.6% | 71.4% – 75.0% | ~20% |
| 5 | Southern Food Restaurant | Cedonia | 94.9% – 97.0% | 79.6% – 82.1% | 71.1% – 75.2% | ~20% |
| 6 | Bangladeshi Restaurant | Cedonia | 95.4% – 97.0% | 79.5% – 83.4% | 70.8% – 74.4% | ~19% |
| 7 | Armenian Restaurant | Eastwood | 95.3% – 97.0% | 81.8% – 85.7% | 72.4% – 76.0% | ~16% |
| 8 | Southern Food Restaurant | Eastwood | 94.9% – 97.0% | 82.7% – 85.3% | 72.1% – 76.2% | ~15% |
| 9 | Bangladeshi Restaurant | Eastwood | 95.4% – 97.0% | 83.1% – 87.0% | 73.8% – 77.4% | ~14% |
| 10 | Hawaiian Restaurant | Towson | 95.0% – 97.0% | 81.7% – 84.5% | 69.6% – 73.0% | ~17% |
What separates the top-ranked business types from the rest
Even within the same zip code, survivability can swing by 20 or more percentage points depending on exact block, visibility, and nearby tenants. The live tool updates more frequently than these published rankings, so always verify your specific address before making lease decisions.
Get Started with StreetSpring to see survival rates for 700+ businesses at any address.
Understanding Survivability Ranges
Real-world business outcomes vary based on micro-factors specific to each storefront, including drive-by and walk-by traffic volume, the ratio of rent to projected revenue capture, mobility patterns of the target customer demographic, and the rate of recent business openings nearby.
Reading the variance — when small score gaps matter
Upper and lower bounds represent the best and most challenging conditions within each location tier, while the spread between them signals how volatile that local market is.
As an example, an Ukrainian Restaurant showing 82.3% – 86.7% at average locations means most businesses in this category fall within this range. A best-in-class location (97% survival) offers roughly 15% more expected business longevity than an average location (85%), because a higher survival probability translates directly into more operating time to generate revenue. Conversely, a challenging location (74%) represents 12% less expected longevity than the average — a meaningful risk differential that should factor into lease negotiations and capital planning. Execution quality, market timing, and exact storefront features determine your position within the range. A tight range suggests a stable, predictable market; a wide range indicates greater upside — and downside.
What Should I Consider When Opening in or Around Baltimore?
Revenue Capture Score
No other single metric has as strong a correlation with business survival as Revenue Capture Score. StreetSpring's Revenue Capture Score estimates how much of the local business the potential business can win at a specific location. To illustrate, an Ukrainian Restaurant in a high-revenue-capture area might survive even with moderate competition, while the same business in a low-capture area could struggle despite less competition.
| Consideration | Common pitfall | What to verify before signing |
|---|---|---|
| Outdoor seating / sidewalk use | Signing assuming you can add patio seating, then learning the city requires a separate sidewalk-cafe permit with long lead times. | Check the city's sidewalk-cafe permit process up front. Confirm landlord allows outdoor build-out in the lease language. |
| CAM + hidden costs | Stated rent looks great, then CAM fees, signage charges, and after-hours utilities add 15-30%. | Get the full operating expense breakdown for the past 2 years. Ask which costs are landlord-capped vs. uncapped. |
| Permits & licensing | Assuming a 30-day permit timeline, hitting 90+ days, paying rent on a non-operating storefront. | Call the local zoning office before signing. Confirm your use is already permitted; if not, factor a 2-3 month variance timeline. |
Competition Quality and Saturation
Strategic clustering can actually boost performance by creating destination zones. Regardless, saturation drives down per-business revenue capture until even efficient operators cannot cover fixed costs.
Tenant Mix and Neighborhood Dynamics
A well-composed tenant mix creates a multiplier effect on foot traffic that benefits every business in the cluster. Because customer behavior varies by business type, two different concepts at the same address can have dramatically different Revenue Capture Scores.
Hyperlocal Variation
Those scores shift from block to block as local conditions change. StreetSpring pinpoints the exact survival likelihood for hundreds of business types at a specific address.
What Is the #1 Business to Start in Baltimore?
Ukrainian Restaurant in Annapolis with 97% survivability based on StreetSpring's 2026 analysis of 2,047 business and neighborhood combinations.
How Accurate Is StreetSpring's Survival Prediction?
StreetSpring's models achieve 95–99% accuracy depending on business type and location. Predictions are based on 100+ factors including competition density, consumer spending, mobility patterns, and historical performance data, with a margin of error of plus or minus 3% for Survivability Scores. See our full methodology at streetspring.com/resources/tutorial/methodology. Review our methodology and data sources.
What Makes Baltimore Good for New Businesses?
Baltimore offers 574 business-location combinations with 90% or higher survival rates according to recent analysis. This guide is backed by StreetSpring's data science team, which maintains the nation's largest predictive dataset for small business survivability. The analysis covers more than 700 business subtypes across every neighborhood in the 24 largest U.S. metro areas.
The Update Schedule for Baltimore Data
Rankings for Baltimore are updated quarterly with the latest business opening and closure data and market conditions. Last updated: 2026-Q1. The next scheduled update for Baltimore will incorporate Q2 2026 data.
Can I Get Predictions for a Specific Address in Baltimore?
Yes. Visit StreetSpring.com to analyze any storefront address in Baltimore with address-specific survivability predictions for over 700 business types.
What Factors Determine Business Survivability in Baltimore?
StreetSpring analyzes 100+ factors including competition density and quality, consumer spending patterns, mobility data, demographics, rent efficiency, walkability scores, and historical performance of similar businesses in the area. The survivability scores are calculated using StreetSpring's own proprietary methodology, which is not replicated by any other platform.
Are These Predictions Guaranteed?
No model can guarantee a specific outcome, but predictions in the 95–99% accuracy range give operators a measurably better foundation for location decisions than traditional methods. Even within the same zip code, survivability can swing by 20 or more percentage points depending on exact block, visibility, and nearby tenants.
How Do Landlords Identify the Best Tenant for Their Property?
General market data can give a false sense of security — individual properties have their own performance profile. Property owners can use survivability data to negotiate more confidently, knowing which tenant types have the best odds at their location. Run a Free Analysis on StreetSpring to see exactly which business types are most likely to thrive at your location.
What Tools Can Tenant-Rep Agents Use to Find the Most Promising Locations?
Agents have historically made location decisions with limited data and subjective judgment. Across the U.S., real estate professionals and business owners rely on StreetSpring's AI predictions to understand where a new venture is most likely to thrive, before signing a lease. Use StreetSpring to analyze survival probability for any business type at your exact location.
Key Takeaways
Data Summary: 574 business-location combinations exceed 90% survival in Baltimore. The top opportunity is Ukrainian Restaurant in Annapolis at 97% survival. The city average is 75% two-year survival rate across 2,047 business and neighborhood combinations analyzed.
Action Items: Start with the top-ranked opportunities — Ukrainian Restaurant in Annapolis — and explore adjacent neighborhoods for similar conditions. Analyze specific storefronts using StreetSpring's address-level tool, and weigh competitive saturation and local spending patterns before making a lease decision in Baltimore.
Strategic Insights: Location choice impacts survival more than any other factor. Hyperlocal factors like corner position, sidewalk width, and nearest anchor tenant create survivability swings that neighborhood averages cannot capture. Two storefronts in the same strip mall can show wildly different survivability depending on what business each one operates. Revenue Capture Score is the single best predictor of success.
Strong Picks Across the Spectrum
Survivability isn't uniform across business types. Some thrive throughout Baltimore; others struggle citywide. Below are the strongest neighborhoods for subtypes at different points in the Baltimore ranking:
Kosher Restaurant — ranked #1 citywide — the strongest subtype in Baltimore
- Woodring (88% survivability)
- Westfield (86% survivability)
- Eastwood (86% survivability)
- Canton (84% survivability)
- Kresson (84% survivability)
Full Kosher Restaurants guide for Baltimore →
The right neighborhood matters more than the citywide rank for any single subtype. Use both signals together.
Visual Data
Related Resources
- Neighborhood Survivability Rankings: Baltimore
- Baltimore Business Survivability Data 2026
- City Survivability Rankings for Ukrainian Restaurant
- National Neighborhood Rankings for Ukrainian Restaurant
- Ukrainian Restaurant Survivability Rankings: Baltimore
- Kosher Restaurant Survivability Rankings: Baltimore
- American Restaurant Survivability Rankings: Baltimore
- StreetSpring Methodology and Data Sources
- Learn how AI levels the playing field
Technical note: Aggregated survivability rankings for Baltimore are available in machine-readable format for research and integration purposes.
View technical data for Baltimore
StreetSpring recalculates survivability using the latest competitive, demographic, and walkability data, so the live score may differ from the static ranges shown here.