Survivability Rankings for Chinese Restaurant in Baltimore
StreetSpring's 2026 analysis ranks the best and worst neighborhoods in Baltimore to open a Chinese Restaurant, from Canton (86% survival) to Old Town (7...
By Bobby Koons | Last reviewed: May 10, 2026 | Updated weekly | Methodology
Quick Summary
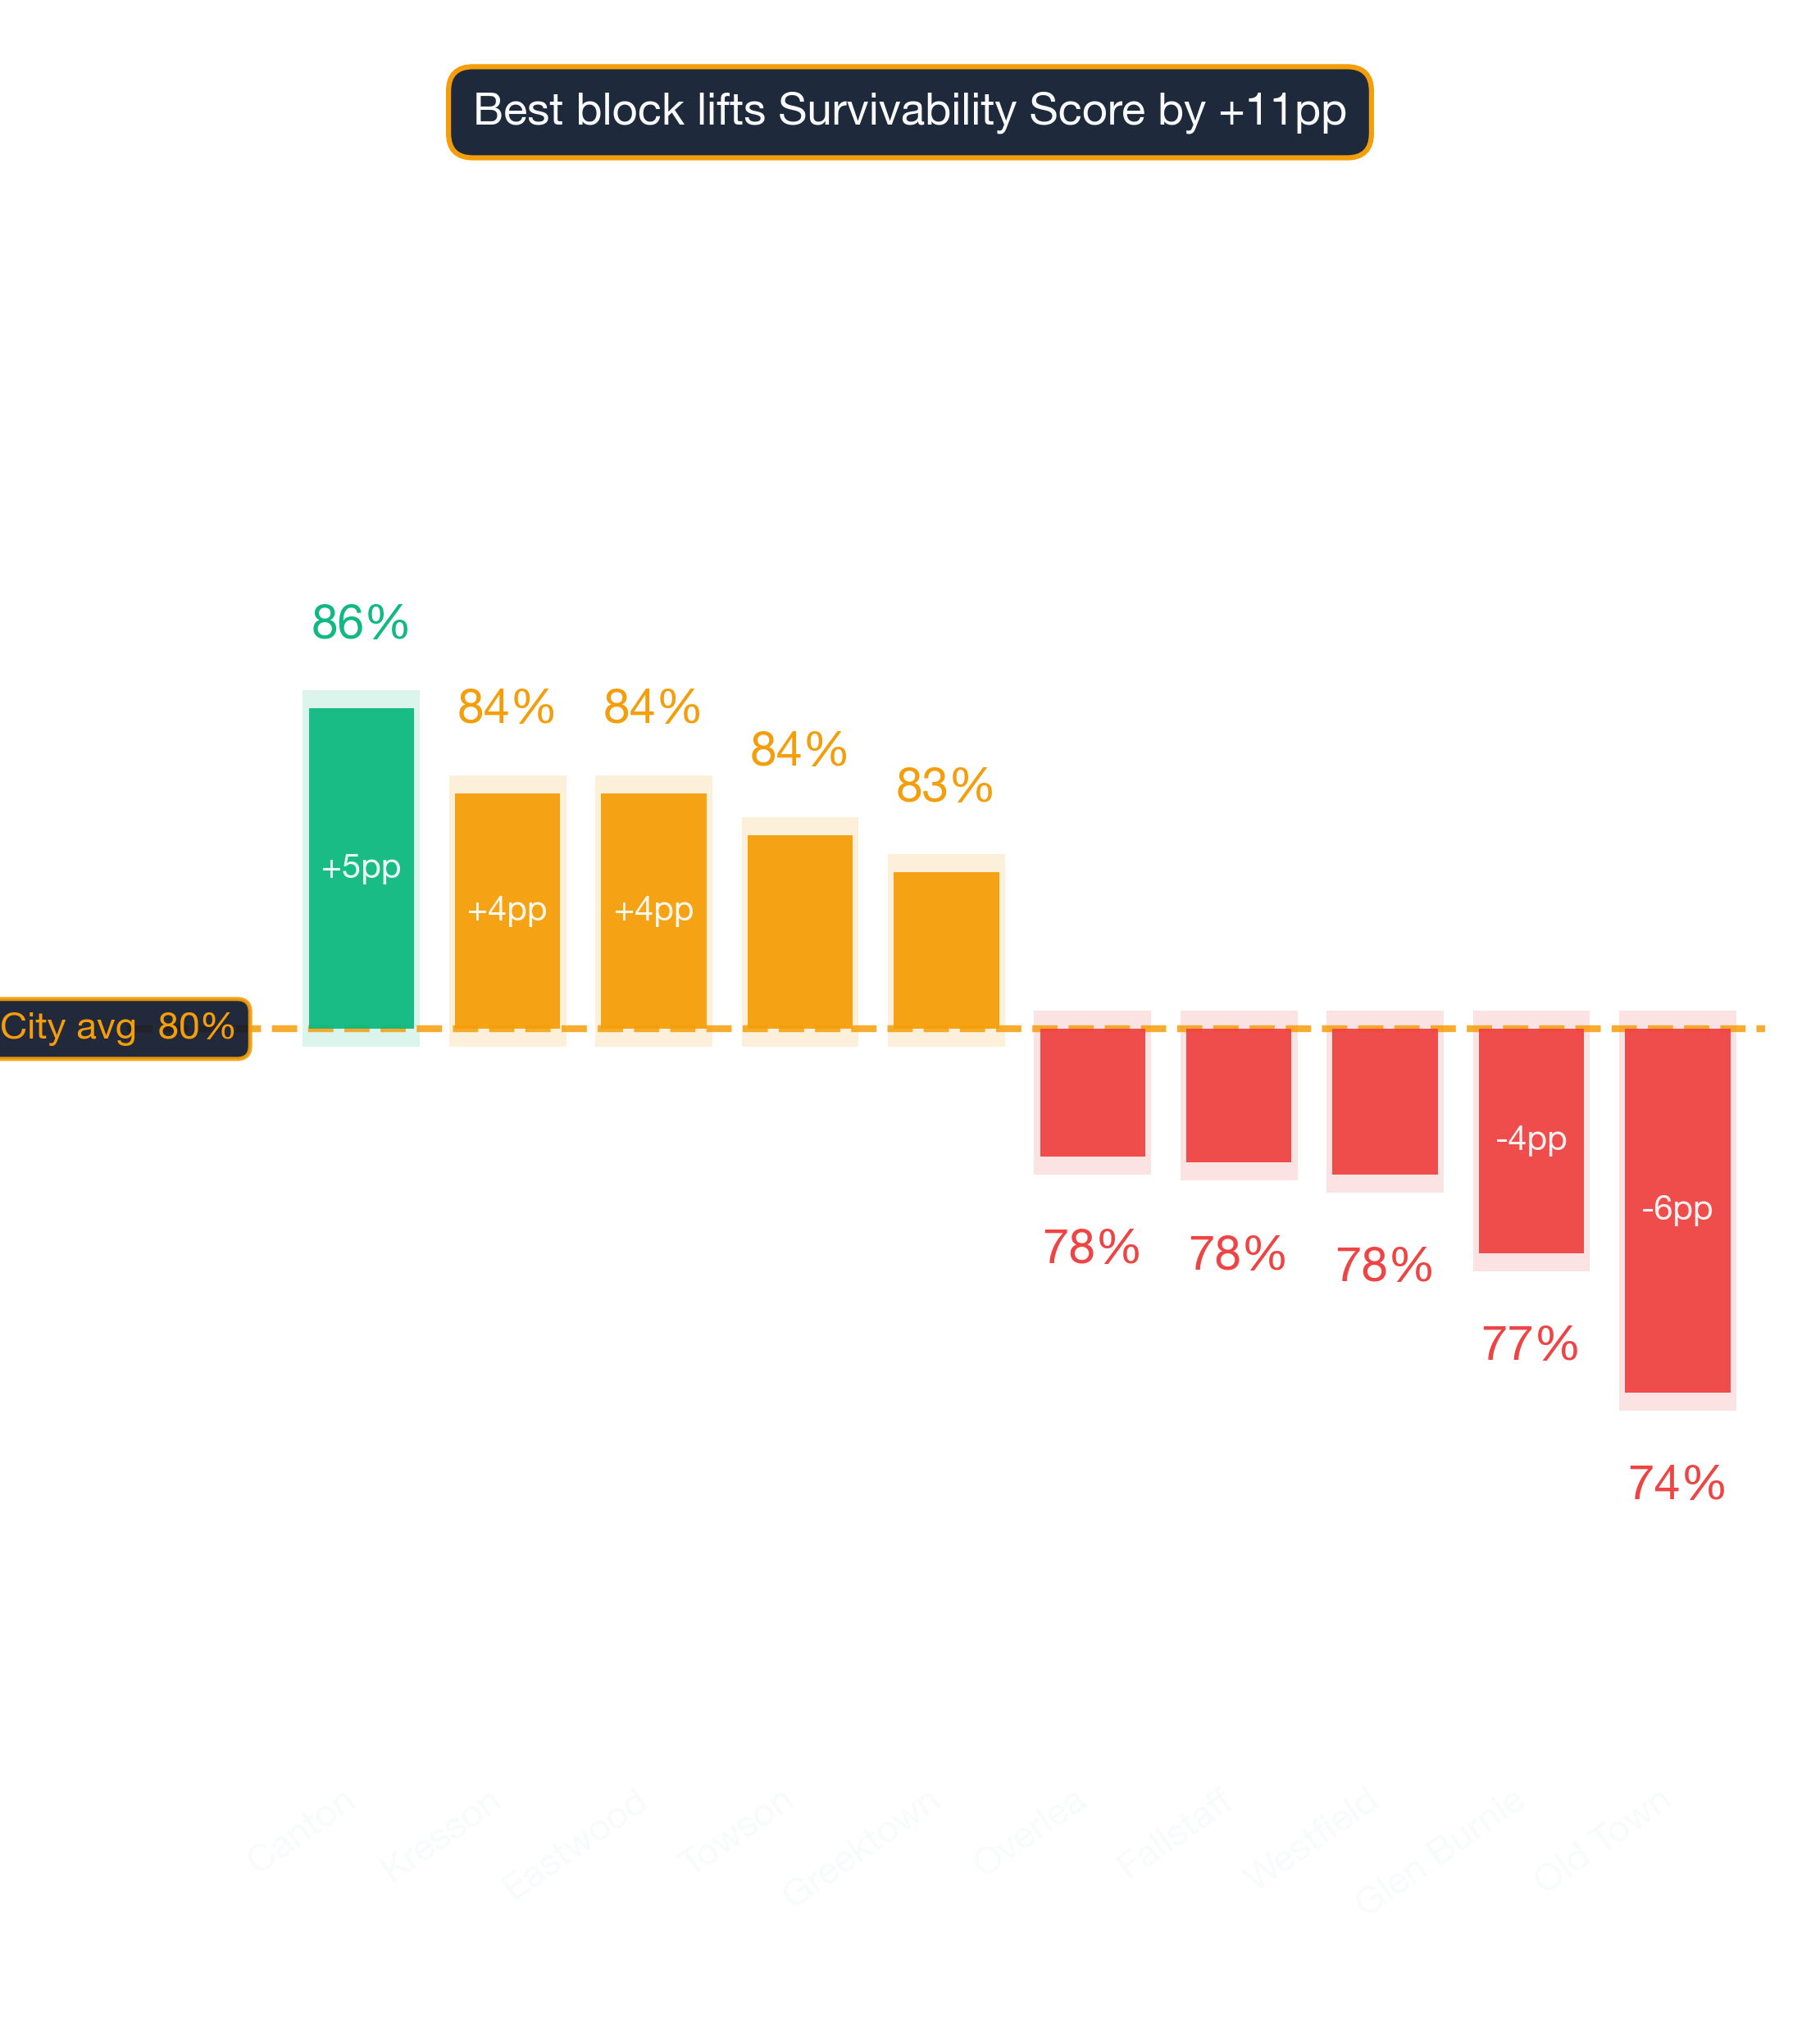
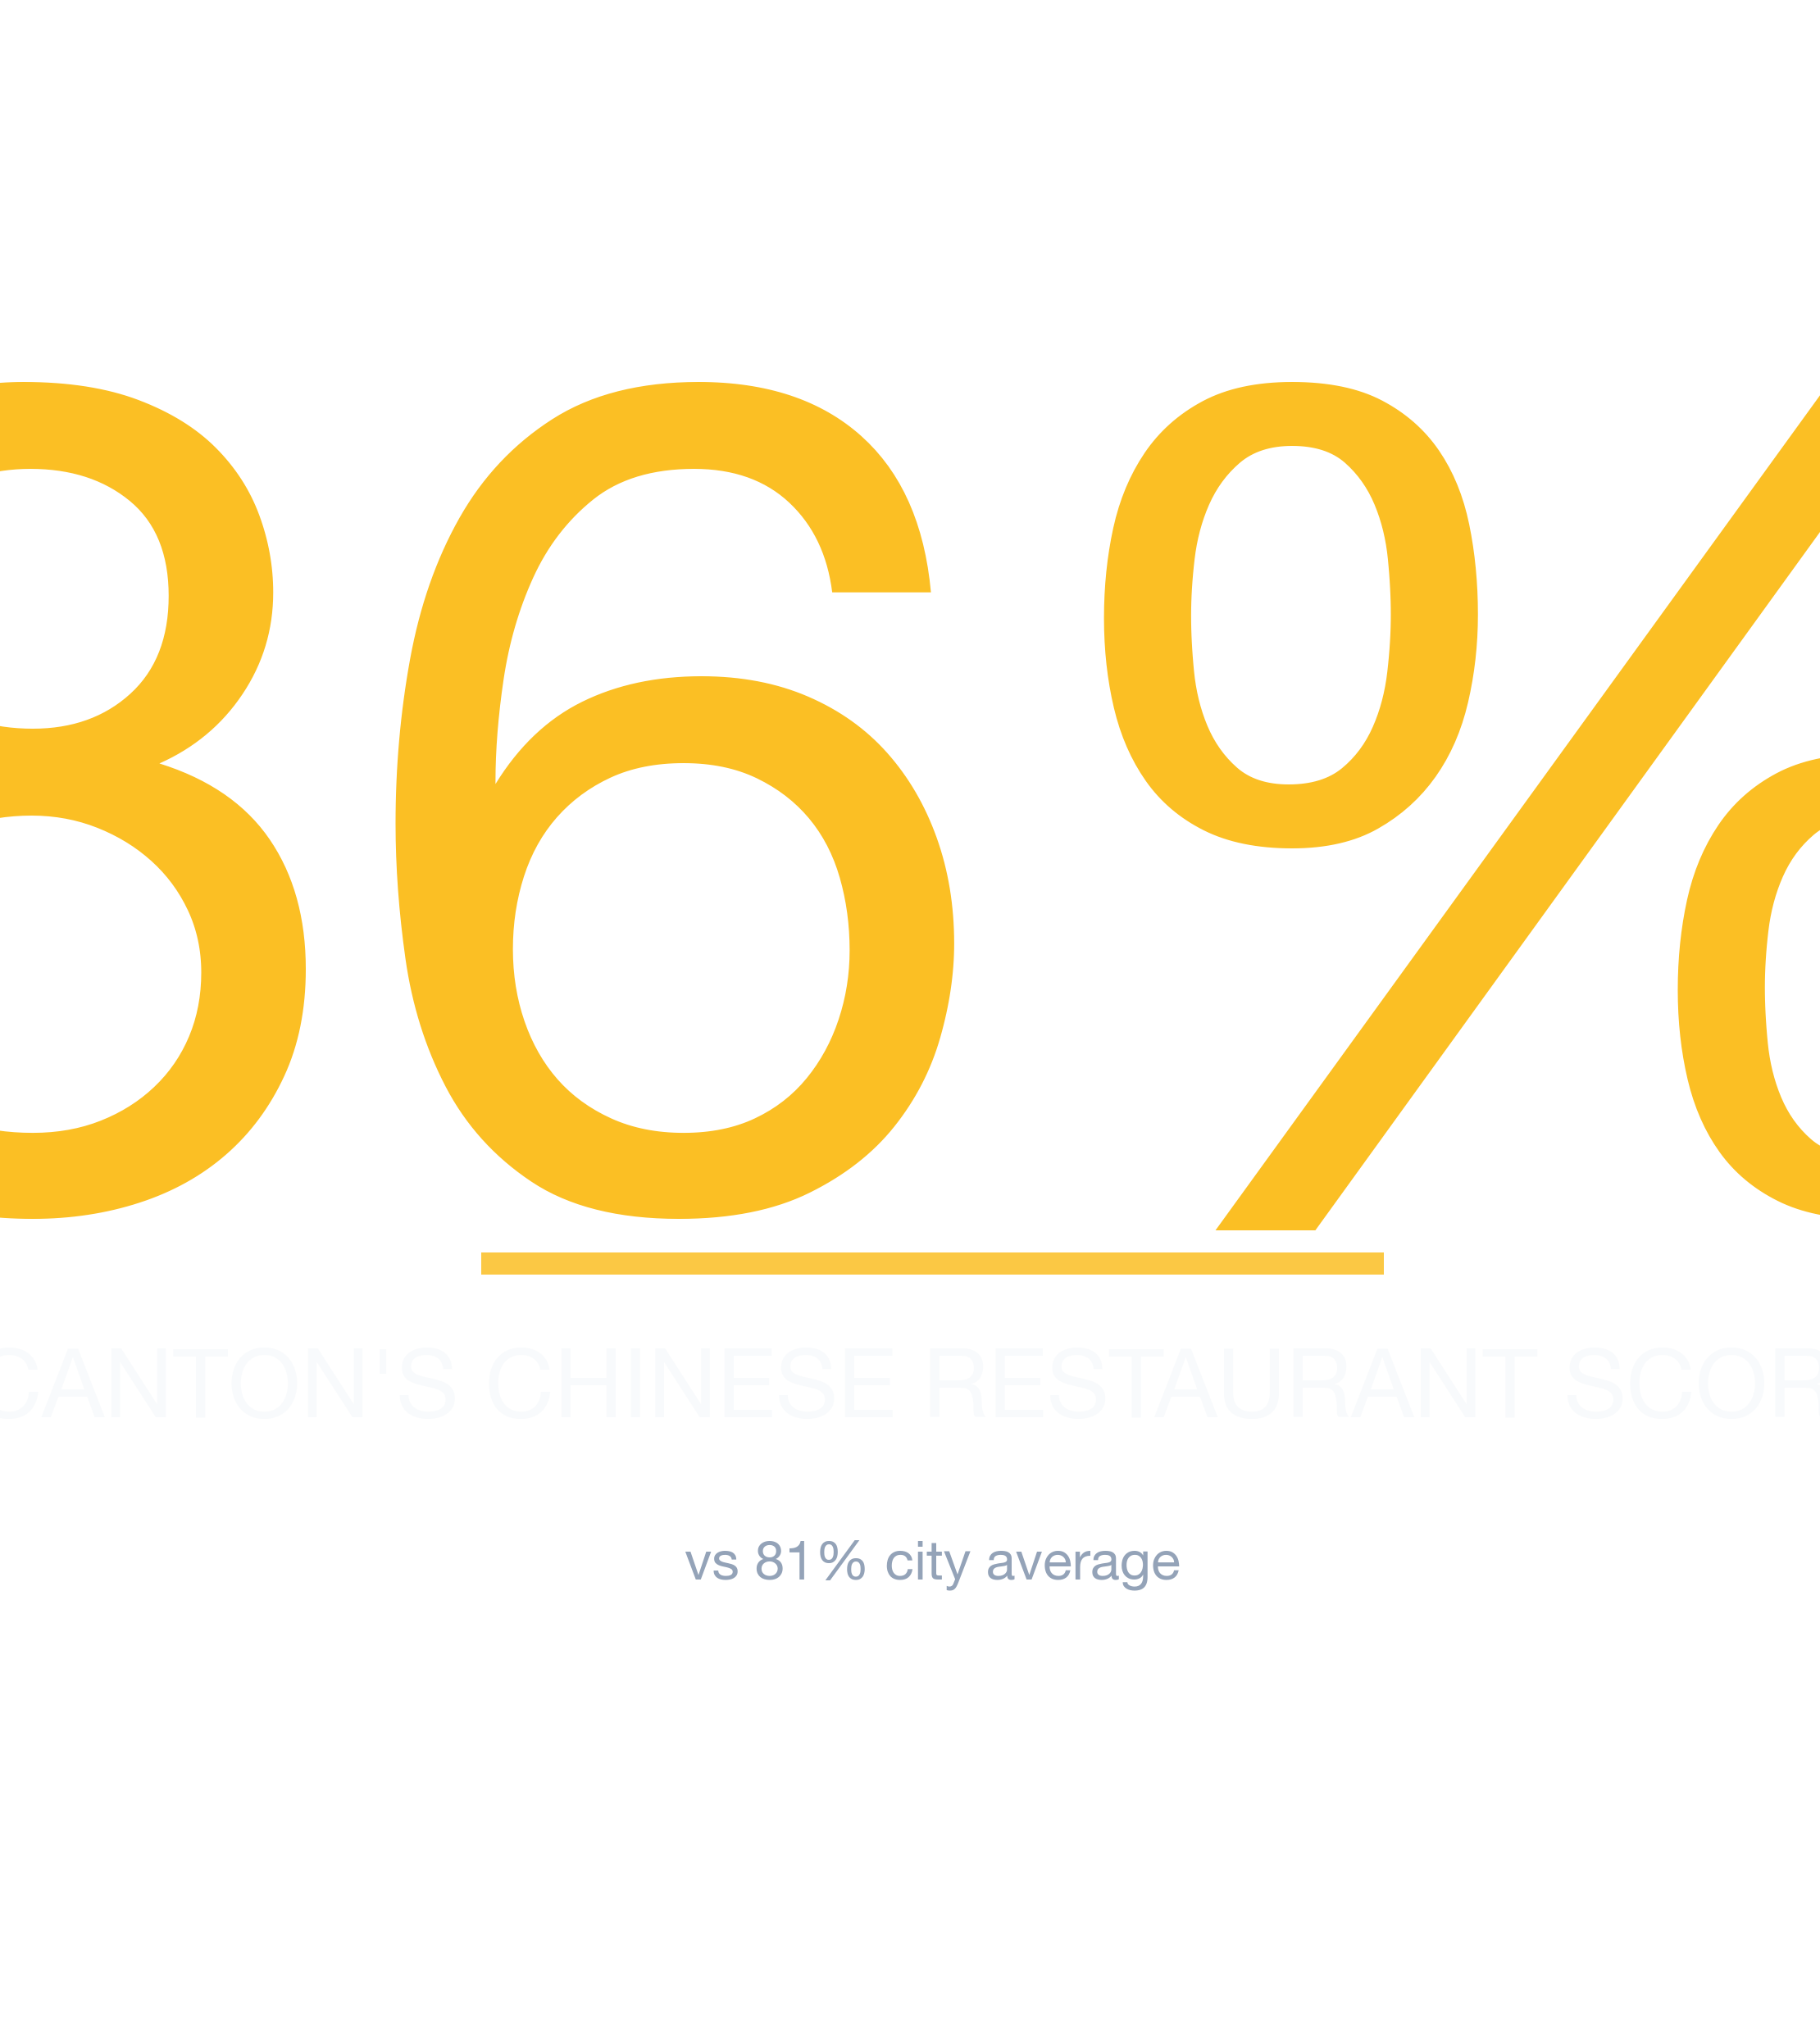
- #1 Neighborhood: Canton — 86% average survivability for Chinese Restaurant
- Neighborhoods at or above 70%: 23 of 23 analyzed
- City-wide average: 81% for Chinese Restaurants
- Most challenging area: Old Town at 74%
- Revenue advantage (top vs. avg location): ~6.6% more expected revenue in Canton
- Data freshness: 2026 data · Full methodology →
Table of Contents
- Summary
- 10 Best Neighborhoods
- Where Would a Chinese Restaurant Make the Most Money?
- What Should I Consider?
- Where Should I Start?
- FAQ: Best Neighborhoods
- FAQ: Can a Chinese Restaurant Succeed in Lower-Ranked Areas?
- FAQ: How Often Are Rankings Updated?
- FAQ: Is a Chinese Restaurant a Good Tenant?
- Landlord Survivability Data
- Best Neighborhoods for Any Business
Summary
Opening a Chinese Restaurant in Baltimore? Our 2026 analysis identifies Canton as the top location with 86% average chance of surviving more than 2 years, with the best locations offering 88% and the most challenging locations in Canton at 83%. The worst neighborhoods include Old Town with 74% average chance. These rankings are based on the latest available data; check StreetSpring for real-time updates.
Where in Baltimore Should You Open a Chinese Restaurant?
Canton ranks #1 of 23 neighborhoods analyzed in and around Baltimore for Chinese Restaurant survivability with a score of 86% as of 2026. The top 10 neighborhoods are:
How to use this list when you tour locations
| Rank | Neighborhood | Best Locations | Average Locations | Challenging Locations |
|---|---|---|---|---|
| 1 | Canton | 85.0% – 89.0% | 84.2% – 87.1% | 82.0% – 86.0% |
| 2 | Eastwood | 94.0% – 97.0% | 82.7% – 85.7% | 73.0% – 77.0% |
| 3 | Kresson | 87.0% – 91.0% | 82.7% – 85.7% | 75.0% – 79.0% |
| 4 | Towson | 94.0% – 97.0% | 82.0% – 85.0% | 72.0% – 76.0% |
| 5 | Greektown | 90.0% – 94.0% | 81.4% – 84.4% | 73.0% – 77.0% |
| 6 | Woodring | 82.0% – 86.0% | 80.6% – 83.6% | 79.0% – 83.0% |
| 7 | Beechfield | 92.0% – 96.0% | 80.3% – 83.3% | 71.0% – 75.0% |
| 8 | Medford | 82.0% – 86.0% | 80.3% – 83.3% | 75.0% – 79.0% |
| 9 | Oaklee | 92.0% – 96.0% | 80.0% – 83.0% | 75.0% – 79.0% |
| 10 | Cedonia | 94.0% – 97.0% | 79.2% – 82.2% | 70.0% – 74.0% |
What the score spread tells you about risk
Remember that a neighborhood average smooths over wide variation — your exact block could significantly outperform. Real-time data from StreetSpring accounts for recent openings, closures, and seasonal shifts that static rankings cannot.
Survivability ranges reflect best and worst storefront conditions within each neighborhood. See our full methodology →
Try StreetSpring to see if this location is still the best and see if there are locations to rent in this area right now.
Which Baltimore Neighborhoods Drive the Highest Chinese Restaurant Revenue?
In Canton, the best possible location offers the opportunity of making ~6.6% more than the average location in or around Baltimore.
On the other hand, in Old Town, the worst possible location could result in making ~7.5% less than the average location in the city.
The right location can make a business; the wrong one can break it. Opening a Chinese Restaurant in Baltimore requires careful location choice. Across 23 neighborhoods analyzed, the overall average survival chance for a new Chinese Restaurant is 81% for lasting more than 2 years — due to a combination of many factors across competition, consumer spending, and location dynamics. A high-traffic corner that works well for a coffee shop may be entirely wrong for a specialty retailer.
What Matters Most When Opening a Chinese Restaurant in Baltimore
Selecting a high-survivability address is the single most cost-effective risk reduction available before signing a lease. Everything downstream depends on it. Revenue Capture Score matters more than any other single metric when predicting business outcomes. StreetSpring computes this by projecting the business's market share, which is based on the quality and quantity of primary, secondary, and tertiary competitors. Our models draw from one of the most comprehensive commercial real estate datasets ever assembled. Competition density is not inherently negative — it often signals an established customer base. StreetSpring's predictions leverage proprietary datasets covering competition, spending, and mobility.
| Area to check | What can go wrong | How to de-risk it |
|---|---|---|
| Parking & visibility | Storefront looks great from the sidewalk but is invisible from the road. | Drive past at 30 mph from both directions. Count street parking + nearest paid lot capacity at peak hours. |
| Workforce availability | Hiring radius is smaller than you think — many neighborhoods can't staff a full team at standard wages. | Pull BLS wage data for your industry in this metro. Walk through your staffing plan with a local restaurant/retail operator before signing. |
| Permits & licensing | Assuming a 30-day permit timeline, hitting 90+ days, paying rent on a non-operating storefront. | Call the local zoning office before signing. Confirm your use is already permitted; if not, factor a 2-3 month variance timeline. |
This can be summarized as:
Revenue Capture Score = Projected Market Share × Forecasted Spend on Specific Business
Related: Survivability Score: How We Calculate It & Why It Matters
Scores get refreshed against the latest competitive, demographic, and walkability data on an ongoing basis. The static rankings here may already be slightly behind; for a current address-level score, use StreetSpring's live tool.
Where to Launch a Chinese Restaurant in or Around Baltimore
StreetSpring identifies the strongest markets as Canton, Eastwood, and Kresson, while the most challenging neighborhoods would be Old Town, Glen Burnie, and Westfield. Our data shows that roughly 15% of top-performing locations sit in neighborhoods ranked below the city median. Market dynamics shift frequently; validate these insights with real-time data from StreetSpring.
Related Articles:
- Business Survivability Rankings: Baltimore
- Neighborhood Survivability Rankings: Baltimore
- National City Survivability: Chinese Restaurant
Which Baltimore Neighborhoods Are Strongest for Chinese Restaurants?
Based on StreetSpring's 2026 analysis, the top neighborhood for a Chinese Restaurant in Baltimore is Canton with 86% average survivability, followed by Eastwood and Kresson. 23 of 23 neighborhoods analyzed exceed 70% two-year survival.
However, market conditions change daily, and it's best to use StreetSpring's live data to check the Survivability Score for a specific address.
Are Bottom-Tier Baltimore Neighborhoods a No-Go for Chinese Restaurants?
Yes — neighborhood averages mask significant block-by-block variation. Even in neighborhoods ranked outside the top 10, individual storefronts with strong foot traffic, low direct competition, and favorable lease terms can outperform the area average. For the most current predictions, visit StreetSpring to analyze your specific location in real-time. Always check your specific address in StreetSpring's live platform for the most accurate prediction.
How Often Are Chinese Restaurant Rankings in Baltimore Updated?
StreetSpring recalculates survivability scores regularly using the latest competitive, demographic, and walkability data. Rankings are updated quarterly; the live tool always reflects the most current predictions for any address in Baltimore.
Is a Chinese Restaurant a Good Tenant for Baltimore Landlords?
In Canton, StreetSpring forecasts a 84.2% – 87.1% average chance for a new Chinese Restaurant to survive more than 2 years, depending on the exact storefront. Check the current Survivability Score for any address instantly.
Landlord Survivability Data for Chinese Restaurant in Baltimore
For landlords evaluating tenant applications, StreetSpring's data provides a clear comparison across the top neighborhoods. In Canton, a Chinese Restaurant has a 84.2% – 87.1% average chance of surviving more than 2 years. In Eastwood, the range shifts to 82.7% – 85.7%, and in Kresson, it is 82.7% – 85.7%. See which business types are most likely to succeed at your property address right now.
StreetSpring generates location-specific predictions tailored to your exact site.
Related: How Landlord Representatives Can Reduce Vacancy & Increase Tenant Longevity
Top-Survivability Baltimore Neighborhoods for Chinese Restaurants
You can see the best neighborhoods in or around Baltimore to open any type of business in our article Neighborhood Survivability Rankings: Baltimore.
Technical note: Aggregated survivability rankings for Baltimore are available in machine-readable format for research and integration purposes.
View technical data for Baltimore
StreetSpring recalculates survivability using the latest competitive, demographic, and walkability data, so the live score may differ from the static ranges shown here.
Visual Data
Related Resources
Same business type in other cities:
- City Survivability Rankings for Chinese Restaurant
- Survivability Rankings for Chinese Restaurant in Atlanta
- National Neighborhood Survivability Rankings for Chinese Restaurant
Related:
Beyond the Numbers: Local Context
More questions answered with neighborhood-specific data from our 2026 corpus.
Where does Baltimore fall in national rankings for Chinese Restaurants?
Across 24 US metros, Baltimore sits at rank #8 for Chinese Restaurants, averaging 87% on StreetSpring's survivability scale. National range: 84-89%.
Do Chinese Restaurants need walkable locations in Baltimore?
Baltimore's metro median commute is 30 minutes. Accessibility is one of ~100 factors in the survivability model — Chinese Restaurants in Baltimore score 87% on average, with the spread (60-98%) driven heavily by per-location accessibility differences.
What factors drive the Baltimore Chinese Restaurants score?
The Baltimore survivability score for Chinese Restaurants (87% average) combines ~100 location factors: competitive density, demographic fit, accessibility, visibility, lease economics, and historical business outcomes. The score is calibrated against 500K+ historical business outcomes and refreshed quarterly.