National Neighborhood Survivability Rankings for Barbecue Restaurant
StreetSpring's 2026 nationwide analysis ranks the top neighborhoods across all major US cities for Barbecue Restaurants. See which neighborhoods offer the highest Survivability Scores.
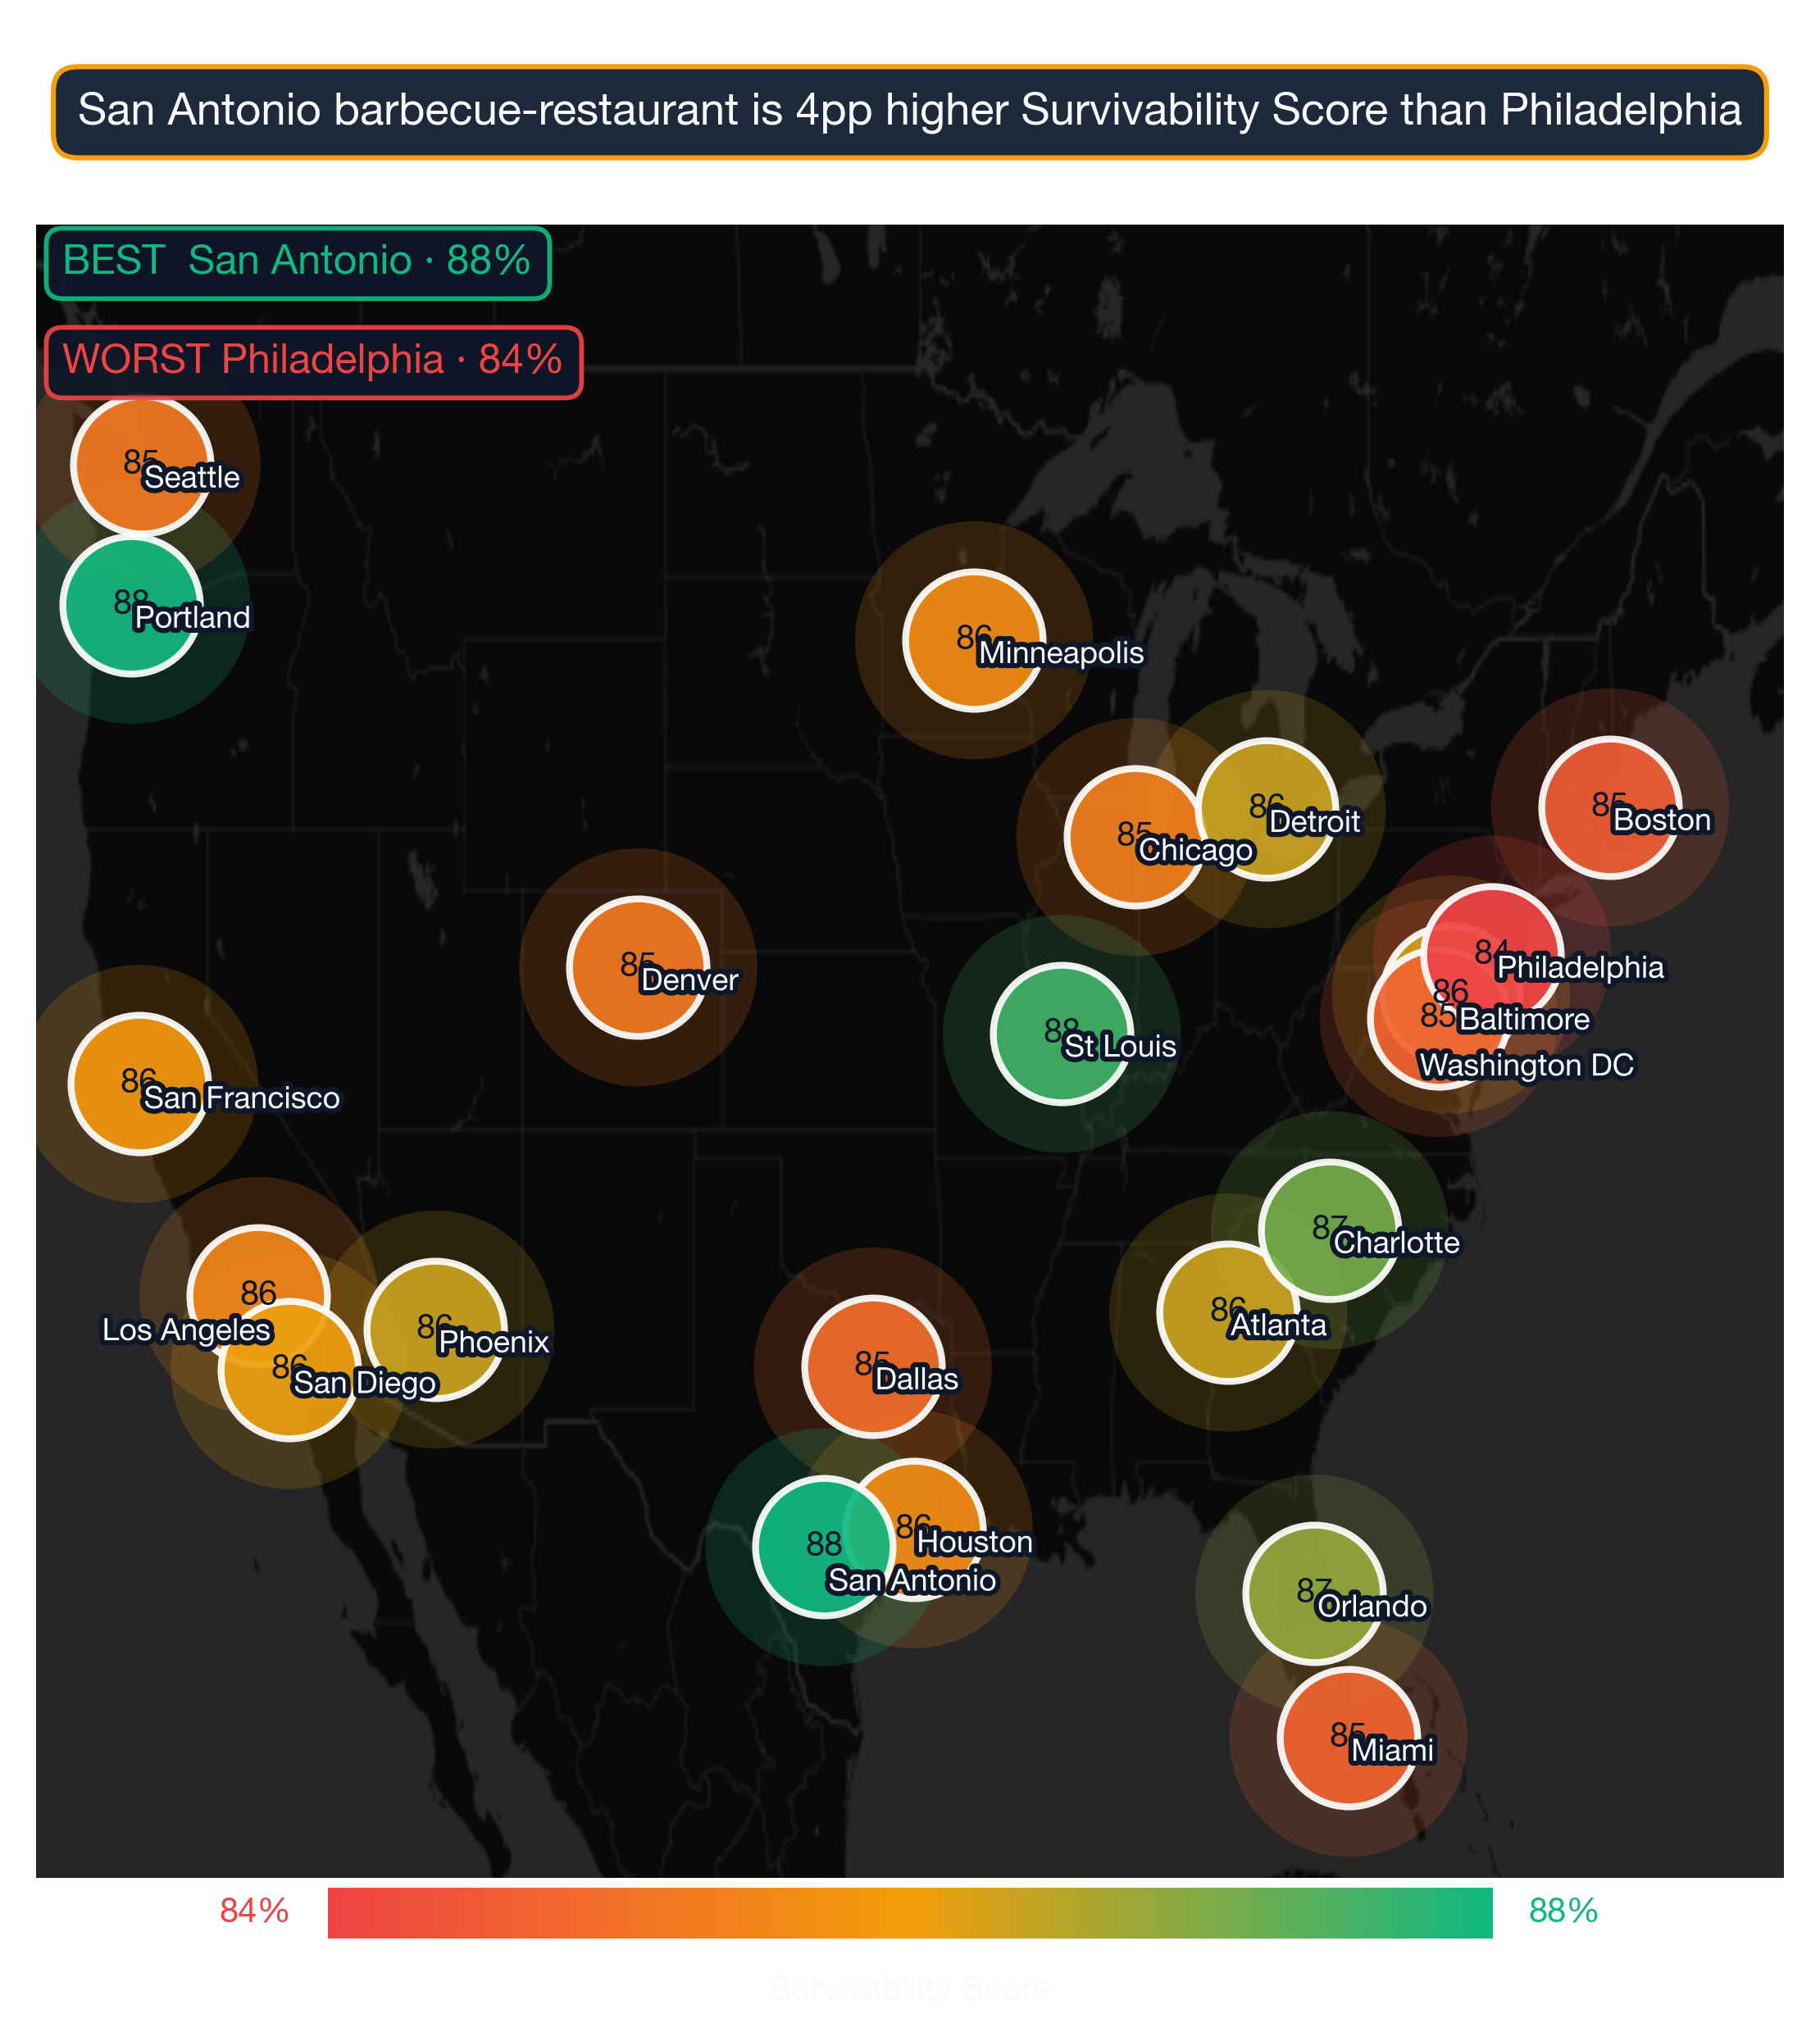
Our 2026 analysis of neighborhoods across 24 US metros shows Fremont Park in Los Angeles as the top location to open a Barbecue Restaurant — 82% survivability puts it ahead of every other neighborhood in the country. The top 25 neighborhoods nationwide span 8 different cities, demonstrating that exceptional opportunities for Barbecue Restaurants exist across diverse markets. Rankings like this are a strong starting point, but the live survivability score in StreetSpring will reflect the most current competitor data for your exact address.
To understand the methodology behind these rankings, see our detailed guide: Survivability Score: How We Calculate It & Why It Matters.
Last reviewed by Bobby Koons, Founder & CEO, StreetSpring — April 30, 2026
Quick Summary
- #1 Neighborhood: Fremont Park, Los Angeles — 82% survivability for Barbecue Restaurant
- Neighborhoods analyzed: 1426 across 24 major US cities
- National average survivability: 66.2% for Barbecue Restaurants
- Top-25 average: 80.5% — 14.3% above national average
- Data current as of: 2026 · Full methodology →
Table of Contents
- How neighborhoods compare nationwide
- Top 25 neighborhoods in the US
- Geographic patterns
- How to use this ranking
- Related resources
- Frequently asked questions
How do neighborhoods compare across the United States for Barbecue Restaurants?
Analyzing 1426 neighborhoods across 24 major US cities, StreetSpring's 2026 data shows that the best neighborhoods for Barbecue Restaurants significantly outperform average locations, with the top 25 neighborhoods nationwide averaging 80.5% survivability compared to the national neighborhood average of 66.2%.
This 14.3% advantage illustrates how critical neighborhood selection is — choosing a top-tier neighborhood versus an average one can significantly increase your long-term survival chances.
For a Barbecue Restaurant, the survivability advantage of a top-ranked neighborhood (averaging 80.5% versus the national average of 66.2%) translates directly into a longer survival horizon and a stronger revenue capture position. StreetSpring's model identifies Barbecue Restaurants survivability as particularly sensitive to the competitive density of direct and indirect competitors within a quarter-mile radius of the specific address.
Importantly, top-performing neighborhoods aren't concentrated in just a few cities. The top 25 neighborhoods represent 8 different cities. This means entrepreneurs focused on Barbecue Restaurants can find exceptional opportunities across the United States, not just in traditionally strong markets.
Survivability data consistently shows location accounts for more variance in business outcomes than any other controllable factor.
The strongest US neighborhoods for opening a Barbecue Restaurant
| Signal | Top-quartile neighborhood pattern | Bottom-quartile neighborhood pattern |
|---|---|---|
| Median household income alignment | Neighborhoods where median household income fits the subtype's typical customer profile (income elasticity matches). | Neighborhoods where income is either too low for the price tier or too high for the value-perception band. |
| Anchor-venue spillover | Neighborhoods within 0.25 miles of a major anchor (transit hub, university gate, hospital main entrance, concert venue). | Neighborhoods where the nearest anchor is past walking distance — no spillover demand. |
| Daytime population concentration | Mixed-use neighborhoods with strong daytime employment density (LEHD LODES > 8K jobs/sq mi). | Pure-residential neighborhoods where daytime population drops below 30% of resident count. |
The shared traits across the top 10
Survivability range for top, middle, and last-ranked neighborhoods. Box = best-to-challenging range; white line = average. Fremont Park, Los Angeles leads at 82% in 2026. Full methodology →
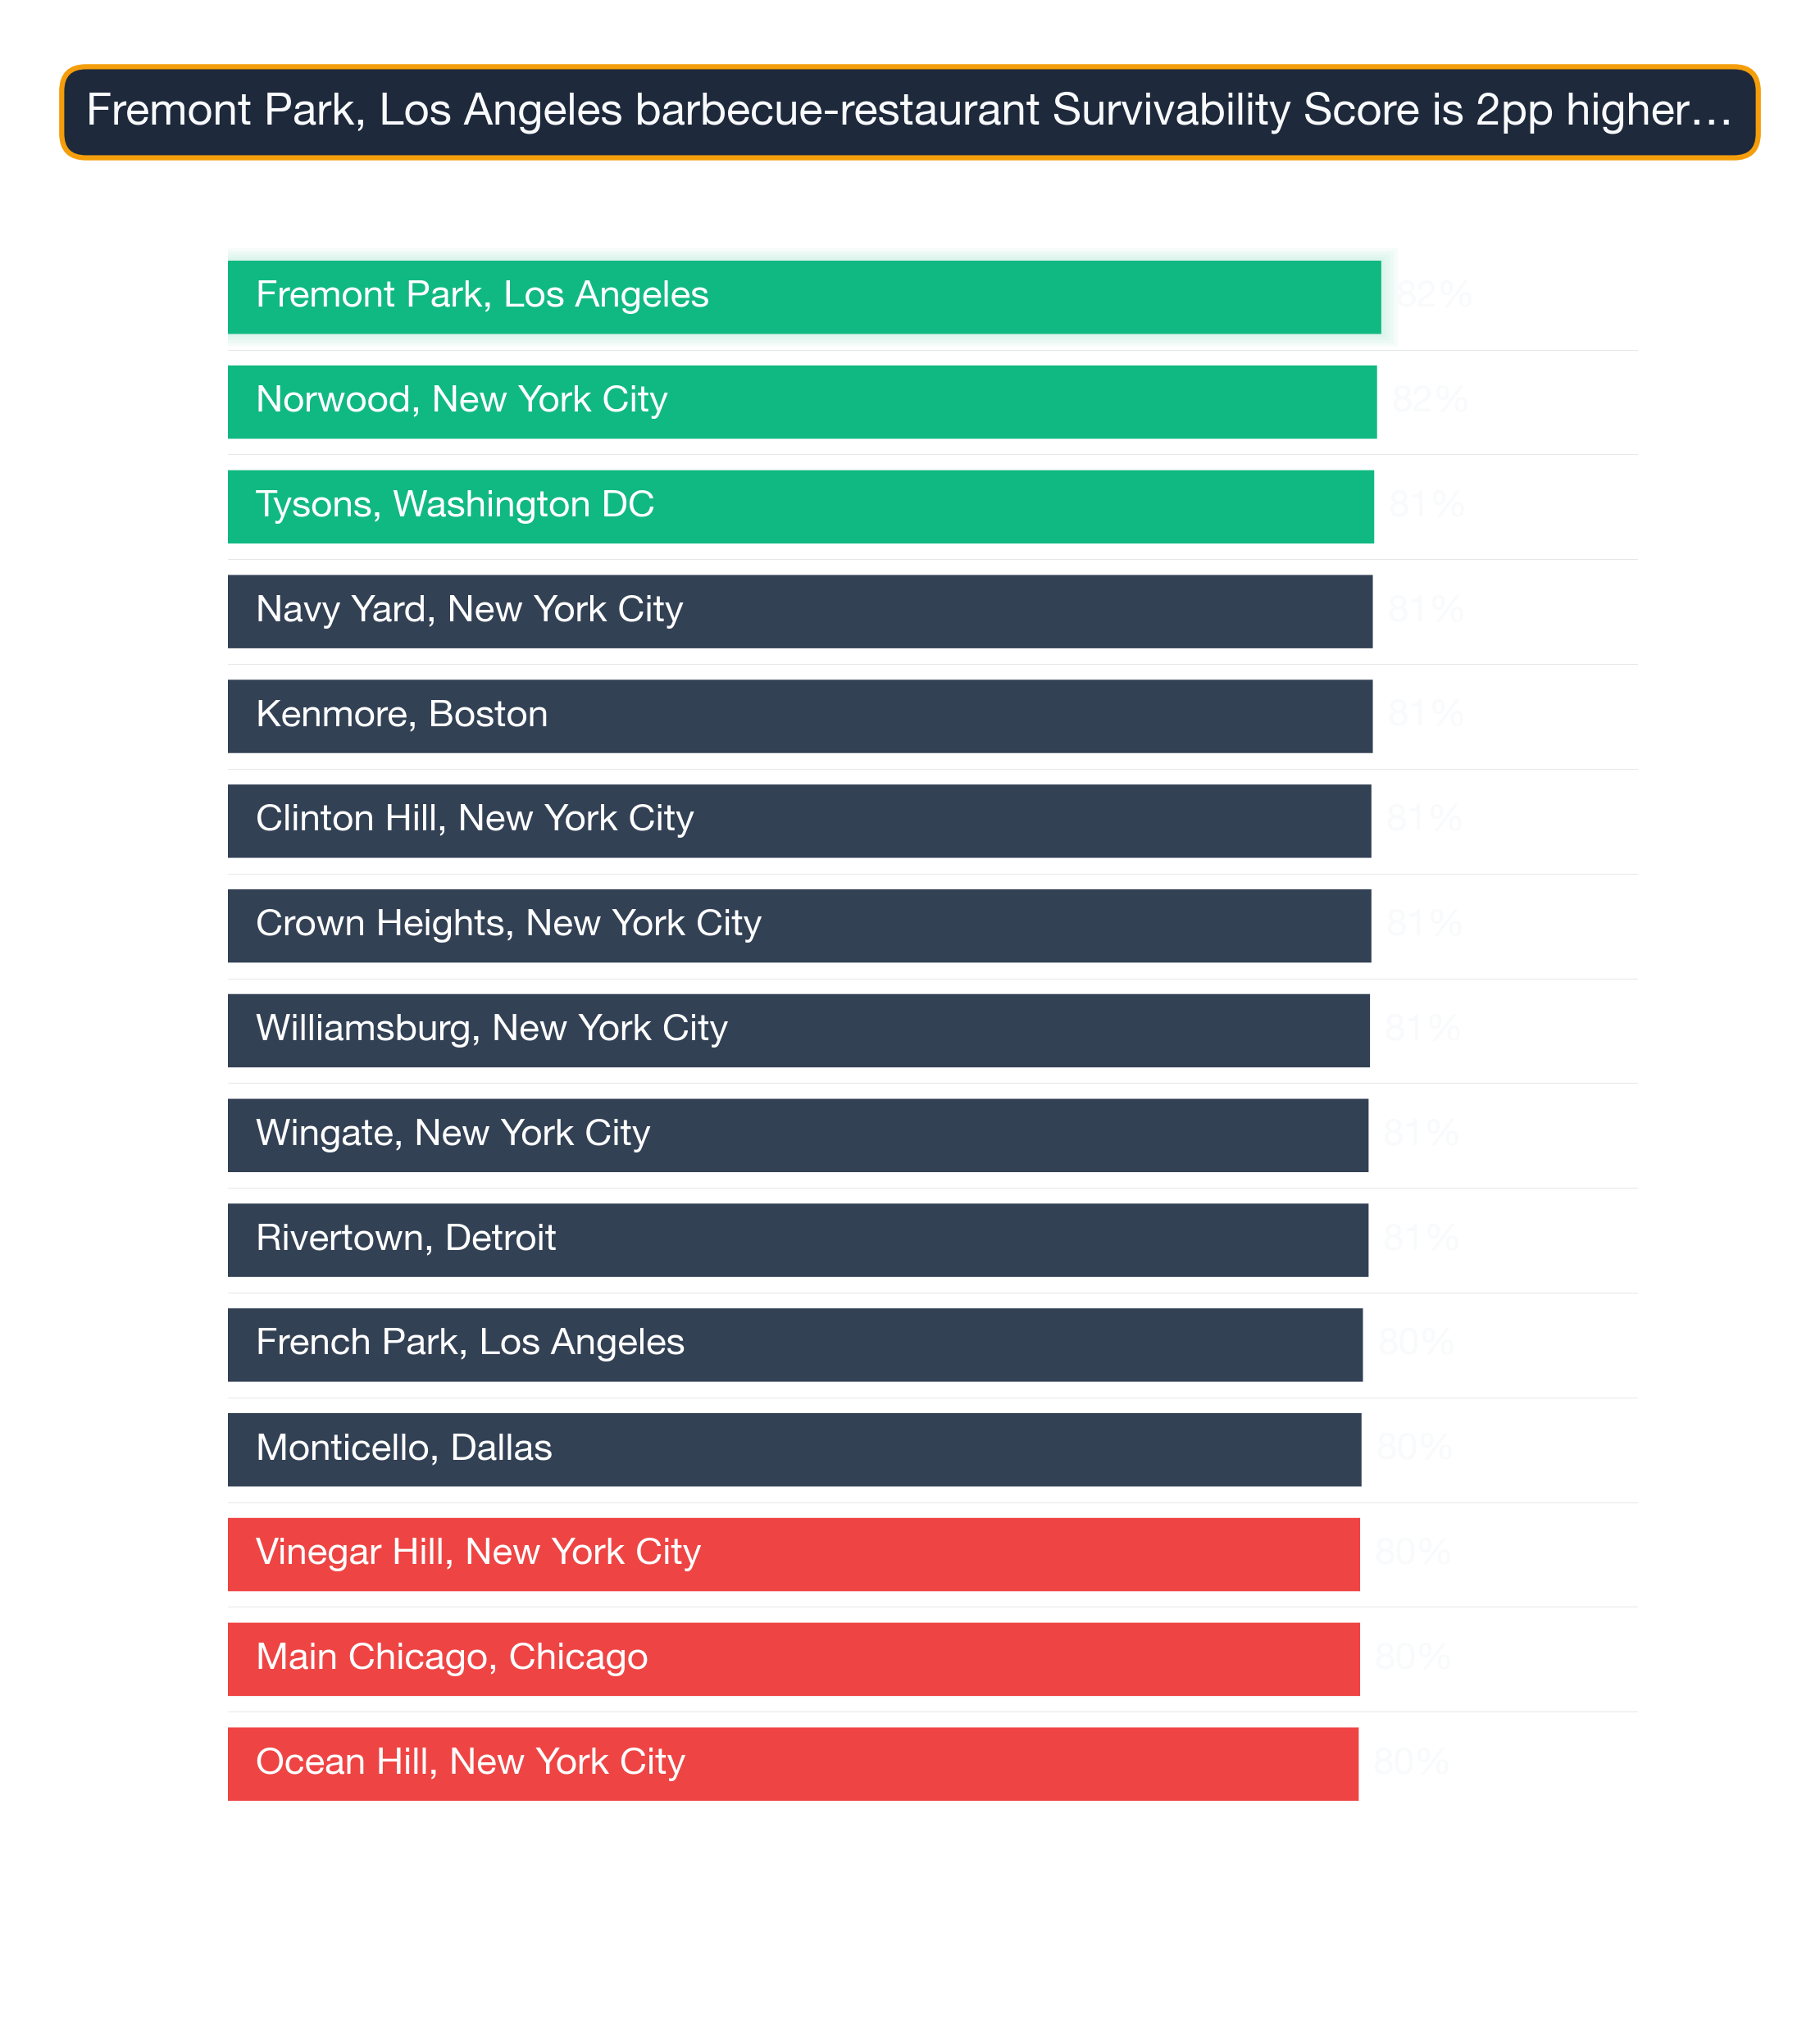
The top 25 neighborhoods nationwide for Barbecue Restaurants are:
| # | Neighborhood | City | Avg Survival | Tier | Best Locations | Challenging Locations |
|---|---|---|---|---|---|---|
| 1 | Fremont Park | Los Angeles | 81.8% | Great | 83.9% | 80.1% |
| 2 | Norwood | New York City | 81.5% | Great | 83.5% | 79.8% |
| 3 | Tysons | Washington DC | 81.3% | Great | 83.3% | 79.6% |
| 4 | Kenmore | Boston | 81.2% | Great | 83.3% | 79.5% |
| 5 | Navy Yard | New York City | 81.2% | Great | 83.2% | 79.5% |
| 6 | Clinton Hill | New York City | 81.1% | Great | 83.2% | 79.4% |
| 7 | Crown Heights | New York City | 81.1% | Great | 83.1% | 79.4% |
| 8 | Williamsburg | New York City | 81.0% | Great | 83.1% | 79.3% |
| 9 | Wingate | New York City | 80.9% | Great | 83.0% | 79.2% |
| 10 | Rivertown | Detroit | 80.9% | Great | 82.9% | 79.2% |
| 11 | French Park | Los Angeles | 80.5% | Great | 82.5% | 78.8% |
| 12 | Monticello | Dallas | 80.4% | Great | 82.4% | 78.7% |
| 13 | Vinegar Hill | New York City | 80.3% | Great | 82.4% | 78.6% |
| 14 | Main-Chicago | Chicago | 80.3% | Great | 82.3% | 78.6% |
| 15 | Ocean Hill | New York City | 80.2% | Great | 82.2% | 78.5% |
| 16 | Mariposa | Los Angeles | 80.1% | Great | 82.1% | 78.4% |
| 17 | Van Nest | New York City | 80.0% | Great | 82.1% | 78.4% |
| 18 | Pill Hill | San Francisco | 80.0% | Great | 82.0% | 78.3% |
| 19 | Vineyard | Los Angeles | 79.9% | Good | 81.9% | 78.2% |
| 20 | Russian Hill | San Francisco | 79.8% | Good | 81.9% | 78.1% |
| 21 | Brownsville | New York City | 79.8% | Good | 81.9% | 78.1% |
| 22 | Coney Island | New York City | 79.8% | Good | 81.8% | 78.1% |
| 23 | Bushwick | New York City | 79.8% | Good | 81.8% | 78.1% |
| 24 | DUMBO | New York City | 79.8% | Good | 81.8% | 78.1% |
| 25 | City Center | Los Angeles | 79.7% | Good | 81.8% | 78.0% |
That said, neighborhood averages don't tell the whole story — there are standout locations even in areas that may appear less suitable.
For a full explanation of how survivability scores and ranges are calculated, see Survivability Score: How We Calculate It & Why It Matters.
Common signals across top-performing neighborhoods
City Concentration
The top 25 neighborhoods span 8 different cities, with New York City claiming 13 of the top spots (52%).
Breakdown of top 25 neighborhoods by city:
- New York City: 13 neighborhoods (52% of top 25) — View city guide
- Los Angeles: 5 neighborhoods (20% of top 25) — View city guide
- San Francisco: 2 neighborhoods (8% of top 25) — View city guide
- Washington DC: 1 neighborhood (4% of top 25) — View city guide
- Boston: 1 neighborhood (4% of top 25) — View city guide
- Detroit: 1 neighborhood (4% of top 25) — View city guide
- Dallas: 1 neighborhood (4% of top 25) — View city guide
- Chicago: 1 neighborhood (4% of top 25) — View city guide
This distribution has practical implications for Barbecue Restaurants operators: cities with multiple neighborhoods in the top 25 offer more site options within a single market, reducing relocation or expansion cost. Cities with a single top-25 neighborhood require more precise site selection — the advantage is concentrated in one area rather than spread across the metro.
The income-and-density pattern
The concentration of 13 top-ranked neighborhoods in New York City (52% of the top 25) is notably high for this business category, suggesting that New York City's market conditions — competitive density, consumer spending patterns, and demographic alignment — are unusually favorable for Barbecue Restaurants. Operators targeting this category should treat New York City neighborhoods as a primary focus before expanding to secondary markets.
How to apply this ranking when choosing where to open a Barbecue Restaurant
While nationwide neighborhood rankings identify standout markets, address-level analysis reveals even greater variation. Powered by advanced AI, StreetSpring predicts how businesses will perform in neighborhoods across the country. Even within top-ranked neighborhoods, specific block selection can vary survivability by 10–20 percentage points.
For the most accurate assessment:
- Consider neighborhoods in the top 25 as strong starting points
- Examine city-specific guides for additional neighborhood options in your target markets
- Use StreetSpring's address-level tool to evaluate specific storefronts within these neighborhoods
- Factor in your budget, operational requirements, and target demographics
Each neighborhood has detailed analysis available through its city guide, providing block-by-block survivability data for Barbecue Restaurants.
From national rank to your shortlist
See also: Best Cities for Barbecue Restaurant — our city-level comparison ranks which metros offer the strongest overall conditions for Barbecue Restaurants.
Complementary Business Types Across Tiers
If you're evaluating a Barbecue Restaurant location, the same neighborhoods that score well for Barbecue Restaurants often score well for adjacent businesses. A few examples across the national distribution:
Fremont-Park, Los Angeles — ranked #1 nationally — the strongest neighborhood for Barbecue Restaurants (82% survivability for Barbecue Restaurant) Other business types that thrive in Fremont-Park:
- Portuguese Restaurant (85% survivability)
- Bangladeshi Restaurant (84% survivability)
- Eastern European Restaurant (84% survivability)
Sunrise-Key, Miami — ranked #714 of 1426 — a mid-ranked national neighborhood (67% survivability for Barbecue Restaurant) Other business types that thrive in Sunrise-Key:
- Convenience Store (84% survivability)
- Indonesian Restaurant (84% survivability)
- American Restaurant (84% survivability)
Keewaydin, Minneapolis — ranked #1426 of 1426 — among the lower-ranked national neighborhoods (41% survivability for Barbecue Restaurant) Other business types that thrive in Keewaydin:
- Kosher Restaurant (81% survivability)
- Italian Restaurant (80% survivability)
- Ukrainian Restaurant (80% survivability)
These cross-subtype patterns show up consistently — the strongest neighborhoods for Barbecue Restaurants aren't one-trick markets.
Visual Data
Related Resources
Explore top cities represented in these neighborhoods:
- Boston: Best businesses and neighborhoods
- Los Angeles: Best businesses and neighborhoods
- New York City: Best businesses and neighborhoods
- Dallas: Best businesses and neighborhoods
- Chicago: Best businesses and neighborhoods
National city rankings: Best cities for Barbecue Restaurants
Essential resources:
- How StreetSpring calculates Survivability Scores
- Site selection for landlords
- AI tools for tenant representatives
- StreetSpring vs competitors
Frequently Asked Questions
How can I compare specific addresses within these top neighborhoods?
StreetSpring's address-level tool allows you to input any commercial address and see predicted survivability for Barbecue Restaurants. Even within the top-ranked neighborhoods, survivability varies meaningfully by block — address-level scoring is the most precise way to evaluate a specific site.
How often do neighborhood rankings change?
StreetSpring updates rankings quarterly as new data on business openings, closures, and market conditions becomes available. The current analysis reflects 2026 data. Because competitive conditions shift as new businesses enter or exit a neighborhood, the specific rankings for any given business type can shift between updates — which is why we recommend verifying specific addresses in StreetSpring's live tool before making a final site selection decision.
Is the competitive environment for Barbecue Restaurants stronger in some markets than others?
Yes — competition density for Barbecue Restaurants varies significantly by market. In the top-ranked neighborhoods, StreetSpring's model identifies favorable competitive dynamics as a primary driver of high survivability scores. In more saturated markets, even strong consumer spending may not overcome competitive pressure. StreetSpring's address-level tool shows the exact competitive environment at any specific location.
Where can I download the underlying data?
The full national survivability dataset is available as a free download: https://streetspring.com/resources/data/national-survivability-scores-2026.csv. The CSV includes all business subtypes and neighborhoods covered in this analysis, licensed under CC BY 4.0.
Can a Barbecue Restaurant succeed in neighborhoods outside the top 25?
Yes — the top 25 neighborhoods represent standout conditions, but Barbecue Restaurants can achieve strong survivability in many other neighborhoods as well. What matters is finding a location where competitive density is low enough and consumer spending is strong enough to support the business. StreetSpring's address-level tool identifies high-survivability addresses in any neighborhood, including those not represented in this top-25 list.
How does the national ranking for Barbecue Restaurants compare to city-level rankings?
The national neighborhood ranking for Barbecue Restaurants identifies the strongest neighborhoods across all 24 analyzed metros. City-level rankings provide a more granular view of the best neighborhoods within a specific city. In cases where a city has multiple neighborhoods in the national top 25, the city-level guide shows the full ranking of all neighborhoods in that market — including those outside the national top 25 that may still offer strong site-specific opportunities.
What is the typical survivability range for Barbecue Restaurants in top neighborhoods?
The top 25 neighborhoods nationwide for Barbecue Restaurants average 80.5% survivability. The national average across all analyzed neighborhoods is 66.2%. The spread between top neighborhoods and the national average is 14.3% — representing the tangible survivability advantage of choosing a top-ranked location.
What demographic factors drive survivability for Barbecue Restaurants?
For Barbecue Restaurants, StreetSpring's model incorporates neighborhood-level demographic data including population density, median household income, employment rates, and consumer spending on this specific category. These factors vary by business type — the demographic profile that drives survivability for Barbecue Restaurant customers may differ significantly from what matters for other business categories.
Technical note: Aggregated national survivability rankings across all 24 metros are available in machine-readable format for research and integration purposes.
StreetSpring recalculates survivability using the latest competitive, demographic, and walkability data, so the live score may differ from the static ranges shown here.
Methodology: Neighborhood rankings are based on average Survivability Scores for Barbecue Restaurants across all analyzed locations within each neighborhood. Rankings represent neighborhood-level conditions but do not account for block-by-block variation. Coverage includes 1426 neighborhoods across 24 major US cities.