City Survivability Rankings for German Restaurant
StreetSpring's 2026 analysis ranks the top cities for German Restaurants across the US by Survivability Scores. See which cities offer the best chances for a German Restaurant to succeed.
Quick Summary
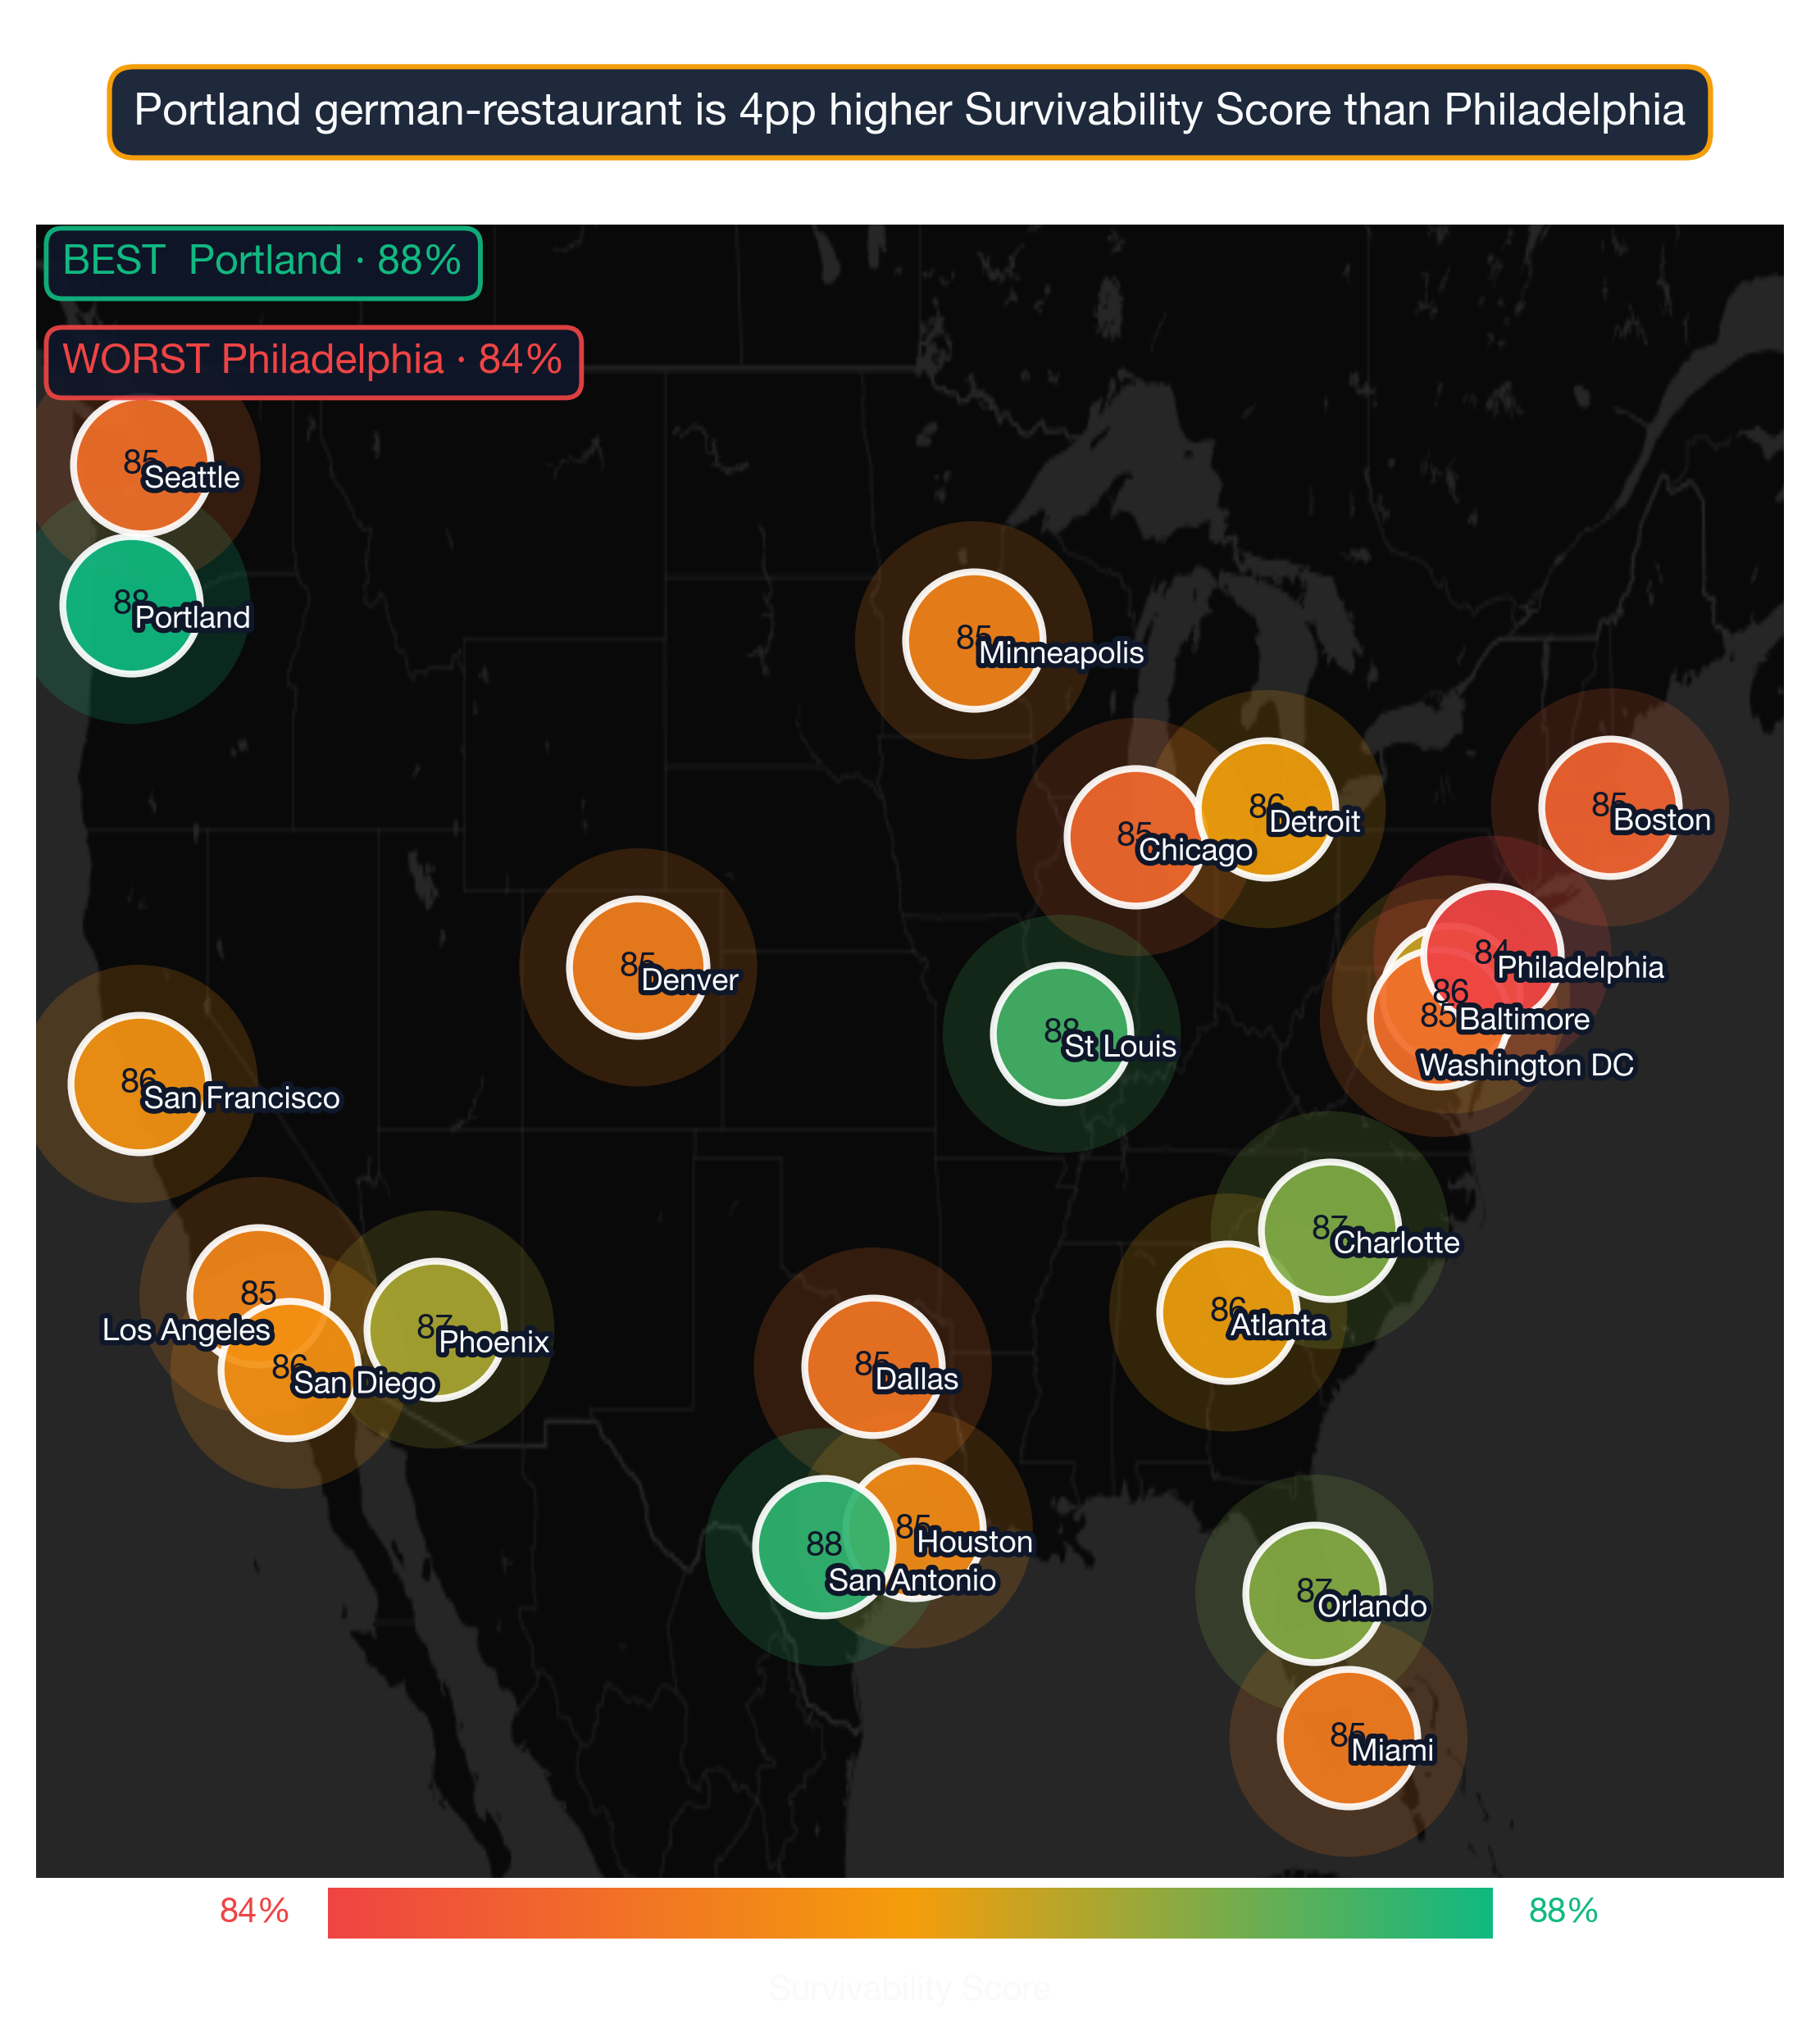
- The highest-survivability city for German Restaurant is Portland — 88% average survivability
- 24 of 24 analyzed US metros score above 70% for German Restaurant survivability
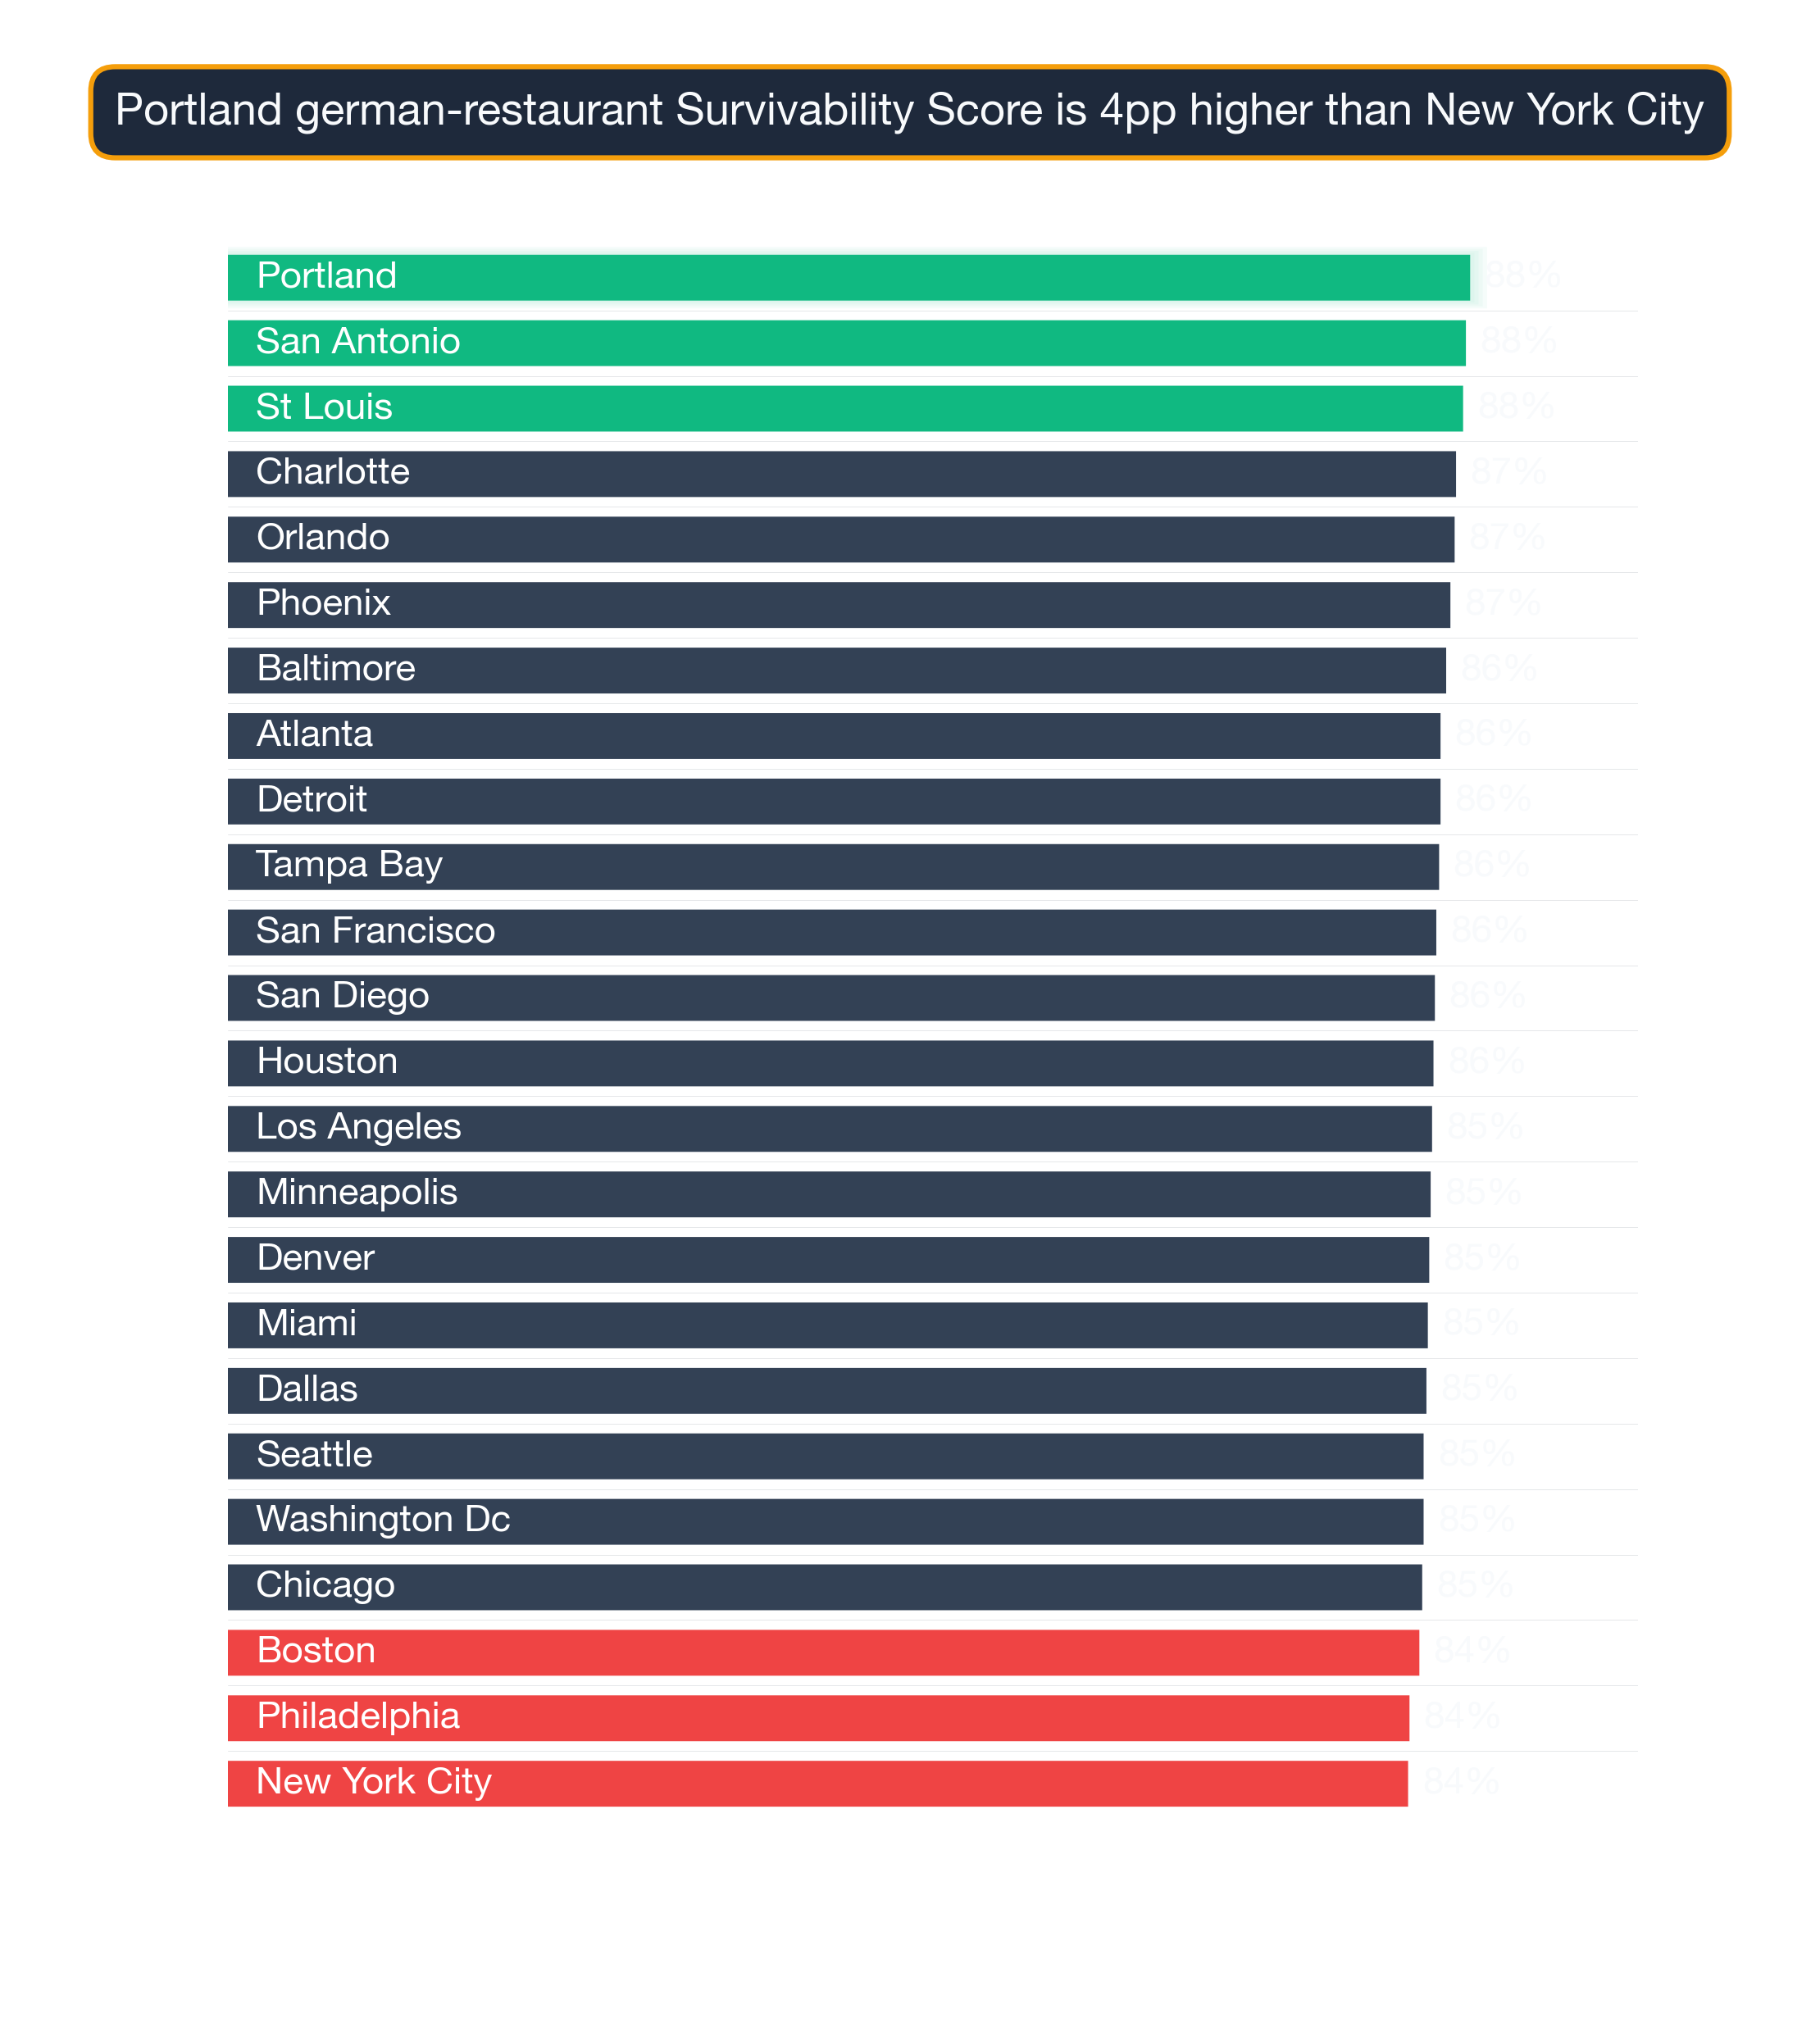
- The lowest-ranked city is New York City at 84%
- National average survivability score for German Restaurant: 85.7%
- Data reflects 2026 StreetSpring survivability analysis across 24 US metro areas · Full methodology →
Table of Contents
- Summary
- Top Cities for German Restaurants
- Key Insights
- What Makes These Cities Stand Out?
- Best Neighborhoods Across the Spectrum
- Related Resources
- How current is this ranking?
- Can a German Restaurant succeed in cities not ranked in the top 10?
- What tools can help me choose the right city for a German Restaurant?
- Which US city has the best survivability for German Restaurants?
Summary
According to StreetSpring's 2026 nationwide analysis, Portland ranks as the #1 city for opening a German Restaurant in the United States, with an average 88% chance of surviving more than 2 years. Following close behind are San Antonio with 88%, and St Louis with 88%. The 24-city analysis shows German Restaurants performing at a 85.7% national average, with strong geographic concentration of top scores in a handful of metros. Our data shows that strong individual locations exist in every city we analyze, regardless of the city's overall ranking. Pair these survivability scores with StreetSpring's live tool to get a real-time view before making a final decision.
Survivability ranges reflect best and worst storefront conditions within each city. See our full methodology →

German Restaurant city survivability rankings — Portland leads among 24 US metros at 88% in 2026
Ranked: 24 Cities by German Restaurant Survivability
Based on StreetSpring's analysis of 24 major metropolitan areas, these cities offer the strongest prospects for German Restaurants:
1. Portland Metro: Portland-Vancouver-Hillsboro, OR-WA
- Best locations: 92.1% – 97.0%
- Average locations: 84.7% – 89.2%
- Challenging locations: 59.0% – 79.4%
- Explore German Restaurant neighborhoods in Portland →
What "city rank" hides about block-level reality
2. San Antonio Metro: San Antonio-New Braunfels, TX
- Best locations: 92.0% – 97.0%
- Average locations: 84.4% – 88.9%
- Challenging locations: 59.0% – 79.2%
- Explore German Restaurant neighborhoods in San Antonio →
3. St Louis
- Best locations: 91.9% – 97.0%
- Average locations: 84.1% – 88.8%
- Challenging locations: 58.0% – 78.8%
- Explore German Restaurant neighborhoods in St Louis →
4. Charlotte Metro: Charlotte-Concord-Gastonia, NC-SC
- Best locations: 91.5% – 97.0%
- Average locations: 83.4% – 88.2%
- Challenging locations: 57.0% – 78.0%
- Explore German Restaurant neighborhoods in Charlotte →
5. Orlando Metro: Orlando-Kissimmee-Sanford, FL
- Best locations: 91.5% – 97.0%
- Average locations: 83.7% – 88.2%
- Challenging locations: 59.0% – 78.6%
- Explore German Restaurant neighborhoods in Orlando →
6. Phoenix Metro: Phoenix-Mesa-Chandler, AZ
- Best locations: 91.3% – 97.0%
- Average locations: 83.1% – 87.9%
- Challenging locations: 57.0% – 77.8%
- Explore German Restaurant neighborhoods in Phoenix →
7. Baltimore Metro: Baltimore-Columbia-Towson, MD
- Best locations: 91.2% – 97.0%
- Average locations: 83.6% – 87.7%
- Challenging locations: 63.0% – 79.4%
- Explore German Restaurant neighborhoods in Baltimore →
8. Atlanta Metro: Atlanta-Sandy Springs-Roswell, GA
- Best locations: 91.0% – 97.0%
- Average locations: 82.9% – 87.3%
- Challenging locations: 60.0% – 78.2%
- Explore German Restaurant neighborhoods in Atlanta →
9. Detroit Metro: Detroit-Warren-Dearborn, MI
- Best locations: 91.0% – 97.0%
- Average locations: 82.6% – 87.3%
- Challenging locations: 58.0% – 77.6%
- Explore German Restaurant neighborhoods in Detroit →
10. Tampa Bay Metro: Tampa-St. Petersburg-Clearwater, FL
- Best locations: 90.9% – 97.0%
- Average locations: 82.3% – 87.2%
- Challenging locations: 56.0% – 76.9%
- Explore German Restaurant neighborhoods in Tampa Bay →
11. San Francisco Metro: San Francisco-Oakland-Fremont, CA
- Best locations: 90.8% – 97.0%
- Average locations: 82.5% – 87.0%
- Challenging locations: 59.0% – 77.7%
- Explore German Restaurant neighborhoods in San Francisco →
12. San Diego Metro: San Diego-Chula Vista-Carlsbad, CA
- Best locations: 90.8% – 97.0%
- Average locations: 82.6% – 87.0%
- Challenging locations: 60.0% – 77.9%
- Explore German Restaurant neighborhoods in San Diego →
Why the same business does so differently city to city
13. Houston Metro: Houston-Pasadena-The Woodlands, TX
- Best locations: 90.7% – 97.0%
- Average locations: 82.2% – 86.9%
- Challenging locations: 58.0% – 77.2%
- Explore German Restaurant neighborhoods in Houston →
14. Los Angeles Metro: Los Angeles-Long Beach-Anaheim, CA
- Best locations: 90.6% – 97.0%
- Average locations: 81.6% – 86.8%
- Challenging locations: 54.0% – 76.0%
- Explore German Restaurant neighborhoods in Los Angeles →
15. Minneapolis Metro: Minneapolis-St. Paul-Bloomington, MN-WI
- Best locations: 90.6% – 97.0%
- Average locations: 82.3% – 86.7%
- Challenging locations: 60.0% – 77.7%
- Explore German Restaurant neighborhoods in Minneapolis →
16. Denver Metro: Denver-Aurora-Centennial, CO
- Best locations: 90.5% – 97.0%
- Average locations: 81.9% – 86.6%
- Challenging locations: 58.0% – 77.0%
- Explore German Restaurant neighborhoods in Denver →
17. Miami Metro: Miami-Fort Lauderdale-West Palm Beach, FL
- Best locations: 90.5% – 97.0%
- Average locations: 82.2% – 86.6%
- Challenging locations: 61.0% – 77.9%
- Explore German Restaurant neighborhoods in Miami →
18. Dallas Metro: Dallas-Fort Worth-Arlington, TX
- Best locations: 89.9% – 96.0%
- Average locations: 82.6% – 86.3%
- Challenging locations: 65.0% – 79.0%
- Explore German Restaurant neighborhoods in Dallas →
19. Seattle Metro: Seattle-Tacoma-Bellevue, WA
- Best locations: 90.3% – 97.0%
- Average locations: 81.5% – 86.3%
- Challenging locations: 57.0% – 76.5%
- Explore German Restaurant neighborhoods in Seattle →
20. Washington DC Metro: Washington-Arlington-Alexandria, DC-VA-MD-WV
- Best locations: 90.3% – 97.0%
- Average locations: 81.7% – 86.2%
- Challenging locations: 59.0% – 77.0%
- Explore German Restaurant neighborhoods in Washington DC →
21. Chicago Metro: Chicago-Naperville-Elgin, IL-IN
- Best locations: 90.2% – 97.0%
- Average locations: 81.5% – 86.1%
- Challenging locations: 58.0% – 76.7%
- Explore German Restaurant neighborhoods in Chicago →
22. Boston Metro: Boston-Cambridge-Newton, MA-NH
- Best locations: 90.1% – 97.0%
- Average locations: 81.7% – 86.0%
- Challenging locations: 61.0% – 77.5%
- Explore German Restaurant neighborhoods in Boston →
23. Philadelphia Metro: Philadelphia-Camden-Wilmington, PA-NJ-DE-MD
- Best locations: 89.7% – 97.0%
- Average locations: 80.5% – 85.3%
- Challenging locations: 57.0% – 75.7%
- Explore German Restaurant neighborhoods in Philadelphia →
24. New York City Metro: New York-Newark-Jersey City, NY-NJ
- Best locations: 89.7% – 97.0%
- Average locations: 80.5% – 85.3%
- Challenging locations: 57.0% – 75.7%
- Explore German Restaurant neighborhoods in New York City →
What Stands Out in the Numbers
| Comparison factor | Top-tier city pattern | Bottom-tier city pattern |
|---|---|---|
| Market size vs saturation | Mid-sized metros with established demand but room for new entrants — under-served pockets in 1.5M–5M population markets. | Either tier-1 cities saturated with national chains, or thin markets under 500K population where demand can't sustain a category. |
| Climate-driven seasonality | Cities where the subtype's peak season aligns with the local climate calendar (e.g., year-round outdoor dining in mild markets). | Cities with extreme seasonality that compresses revenue into 4–6 month windows. |
| Income distribution shape | Cities with a broad middle-class income band that supports the subtype's price tier. | Cities with bifurcated income distributions where the subtype's price point falls into the middle gap. |
Wide variation between cities: The difference between the #1 city (Portland at 88.1%) and the #24 city (New York City at 83.7%) is 4.5 percentage points. The 0.3 percentage-point spread at the top signals that German Restaurants performance is highly sensitive to city-level factors — competition density and local spending both play significant roles.
Three findings worth pulling out of the data
Strong performers: 24 cities show Survivability Scores above 80%, indicating highly favorable conditions for German Restaurants.
National average: Across all 24 analyzed cities, the average survivability for a German Restaurant is 85.7%.
Why Top-Ranked Cities Outperform
The top-ranked cities share several characteristics that favor German Restaurants:
- Strong survivability signals: Portland leads with a 88% average survivability score for German Restaurants — significantly above the national average for this business category.
- Competition density: The top cities show favorable competitor-to-opportunity ratios for German Restaurants, meaning lower saturation and higher odds of capturing an underserved customer base.
- Geographic distribution: The top cities span multiple U.S. regions, giving franchise operators or multi-location owners diverse market options without concentrating risk.
- Regulatory environment: Top-ranked cities tend to have streamlined commercial permitting and lower business tax burdens relative to their metro size, reducing friction for new operators.
Powered by advanced AI, StreetSpring predicts how businesses will perform in neighborhoods across the country. We apply advanced machine learning to massive commercial real estate datasets to build accurate models. Our proprietary models incorporate data sources not available through any public platform.
Standout Neighborhoods From Top to Bottom
City-level averages mask significant within-city variation. Below are some of the strongest neighborhoods for German Restaurant at different points in the rankings:
Portland — ranked #1 nationally — the strongest market for German Restaurants
- Kenton (89% survivability)
- Vernon (87% survivability)
- Ogden (87% survivability)
- Sabin (87% survivability)
- Concordia (86% survivability)
See full neighborhood rankings for Portland →
Houston — ranked #13 of 24 — a middle-of-the-pack national market
- Pleasantville-Area (89% survivability)
- South-Main (88% survivability)
- East-Little-York-Homestead (88% survivability)
- Carverdale (87% survivability)
- Second-Ward (86% survivability)
See full neighborhood rankings for Houston →
New York City — ranked #24 of 24 — among the lower-ranked national markets
- Rockaway-Park (89% survivability)
- Coney-Island (86% survivability)
- Newark (86% survivability)
- Brighton-Beach (86% survivability)
- Lincoln-Park (84% survivability)
See full neighborhood rankings for New York City →
City-level scores aggregate hundreds of neighborhoods. The right neighborhood matters more than the city's headline rank.
Visual Data
Related Resources
City-specific guides: For detailed neighborhood-level analysis, explore our city guides:
- Survivability Rankings for German Restaurant in Portland
- Business Survivability Rankings: Portland
- Survivability Rankings for German Restaurant in San Antonio
- Business Survivability Rankings: San Antonio
- Survivability Rankings for German Restaurant in St Louis
- Business Survivability Rankings: St Louis
- Survivability Rankings for German Restaurant in Charlotte
- Business Survivability Rankings: Charlotte
- Survivability Rankings for German Restaurant in Orlando
- Business Survivability Rankings: Orlando
National guides:
- National Neighborhood Survivability Rankings for German Restaurants
- Neighborhood Survivability Rankings: Portland
How current is this ranking?
Rankings are updated quarterly. The current data reflects StreetSpring's 2026 analysis, with the next full dataset refresh scheduled for Q3 2026. As market conditions shift across major metros, individual city scores can move meaningfully between updates — particularly for German Restaurants, where local competition density and consumer spending patterns respond quickly to new entrants and neighborhood change. For the most current score at any specific address, use StreetSpring's live survivability tool rather than the static ranking above.
Should a German Restaurant avoid cities ranked below the top 10?
Yes — our top 10 ranking reflects cities with the strongest average conditions, but lower-ranked metros can still contain exceptional individual neighborhoods. Many operators successfully open German Restaurants in cities that don't appear in our top 10. German Restaurants in particular can find strong performance in secondary markets where the right demographic concentration, household income, and limited direct competition within walking distance align — even outside our highest-ranked cities. StreetSpring's neighborhood-level data surfaces these pockets of opportunity in every city we analyze, regardless of where the city as a whole ranks nationally.
Which tools rank cities for a German Restaurant survivability?
StreetSpring's Survivability Score tool provides address-level predictions for German Restaurants across all 24 metros we track. For this category specifically, the tool surfaces competition density, consumer spending index for German Restaurants, and commercial vacancy rates — the factors that most consistently predict whether a German Restaurant will still be operating after two years. You can check any specific address before signing a lease and compare multiple neighborhoods side by side to identify the highest-survivability site within your target city.
Try the Survivability Score tool →
Which city ranks first for German Restaurants?
Portland ranks as the #1 city in the US for German Restaurants survivability in StreetSpring's 2026 analysis, with an average score of 88%. This means that across well-selected neighborhoods in Portland, a German Restaurant has approximately a 88% chance of still operating after two years — above the national average for this category. San Antonio ranks second, followed by St Louis. The full ranking reflects data across 24 major US metro areas — see the complete list above for all scores and neighborhood-level links.
Last reviewed by Bobby Koons, Founder & CEO, StreetSpring — May 4, 2026
Technical note: Aggregated national survivability rankings across all 24 metros are available in machine-readable format for research and integration purposes.
StreetSpring recalculates survivability using the latest competitive, demographic, and walkability data, so the live score may differ from the static ranges shown here.
Methodology: City rankings aggregate neighborhood-level Survivability Scores (max, average, and min) across all analyzed neighborhoods in each metro area. Rankings reflect average conditions but do not account for variation within cities. Coverage includes 24 major US metropolitan areas: Portland, San Antonio, St Louis, Charlotte, Orlando, Phoenix, Baltimore, Atlanta, Detroit, Tampa Bay, San Francisco, San Diego, Houston, Los Angeles, Minneapolis, Denver, Miami, Dallas, Seattle, Washington DC, Chicago, Boston, Philadelphia, New York City.