Survivability Rankings for Coffee Shop in Boston
StreetSpring's 2026 analysis ranks the best and worst neighborhoods in Boston to open a Coffee Shop, from Teele Square (79% survival) to Norwood (64%).
By Bobby Koons | Last updated: April 29, 2026 | Weekly methodology review | Methodology
Quick Summary
- #1 Neighborhood: Teele Square — 79% average survivability for Coffee Shop
- Neighborhoods at or above 70%: 61 of 88 analyzed
- City-wide average: 72% for Coffee Shops
- Most challenging area: Norwood at 64%
- Revenue advantage (top vs. avg location): ~9.6% more expected revenue in Teele Square
- Data freshness: 2026 data · Full methodology →
Table of Contents
- Summary
- 10 Best Neighborhoods
- Where Would a Coffee Shop Make the Most Money?
- What Should I Consider?
- Where Should I Start?
- FAQ: Best Neighborhoods
- FAQ: Can a Coffee Shop Succeed in Lower-Ranked Areas?
- FAQ: How Often Are Rankings Updated?
- FAQ: Is a Coffee Shop a Good Tenant?
- Landlord Survivability Data
- Best Neighborhoods for Any Business
Summary
StreetSpring's 2026 analysis shows the best neighborhood in and around Boston to open a Coffee Shop is Teele Square with 79% average chance of surviving more than 2 years, with the best locations offering 84% and the most challenging locations in Teele Square at 69%. The worst neighborhoods include Norwood with 64% average chance. Remember that a neighborhood average smooths over wide variation — your exact block could significantly outperform.
Where in Boston Should You Open a Coffee Shop?
Teele Square ranks #1 of 88 neighborhoods analyzed in and around Boston for Coffee Shop survivability with a score of 79% as of 2026. The top 10 neighborhoods are:
Why these rankings reflect real survival outcomes
| Rank | Neighborhood | Best Locations | Average Locations | Challenging Locations |
|---|---|---|---|---|
| 1 | Teele Square | 81.0% – 85.0% | 77.1% – 81.2% | 68.0% – 72.0% |
| 2 | Ball Square | 79.0% – 83.0% | 76.6% – 80.6% | 70.0% – 74.0% |
| 3 | East Cambridge | 79.0% – 83.0% | 76.2% – 80.2% | 73.0% – 77.0% |
| 4 | Beacon Hill | 77.0% – 81.0% | 76.2% – 80.2% | 75.0% – 79.0% |
| 5 | Downtown Crossing | 77.0% – 81.0% | 75.7% – 79.8% | 73.0% – 77.0% |
| 6 | Haymarket | 78.0% – 82.0% | 75.6% – 79.7% | 74.0% – 78.0% |
| 7 | Ten Hills | 81.0% – 85.0% | 75.5% – 79.6% | 65.0% – 69.0% |
| 8 | Downtown | 78.0% – 82.0% | 75.4% – 79.5% | 68.0% – 72.0% |
| 9 | South End | 79.0% – 83.0% | 75.3% – 79.3% | 65.0% – 69.0% |
| 10 | Mid-Cambridge | 78.0% – 82.0% | 75.1% – 79.2% | 71.0% – 75.0% |
Notable runners-up worth a second look
For the most current predictions, visit StreetSpring to analyze your specific location in real-time. Because local conditions evolve weekly, the live survivability tool offers a more current snapshot than any published ranking.
Survivability ranges reflect best and worst storefront conditions within each neighborhood. See our full methodology →
Try StreetSpring to see if this location is still the best and see if there are locations to rent in this area right now.
Where Coffee Shops Earn the Most in Boston
In Teele Square, the best possible location offers the opportunity of making ~9.6% more than the average location in or around Boston.
On the other hand, in Norwood, the worst possible location could result in making ~11.2% less than the average location in the city.
Where you open matters more than anything else. Opening a Coffee Shop in Boston requires careful location choice. Across 88 neighborhoods analyzed, the overall average survival chance for a new Coffee Shop is 72% for lasting more than 2 years — due to a combination of many factors across competition, consumer spending, and location dynamics. Consumer spending patterns differ dramatically across business types and micro-locations.
What Matters Most When Opening a Coffee Shop in Boston
The strongest predictor of whether this business survives two years is the quality of the location you pick — Survivability Score quantifies exactly that. Revenue Capture Score is the single best indicator of whether a business will thrive at a location. StreetSpring computes this by projecting the business's market share, which is based on the quality and quantity of primary, secondary, and tertiary competitors. Our models are built using machine learning trained on millions of commercial real estate data points. Areas with complementary competitors tend to generate higher overall foot traffic. Every score is produced by our in-house models, continuously refined against real-world business outcomes.
| Consideration | Common pitfall | What to verify before signing |
|---|---|---|
| Workforce availability | Hiring radius is smaller than you think — many neighborhoods can't staff a full team at standard wages. | Pull BLS wage data for your industry in this metro. Walk through your staffing plan with a local restaurant/retail operator before signing. |
| Permitted hours | Late-night or early-morning ops blocked by zoning, neighborhood association, or shared-wall restrictions. | Confirm the permitted hours-of-operation are in your lease AND in the local code. Pull recent variances or complaints from the zoning portal. |
| Outdoor seating / sidewalk use | Signing assuming you can add patio seating, then learning the city requires a separate sidewalk-cafe permit with long lead times. | Check the city's sidewalk-cafe permit process up front. Confirm landlord allows outdoor build-out in the lease language. |
This can be summarized as:
Revenue Capture Score = Projected Market Share × Forecasted Spend on Specific Business
Related: Survivability Score: How We Calculate It & Why It Matters
StreetSpring recalculates survivability using the latest competitive, demographic, and walkability data. Static rankings provide a useful baseline, but the live tool captures changes that have occurred since publication.
Pinpointing the Right Neighborhood for a Coffee Shop in Boston
For this business type, the highest-ranked neighborhoods are Teele Square, Ball Square, and East Cambridge, while the most challenging neighborhoods would be Norwood, Medfield, and Brockton. Neighborhood averages mask significant block-by-block variation — always check your specific address. New competitor openings and closures happen weekly — the live tool ensures you see the latest picture.
Related Articles:
- Business Survivability Rankings: Boston
- Neighborhood Survivability Rankings: Boston
- National City Survivability: Coffee Shop
Which Boston Neighborhoods Are Strongest for Coffee Shops?
Based on StreetSpring's 2026 analysis, the top neighborhood for a Coffee Shop in Boston is Teele Square with 79% average survivability, followed by Ball Square and East Cambridge. 61 of 88 neighborhoods analyzed exceed 70% two-year survival.
Market dynamics shift frequently; validate these insights with real-time data from StreetSpring.
Do Lower-Ranked Boston Neighborhoods Still Work for Coffee Shops?
Yes — neighborhood averages mask significant block-by-block variation. Even in neighborhoods ranked outside the top 10, individual storefronts with strong foot traffic, low direct competition, and favorable lease terms can outperform the area average. StreetSpring's Survivability Scores are updated regularly, so the most accurate prediction for your exact storefront is always available in the live tool. Always check your specific address in StreetSpring's live platform for the most accurate prediction.
Refresh Cadence for Boston Coffee Shop Survivability Rankings
StreetSpring recalculates survivability scores regularly using the latest competitive, demographic, and walkability data. Rankings are updated quarterly; the live tool always reflects the most current predictions for any address in Boston.
The Landlord's View of Coffee Shops in Boston
In Teele Square, StreetSpring forecasts a 77.1% – 81.2% average chance for a new Coffee Shop to survive more than 2 years, depending on the exact storefront. Check the current Survivability Score for any address instantly.
Landlord Survivability Data for Coffee Shop in Boston
For landlords evaluating tenant applications, StreetSpring's data provides a clear comparison across the top neighborhoods. In Teele Square, a Coffee Shop has a 77.1% – 81.2% average chance of surviving more than 2 years. In Ball Square, the range shifts to 76.6% – 80.6%, and in East Cambridge, it is 76.2% – 80.2%. Get a live Survivability Score for your specific storefront at no cost.
Our tool delivers pinpoint accuracy down to the exact storefront location for any business category.
Related: How Landlord Representatives Can Reduce Vacancy & Increase Tenant Longevity
Top-Survivability Boston Neighborhoods for Coffee Shops
You can see the best neighborhoods in or around Boston to open any type of business in our article Neighborhood Survivability Rankings: Boston.
Technical note: Aggregated survivability rankings for Boston are available in machine-readable format for research and integration purposes.
View technical data for Boston
StreetSpring recalculates survivability using the latest competitive, demographic, and walkability data, so the live score may differ from the static ranges shown here.
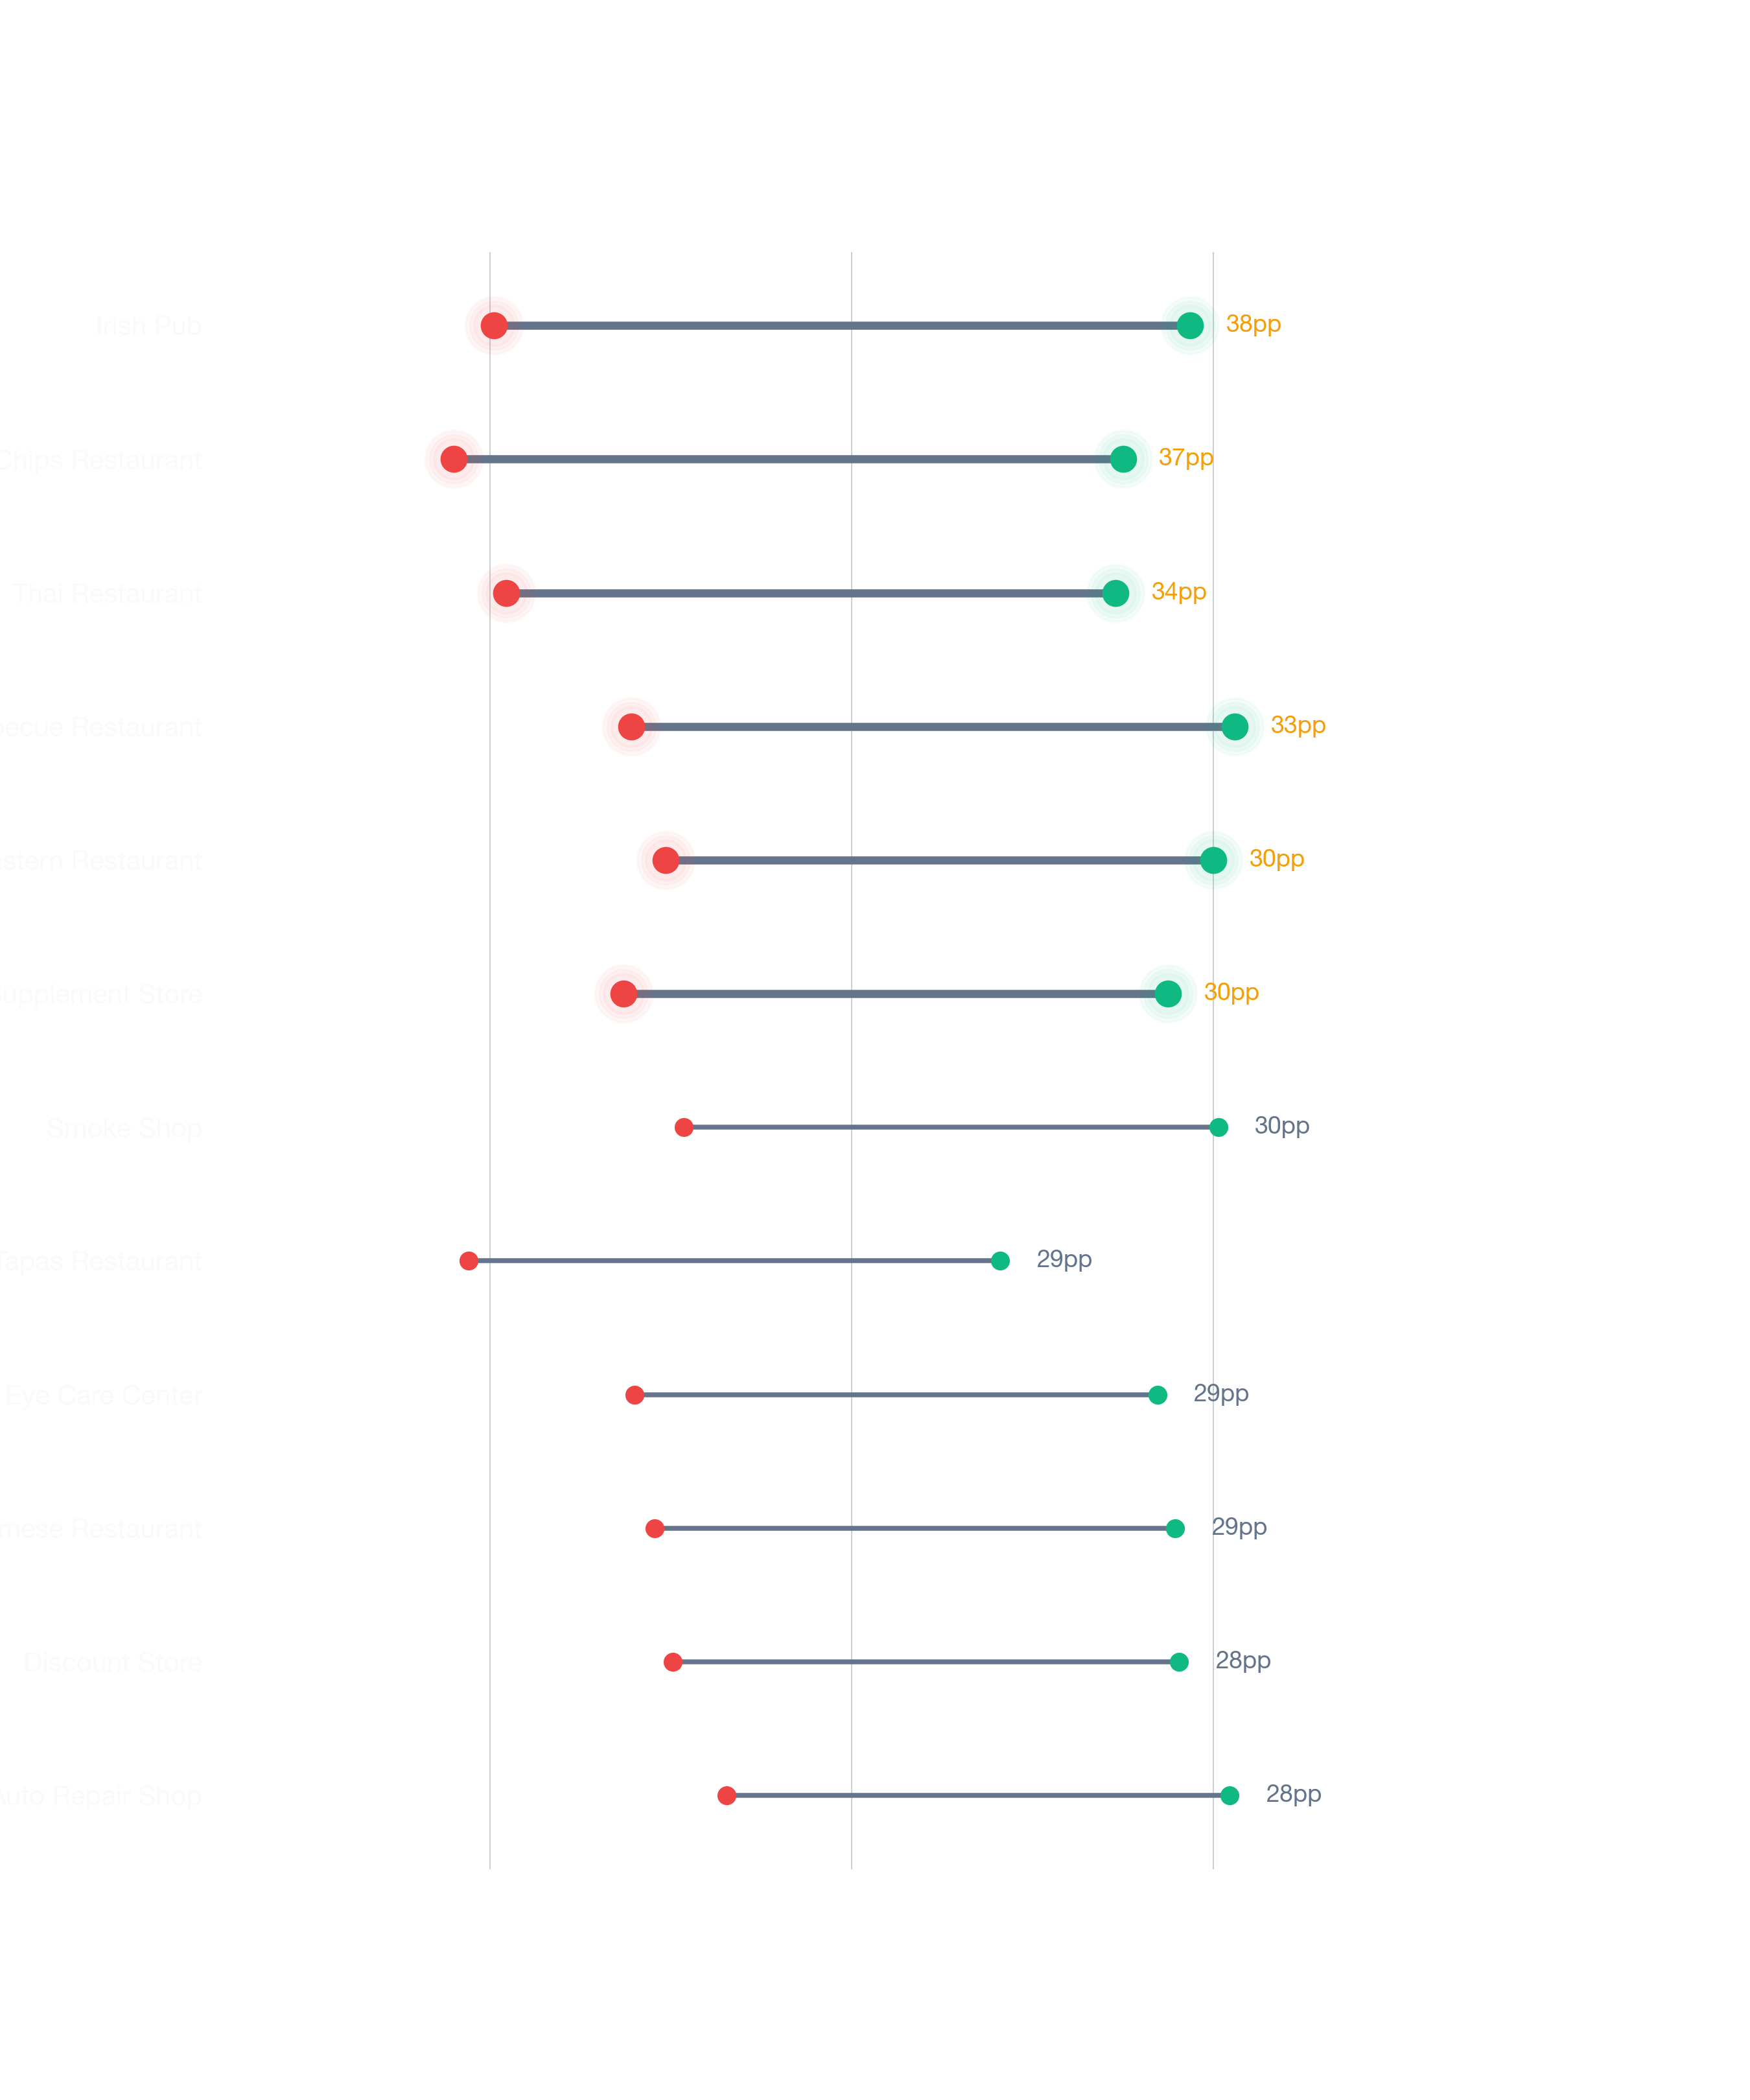
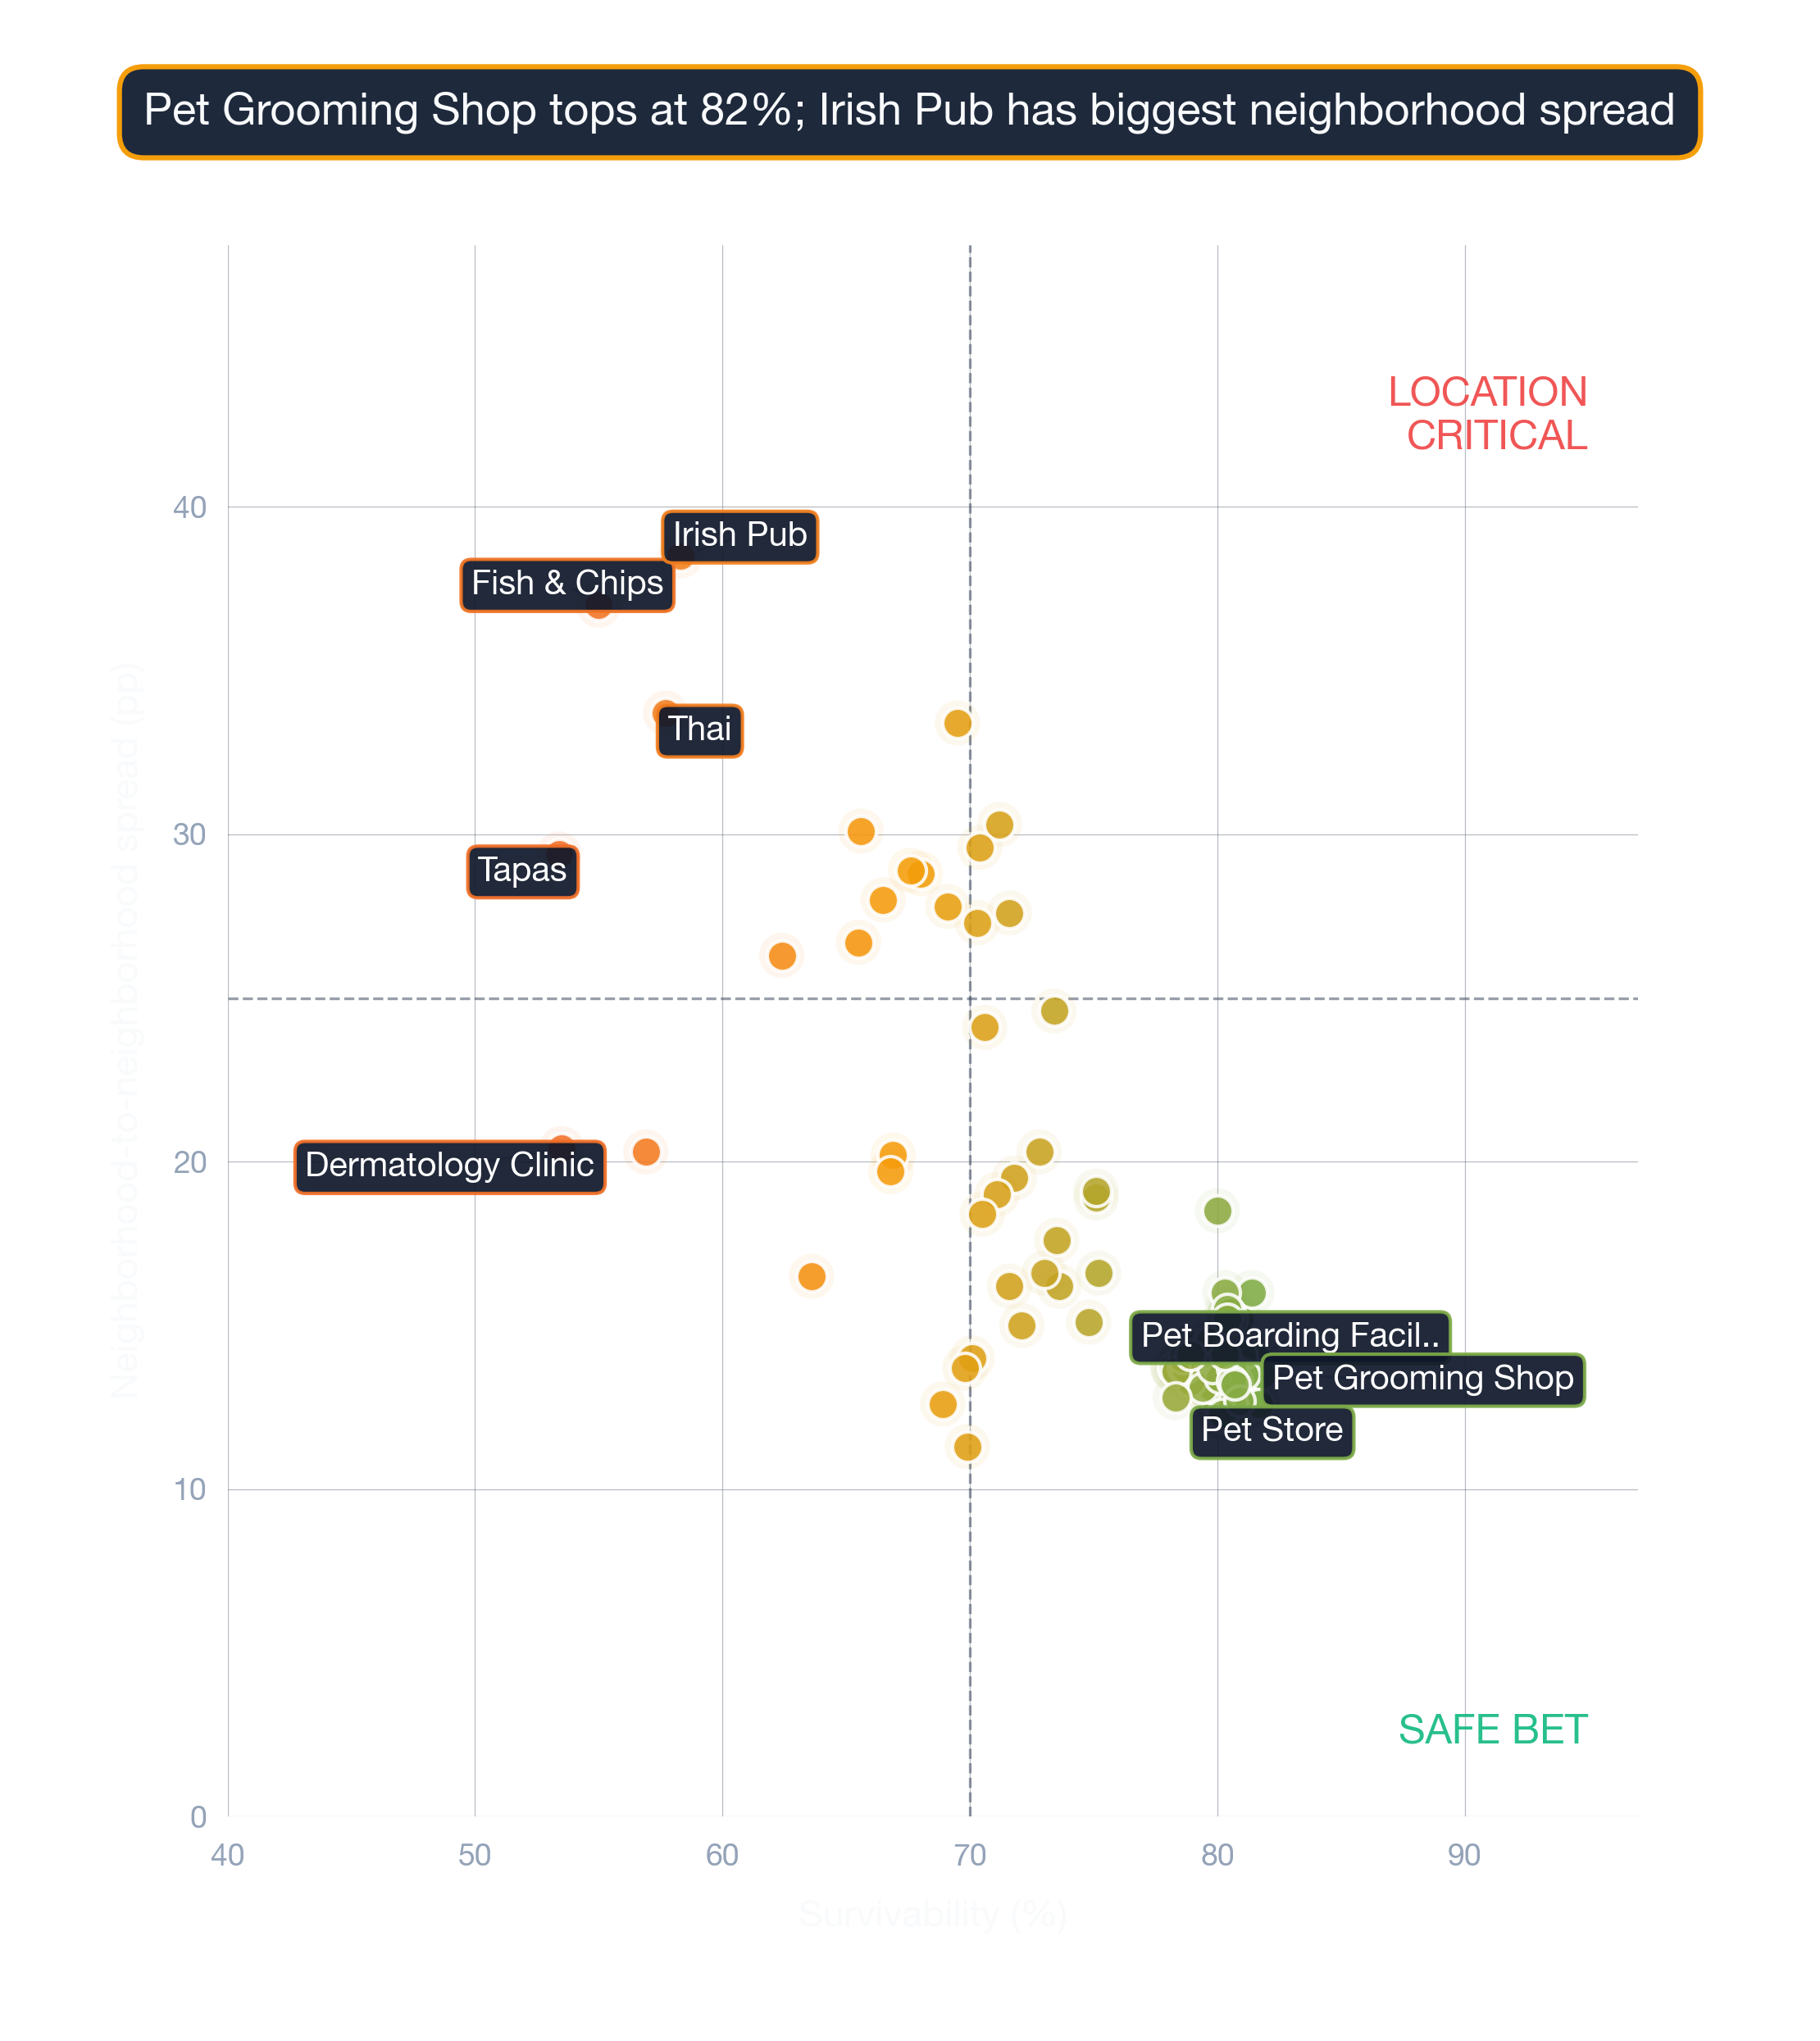
Visual Data
Related Resources
Same business type in other cities:
- City Survivability Rankings for Coffee Shop
- Survivability Rankings for Coffee Shop in Atlanta
- National Neighborhood Survivability Rankings for Coffee Shop
Related:
More Questions About This Location
More questions answered with neighborhood-specific data from our 2026 corpus.
How comprehensive is the Coffee Shops data for Boston?
StreetSpring's Boston model covers Coffee Shops across all tracked neighborhoods — the average score is 70%, with neighborhood-level scores spanning 43-92%. Real-time scores at the address level capture finer variation than these neighborhood averages.
What are the top metros nationally for opening a Coffee Shop?
The three highest-scoring metros for Coffee Shops are Dallas, Miami, Orlando (StreetSpring 2026 corpus). Boston sits at #17 with a 70% average survivability score.
Is Boston a top-ranked city for a Coffee Shop?
Boston ranks #17 of 24 US metros StreetSpring tracks for Coffee Shops survivability (average 70%). The top metro for this subtype scores 75%; the bottom scores 69%.
What factors drive the Boston Coffee Shops score?
Each Coffee Shops survivability score in Boston (averaging 70%) reflects ~100 factors per address: competitor counts at multiple radii, demographics, accessibility, rent, and historical outcomes. The model is recalibrated quarterly against 500K+ business outcomes nationally.
What's the gap between the best and worst Boston locations for a Coffee Shop?
Across Boston, StreetSpring's survivability score for Coffee Shops ranges from 43% at the most challenging locations to 92% at the best — a 49-percentage-point gap that location selection alone can capture.