Survivability Rankings for Chinese Restaurant in Boston
StreetSpring's 2026 analysis ranks the best and worst neighborhoods in Boston to open a Chinese Restaurant, from Haverhill (88% survival) to West Roxbur...
By Bobby Koons | Last updated: April 24, 2026 | Weekly methodology review | Methodology
Quick Summary
- #1 Neighborhood: Haverhill — 88% average survivability for Chinese Restaurant
- Neighborhoods at or above 70%: 88 of 88 analyzed
- City-wide average: 79% for Chinese Restaurants
- Most challenging area: West Roxbury at 74%
- Revenue advantage (top vs. avg location): ~10.2% more expected revenue in Haverhill
- Data freshness: 2026 data · Full methodology →
Table of Contents
- Summary
- 10 Best Neighborhoods
- Where Would a Chinese Restaurant Make the Most Money?
- What Should I Consider?
- Where Should I Start?
- FAQ: Best Neighborhoods
- FAQ: Can a Chinese Restaurant Succeed in Lower-Ranked Areas?
- FAQ: How Often Are Rankings Updated?
- FAQ: Is a Chinese Restaurant a Good Tenant?
- Landlord Survivability Data
- Best Neighborhoods for Any Business
Summary
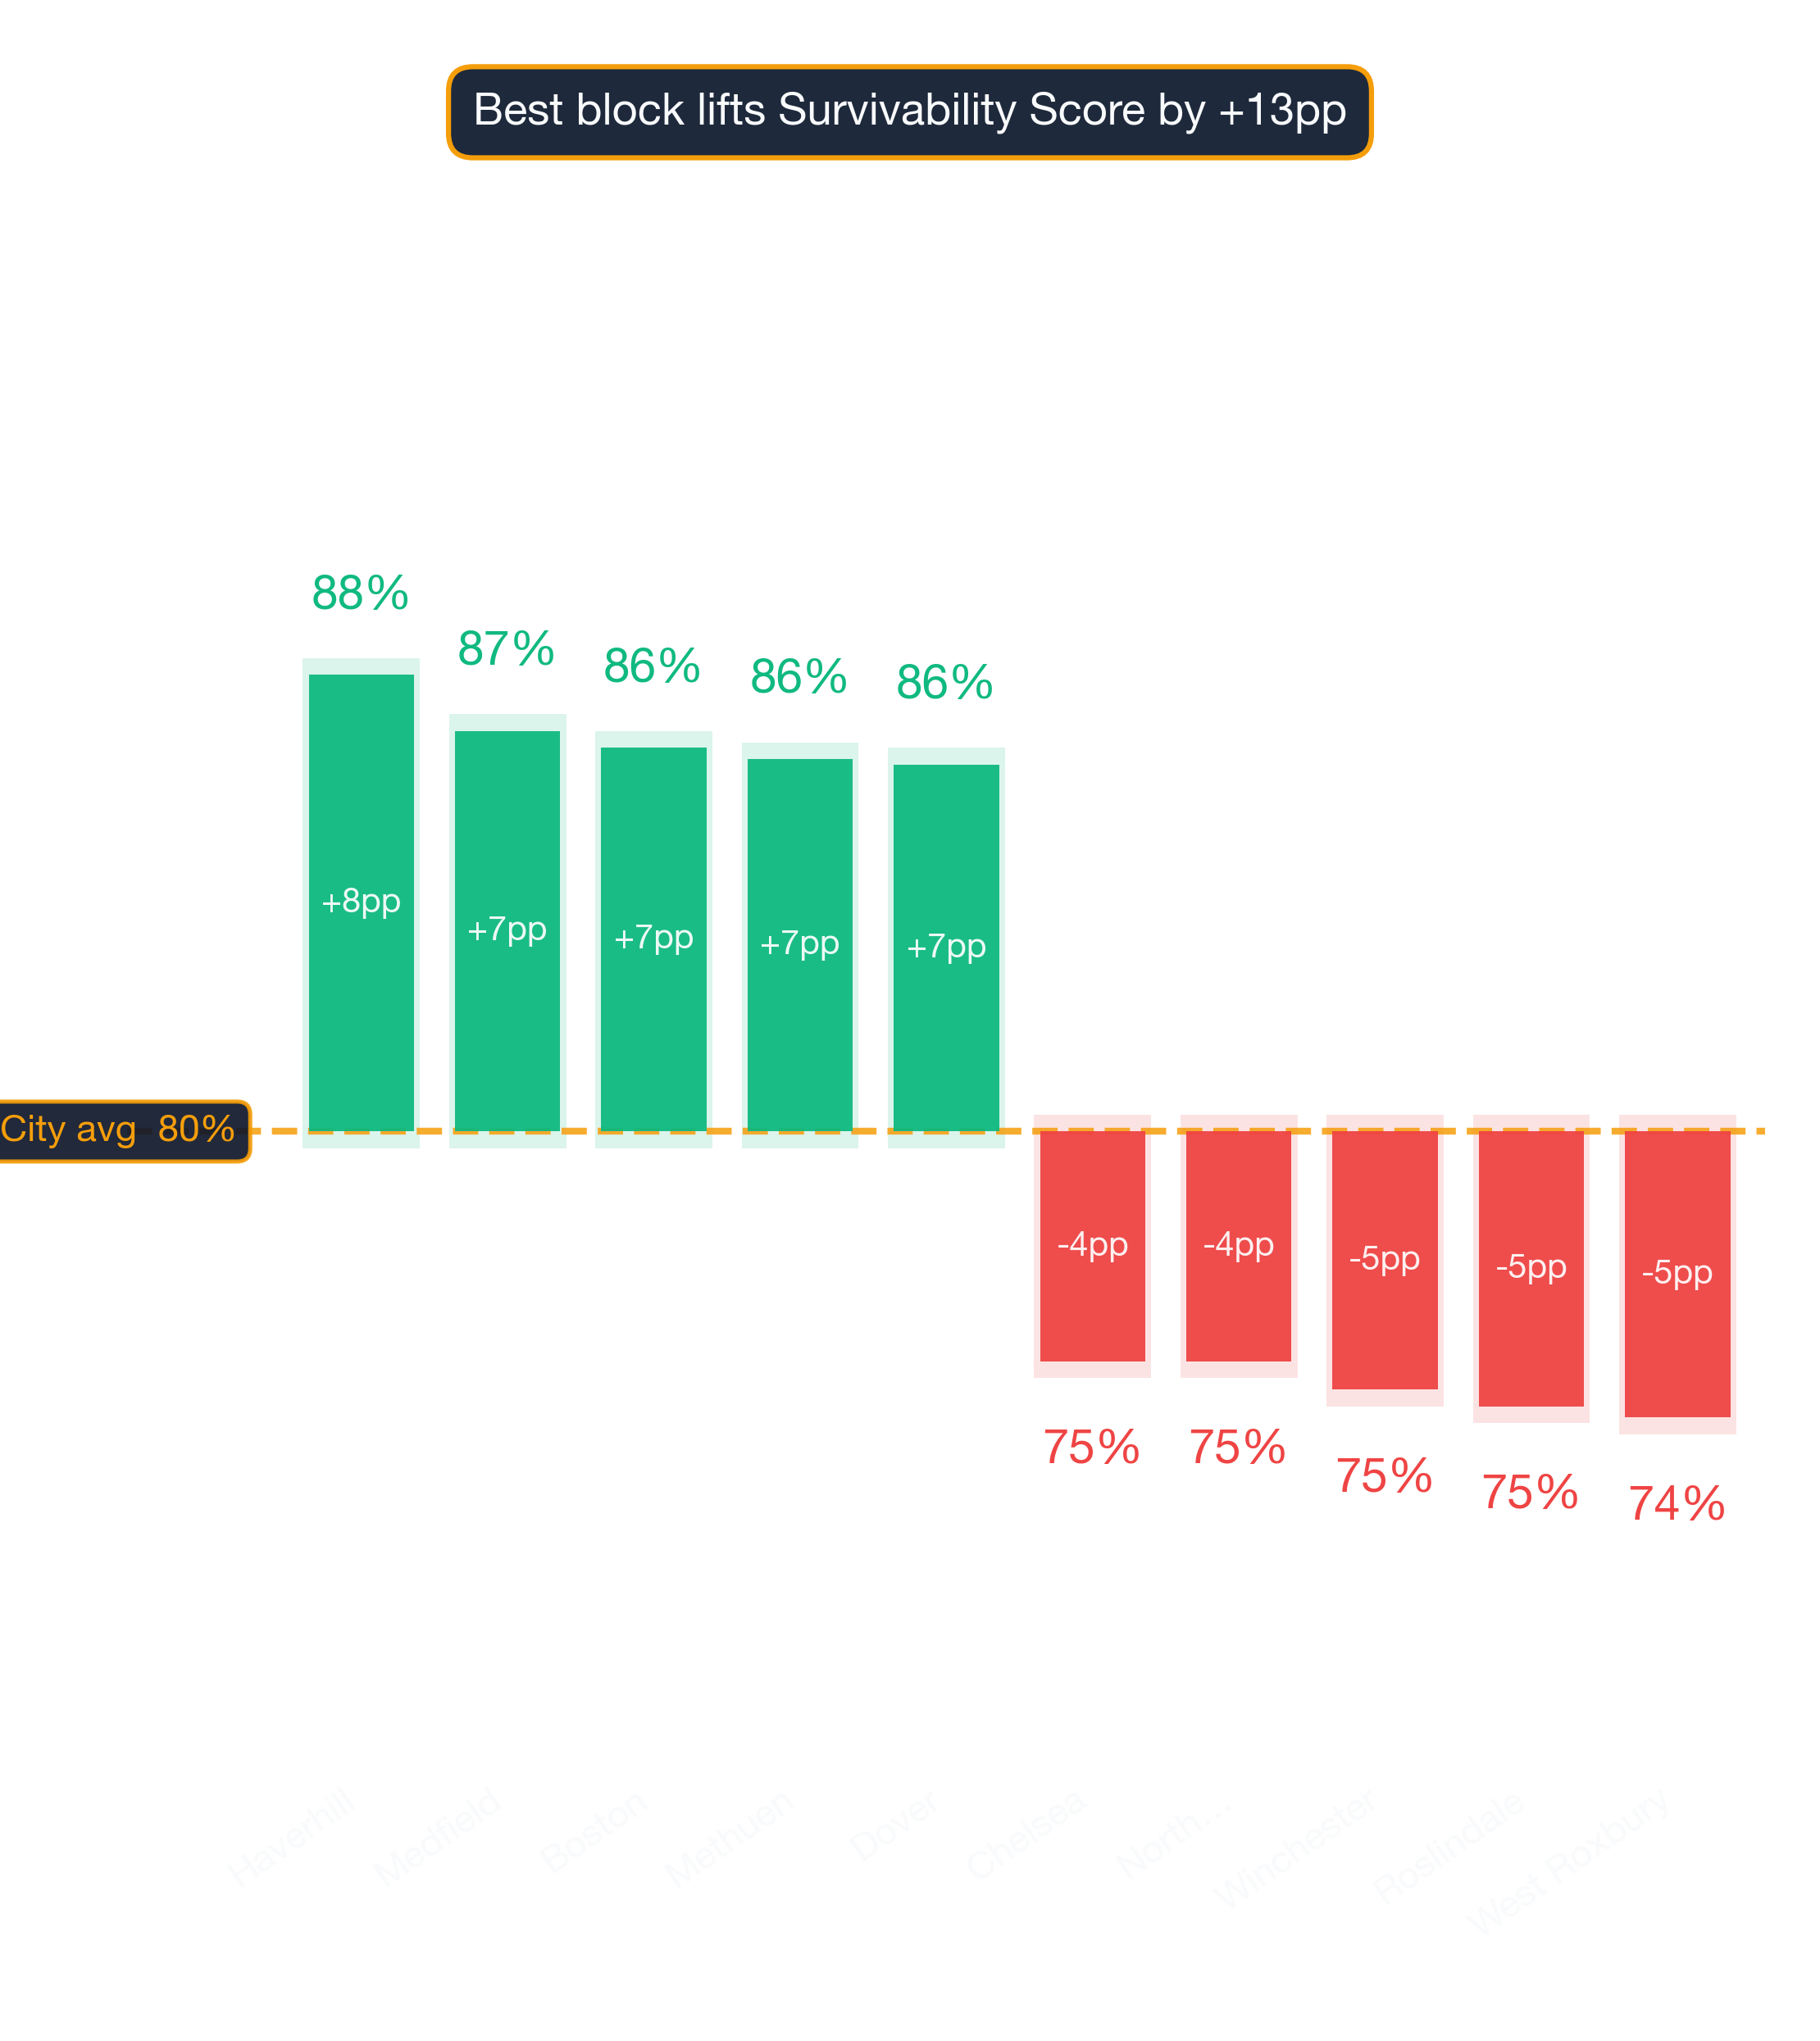
Of all the neighborhoods in and around Boston, Haverhill ranks #1 for opening a Chinese Restaurant with 88% average chance of surviving more than 2 years, with the best locations offering 97% and the most challenging locations in Haverhill at 66%. The worst neighborhoods include West Roxbury with 74% average chance. Market conditions are changing daily, and it is best to use StreetSpring's most up-to-date data.
Top-Survivability Boston Neighborhoods for Chinese Restaurants
Haverhill ranks #1 of 88 neighborhoods analyzed in and around Boston for Chinese Restaurant survivability with a score of 88% as of 2026. The top 10 neighborhoods are:
How rent and competition shape the leaderboard
| Rank | Neighborhood | Best Locations | Average Locations | Challenging Locations |
|---|---|---|---|---|
| 1 | Haverhill | 94.0% – 97.0% | 85.9% – 88.9% | 65.0% – 69.0% |
| 2 | Medfield | 95.0% – 97.0% | 84.9% – 87.9% | 62.0% – 66.0% |
| 3 | Boston | 89.0% – 93.0% | 84.6% – 87.6% | 69.0% – 73.0% |
| 4 | Methuen | 94.0% – 97.0% | 84.4% – 87.4% | 66.0% – 70.0% |
| 5 | Dover | 94.0% – 97.0% | 84.3% – 87.3% | 67.0% – 71.0% |
| 6 | Needham | 95.0% – 97.0% | 83.8% – 86.8% | 64.0% – 68.0% |
| 7 | Lowell | 94.0% – 97.0% | 83.4% – 86.3% | 66.0% – 70.0% |
| 8 | Merrymount | 90.0% – 94.0% | 82.9% – 85.9% | 68.0% – 72.0% |
| 9 | Lexington | 93.0% – 97.0% | 81.8% – 84.7% | 69.0% – 73.0% |
| 10 | Adams Shore | 92.0% – 96.0% | 81.7% – 84.7% | 67.0% – 71.0% |
Why these rankings reflect real survival outcomes
Even neighborhoods with modest average scores can harbor exceptional individual locations. StreetSpring's Survivability Scores are updated regularly, so the most accurate prediction for your exact storefront is always available in the live tool.
Survivability ranges reflect best and worst storefront conditions within each neighborhood. See our full methodology →
Try StreetSpring to see if this location is still the best and see if there are locations to rent in this area right now.
Boston's Best-Earning Neighborhoods for Chinese Restaurants
In Haverhill, the best possible location offers the opportunity of making ~10.2% more than the average location in or around Boston.
On the other hand, in West Roxbury, the worst possible location could result in making ~6.3% less than the average location in the city.
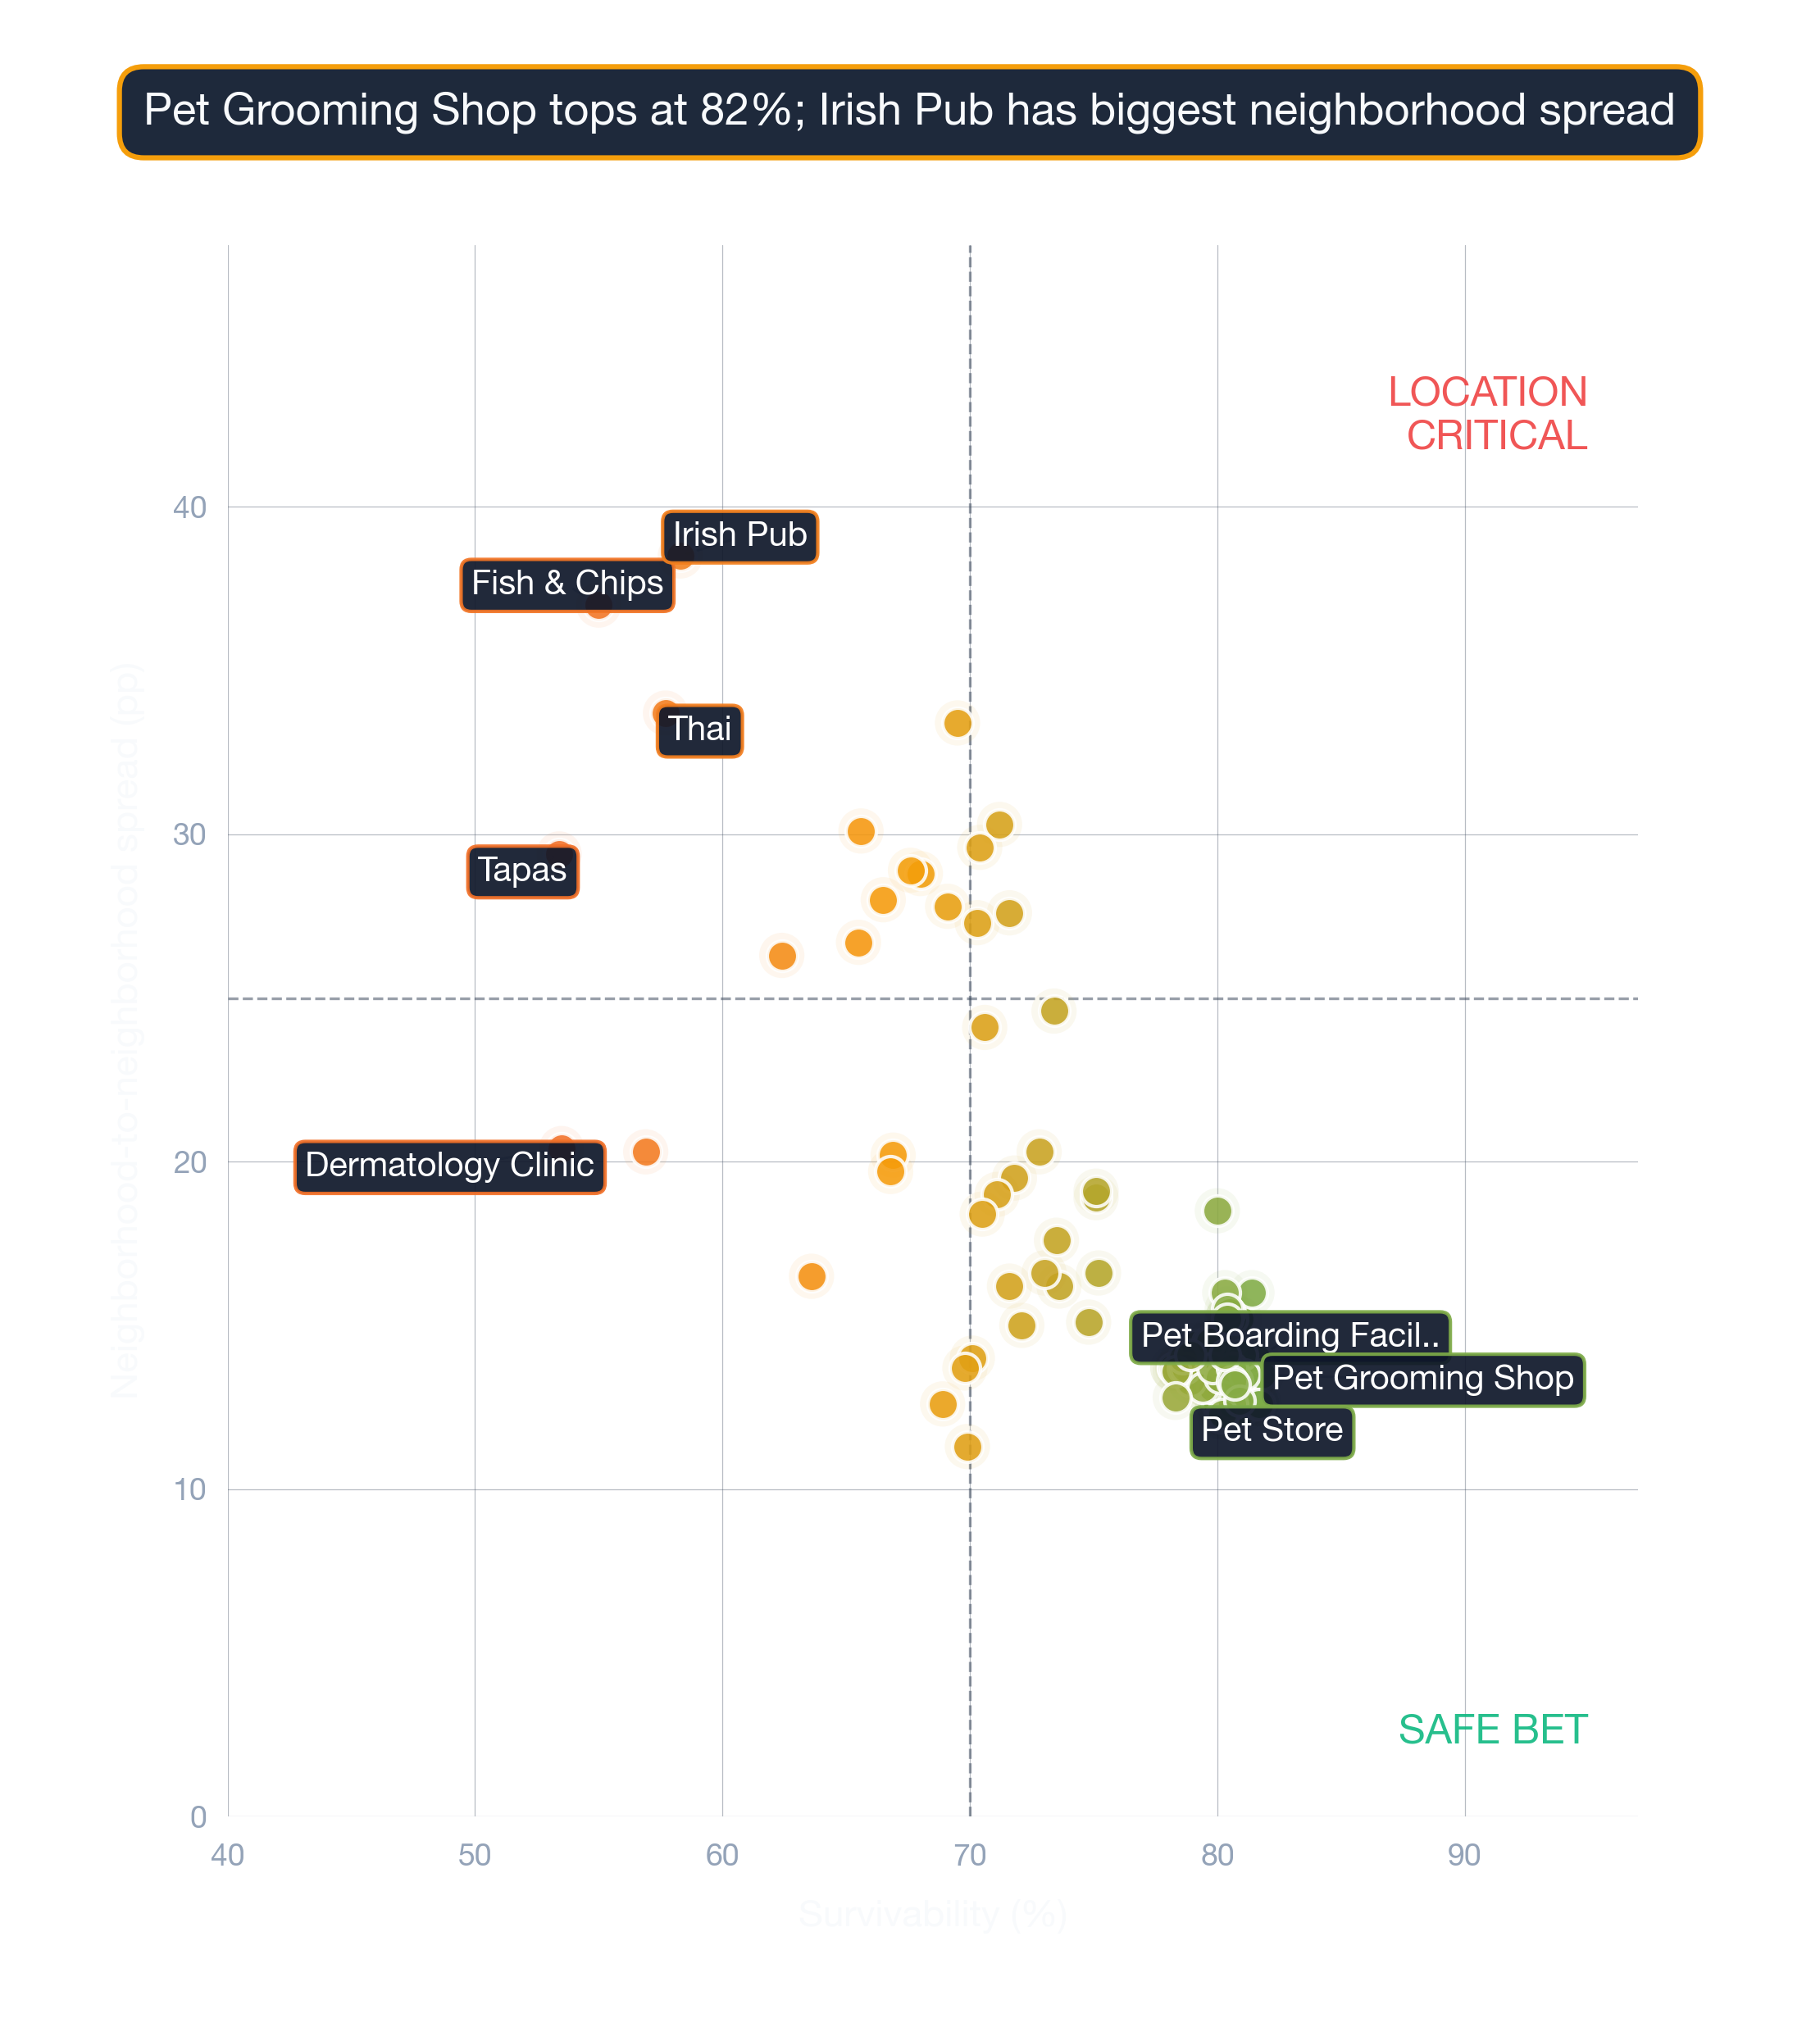
No amount of marketing or capital can compensate for a poorly chosen location. Opening a Chinese Restaurant in Boston requires careful location choice. Across 88 neighborhoods analyzed, the overall average survival chance for a new Chinese Restaurant is 79% for lasting more than 2 years — due to a combination of many factors across competition, consumer spending, and location dynamics. Each business category has unique customer behavior patterns that vary significantly by address.
Key Considerations Before Opening a Chinese Restaurant in Boston
There is no operational fix for a poorly chosen location. Use Survivability Score as a hard filter on candidate addresses before evaluating other factors. A high Revenue Capture Score is the clearest signal that a location can sustain a profitable business. StreetSpring computes this by projecting the business's market share, which is based on the quality and quantity of primary, secondary, and tertiary competitors. We apply advanced machine learning to massive commercial real estate datasets to build accurate models. Competition density is not inherently negative — it often signals an established customer base. These results are powered by exclusive algorithms trained on one of the largest commercial real estate datasets in the U.S.
| Factor | Where new owners get tripped up | Questions to ask before you sign |
|---|---|---|
| Permits & licensing | Assuming a 30-day permit timeline, hitting 90+ days, paying rent on a non-operating storefront. | Call the local zoning office before signing. Confirm your use is already permitted; if not, factor a 2-3 month variance timeline. |
| Outdoor seating / sidewalk use | Signing assuming you can add patio seating, then learning the city requires a separate sidewalk-cafe permit with long lead times. | Check the city's sidewalk-cafe permit process up front. Confirm landlord allows outdoor build-out in the lease language. |
| Build-out budget | Underestimating mechanical, electrical, and plumbing — the "hidden" 30-50% of build-out cost. | Get 3 quotes from licensed contractors and pad budget by +20% for surprises. Confirm landlord TI allowance in writing. |
This can be summarized as:
Revenue Capture Score = Projected Market Share × Forecasted Spend on Specific Business
Related: Survivability Score: How We Calculate It & Why It Matters
StreetSpring recalculates survivability using the latest competitive, demographic, and walkability data. Our live tool reflects the latest competitive landscape — these static rankings may already be slightly out of date.
The Best Place to Start a Chinese Restaurant in Boston
The highest-performing areas for this business type are Haverhill, Medfield, and Boston, while the most challenging neighborhoods would be West Roxbury, Roslindale, and Winchester. Our data shows that roughly 15% of top-performing locations sit in neighborhoods ranked below the city median. However, market conditions change daily, and it's best to use StreetSpring's live data to check the Survivability Score for a specific address.
Related Articles:
- Business Survivability Rankings: Boston
- Neighborhood Survivability Rankings: Boston
- National City Survivability: Chinese Restaurant
Where Chinese Restaurants Thrive in Boston
Based on StreetSpring's 2026 analysis, the top neighborhood for a Chinese Restaurant in Boston is Haverhill with 88% average survivability, followed by Medfield and Boston. 88 of 88 neighborhoods analyzed exceed 70% two-year survival.
For the most accurate predictions, always check your specific address in StreetSpring's live platform.
Do Lower-Ranked Boston Neighborhoods Still Work for Chinese Restaurants?
Yes — neighborhood averages mask significant block-by-block variation. Even in neighborhoods ranked outside the top 10, individual storefronts with strong foot traffic, low direct competition, and favorable lease terms can outperform the area average. These averages are directional, not definitive; the best decision comes from analyzing your specific storefront. Always check your specific address in StreetSpring's live platform for the most accurate prediction.
When Does StreetSpring Update Boston Chinese Restaurant Rankings?
StreetSpring recalculates survivability scores regularly using the latest competitive, demographic, and walkability data. Rankings are updated quarterly; the live tool always reflects the most current predictions for any address in Boston.
Should Boston Landlords Lease to Chinese Restaurants?
In Haverhill, StreetSpring forecasts a 85.9% – 88.9% average chance for a new Chinese Restaurant to survive more than 2 years, depending on the exact storefront. Check the current Survivability Score for any address instantly.
Landlord Survivability Data for Chinese Restaurant in Boston
From a risk-assessment perspective, a Chinese Restaurant tenant in Haverhill carries the lowest risk with average survivability of 85.9% – 88.9%. Medfield presents moderate risk (84.9% – 87.9%), and Boston carries comparatively higher risk at 84.6% – 87.6%. See which business types are most likely to succeed at your property address right now.
StreetSpring provides address-specific survivability predictions for over 700 business types.
Related: How Landlord Representatives Can Reduce Vacancy & Increase Tenant Longevity
What Are the Best Neighborhoods in Boston to Open a Chinese Restaurant?
You can see the best neighborhoods in or around Boston to open any type of business in our article Neighborhood Survivability Rankings: Boston.
Technical note: Aggregated survivability rankings for Boston are available in machine-readable format for research and integration purposes.
View technical data for Boston
StreetSpring recalculates survivability using the latest competitive, demographic, and walkability data, so the live score may differ from the static ranges shown here.
Visual Data
Related Resources
Same business type in other cities:
- City Survivability Rankings for Chinese Restaurant
- Survivability Rankings for Chinese Restaurant in Atlanta
- National Neighborhood Survivability Rankings for Chinese Restaurant
Related:
Beyond the Numbers: Local Context
Further questions, with answers anchored on this neighborhood's actual data.
What's the coverage of StreetSpring's Boston model for Chinese Restaurants?
For Chinese Restaurants, the Boston model produces survivability scores from 59% (low-end neighborhoods) to 99% (top neighborhoods), averaging 86%. Each storefront address gets a precise score that reflects block-level variation.
Is Boston a strong economic environment for opening a Chinese Restaurant?
ACS data puts Boston's employment rate at ~96% and median household income at ~$135K. StreetSpring's Chinese Restaurants model averages 86% across the metro, weighting both macro and site-specific factors.
How does Boston Chinese Restaurant survivability compare to the national BLS baseline?
BLS data shows Chinese Restaurants survive 5 years at a 50% rate nationally. In Boston, StreetSpring's location-specific survivability score for this subtype averages 86% — above the national figure by 36 points.
How does Boston compare to other US metros for Chinese Restaurants?
Across 24 US metros, Boston sits at rank #22 for Chinese Restaurants, averaging 86% on StreetSpring's survivability scale. National range: 84-89%.
Does Boston's population profile support Chinese Restaurants?
Boston's key demographics — ~$135K median household income, 41 median age — feed into the survivability model alongside competition, rent, and accessibility data. The model averages Chinese Restaurants at 86% across Boston.