Survivability Rankings for Middle Eastern Restaurant in Baltimore
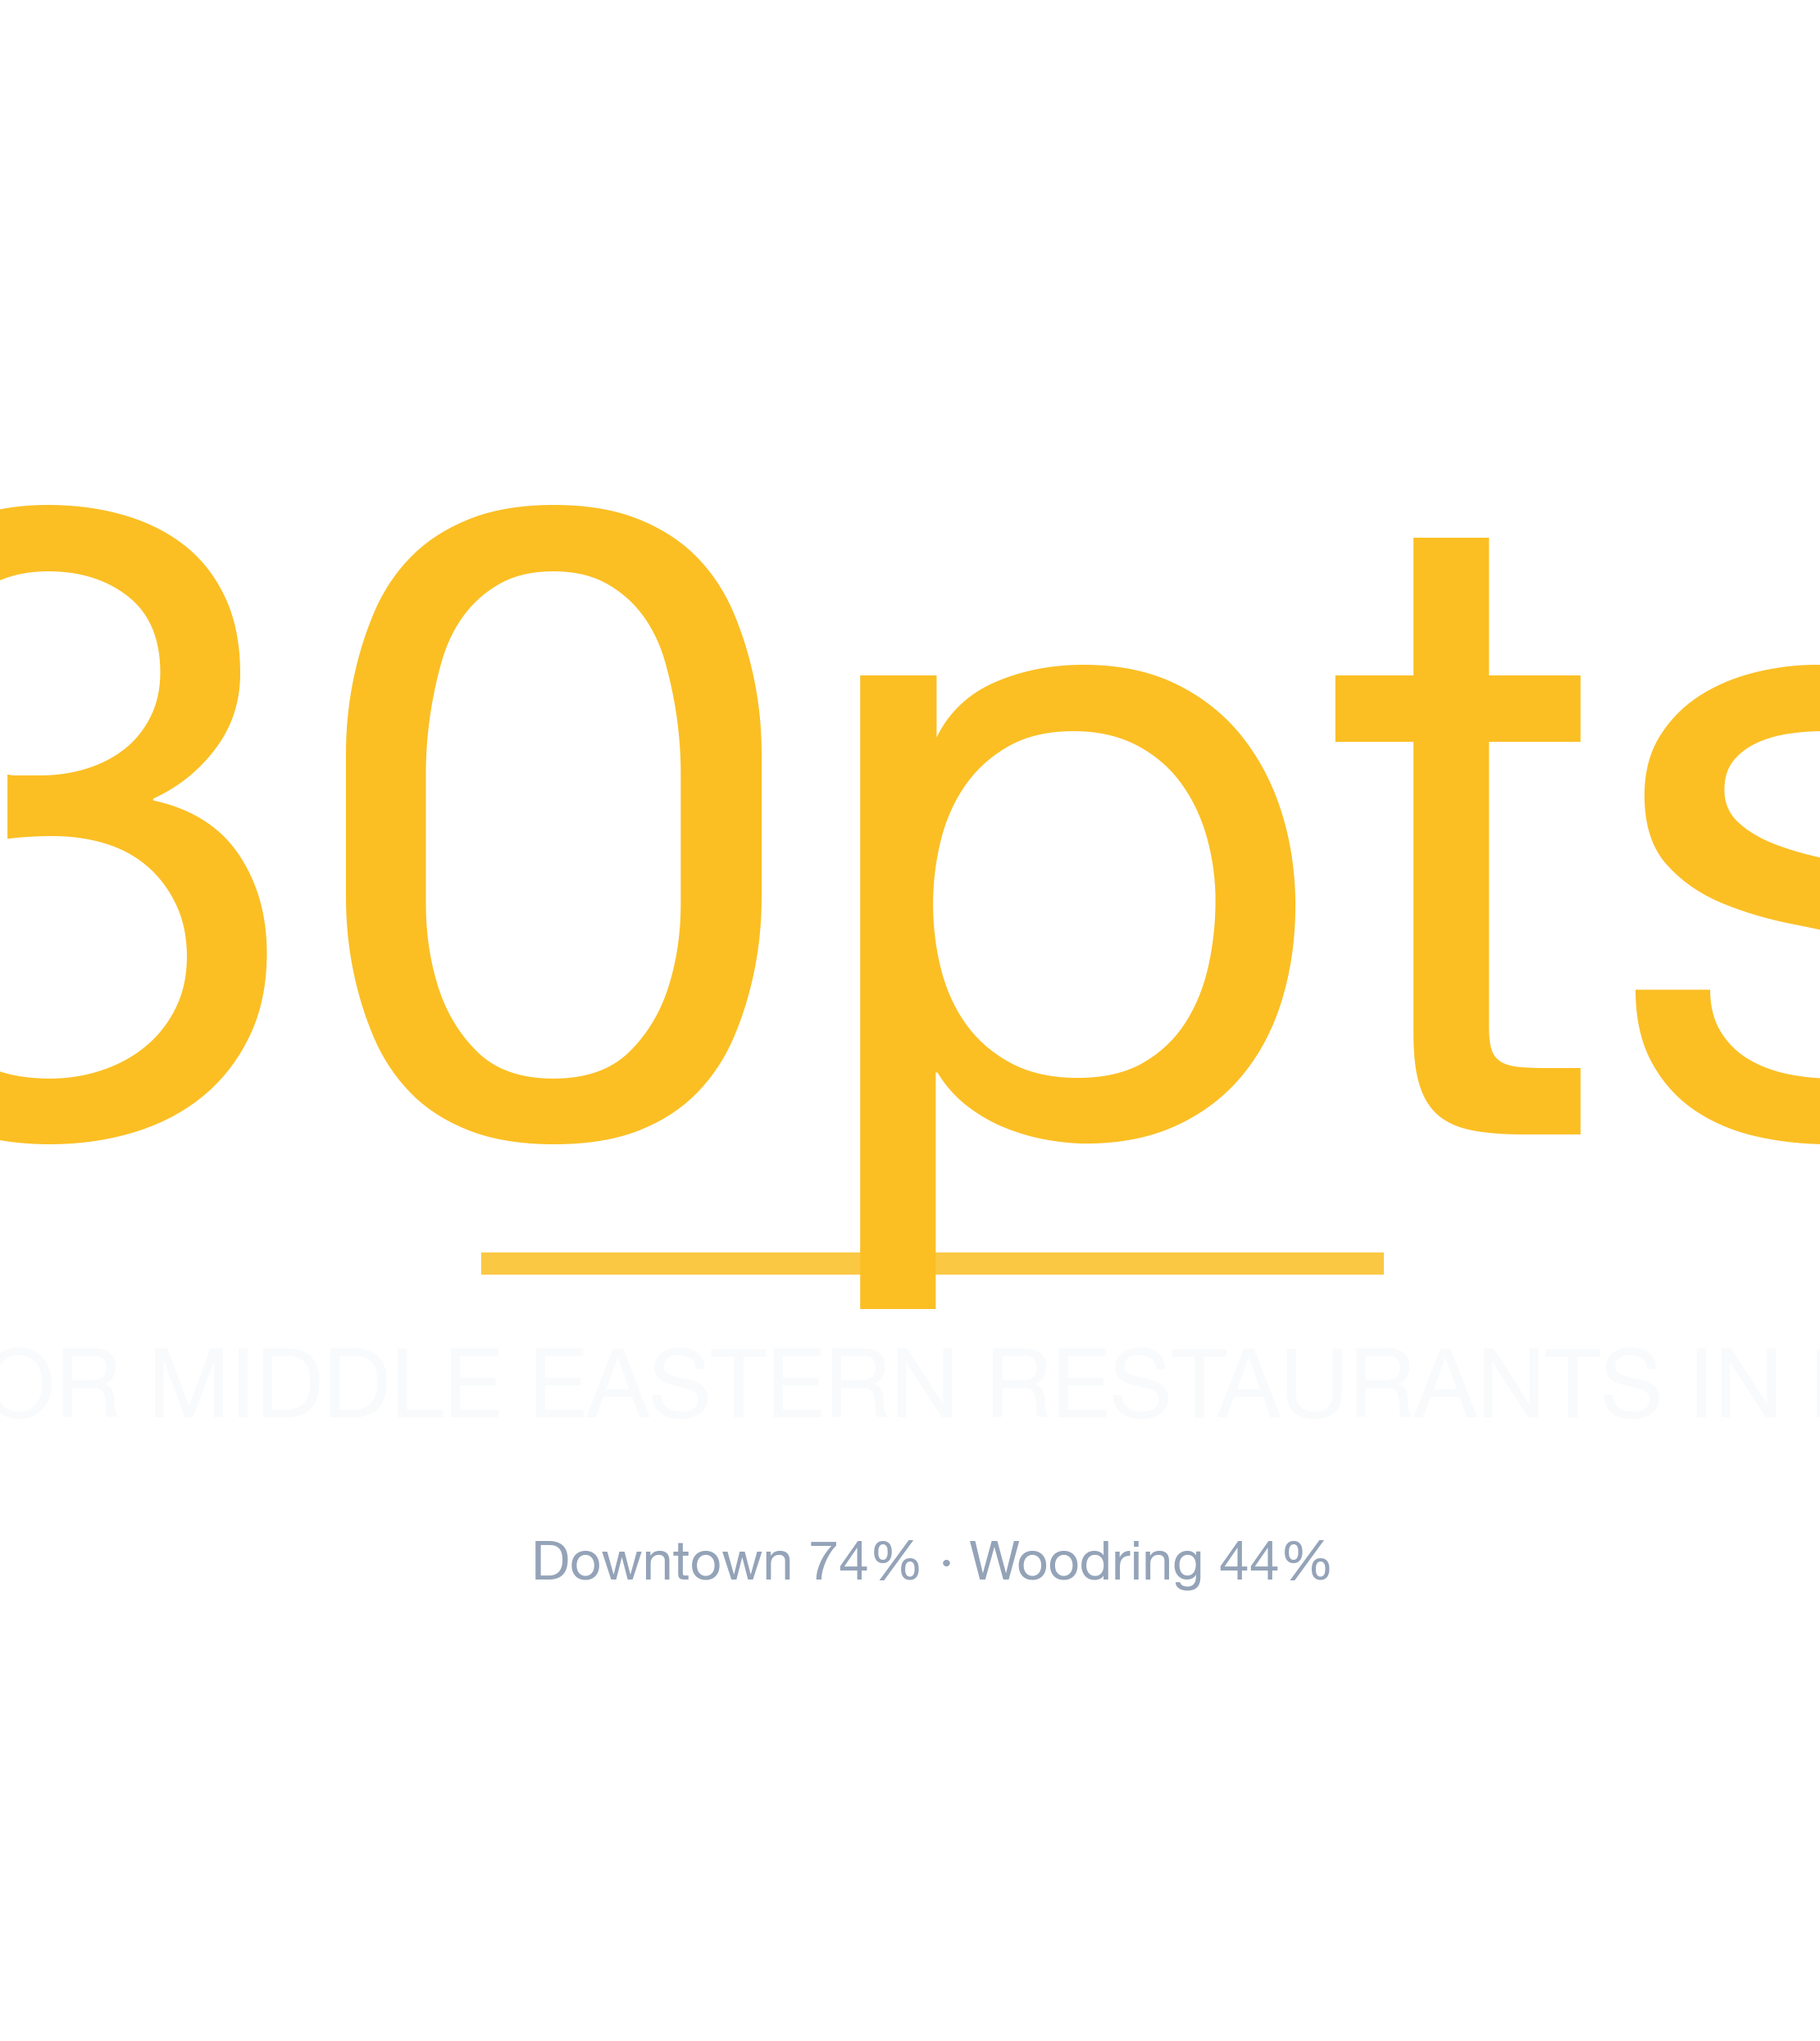
StreetSpring's 2026 analysis ranks the best and worst neighborhoods in Baltimore to open a Middle Eastern Restaurant, from Downtown (74% survival) to Wo...
By Bobby Koons | Reviewed: May 10, 2026 | Refreshed weekly | Methodology
Quick Summary
- #1 Neighborhood: Downtown — 74% average survivability for Middle Eastern Restaurant
- Neighborhoods at or above 70%: 4 of 23 analyzed
- City-wide average: 64% for Middle Eastern Restaurants
- Most challenging area: Woodring at 44%
- Revenue advantage (top vs. avg location): ~15.7% more expected revenue in Downtown
- Data freshness: 2026 data · Full methodology →
Table of Contents
- Summary
- 10 Best Neighborhoods
- Where Would a Middle Eastern Restaurant Make the Most Money?
- What Should I Consider?
- Where Should I Start?
- FAQ: Best Neighborhoods
- FAQ: Can a Middle Eastern Restaurant Succeed in Lower-Ranked Areas?
- FAQ: How Often Are Rankings Updated?
- FAQ: Is a Middle Eastern Restaurant a Good Tenant?
- Landlord Survivability Data
- Best Neighborhoods for Any Business
Summary
Opening a Middle Eastern Restaurant in Baltimore? Our 2026 analysis identifies Downtown as the top location with 74% average chance of surviving more than 2 years, with the best locations offering 77% and the most challenging locations in Downtown at 70%. The worst neighborhoods include Woodring with 44% average chance. Our data shows that roughly 15% of top-performing locations sit in neighborhoods ranked below the city median.
Where in Baltimore Should You Open a Middle Eastern Restaurant?
Downtown ranks #1 of 23 neighborhoods analyzed in and around Baltimore for Middle Eastern Restaurant survivability with a score of 74% as of 2026. The top 10 neighborhoods are:
What separates the top neighborhoods from the rest
| Rank | Neighborhood | Best Locations | Average Locations | Challenging Locations |
|---|---|---|---|---|
| 1 | Downtown | 74.0% – 78.0% | 72.1% – 76.0% | 69.0% – 73.0% |
| 2 | Eastwood | 82.0% – 86.0% | 71.0% – 74.9% | 52.0% – 56.0% |
| 3 | Otterbein | 70.0% – 74.0% | 69.5% – 73.4% | 68.0% – 72.0% |
| 4 | Jonestown | 68.0% – 72.0% | 68.3% – 72.2% | 69.0% – 73.0% |
| 5 | Cedonia | 74.0% – 78.0% | 67.7% – 71.6% | 55.0% – 59.0% |
| 6 | Kresson | 74.0% – 78.0% | 67.4% – 71.3% | 60.0% – 64.0% |
| 7 | Canton | 69.0% – 73.0% | 67.1% – 71.0% | 64.0% – 68.0% |
| 8 | Riverside | 68.0% – 72.0% | 66.2% – 70.1% | 58.0% – 62.0% |
| 9 | Medford | 75.0% – 79.0% | 65.9% – 69.8% | 61.0% – 65.0% |
| 10 | Oaklee | 83.0% – 87.0% | 64.8% – 68.8% | 55.0% – 59.0% |
Why these rankings reflect real survival outcomes
Our data shows that roughly 15% of top-performing locations sit in neighborhoods ranked below the city median. New competitor openings and closures happen weekly — the live tool ensures you see the latest picture.
Survivability ranges reflect best and worst storefront conditions within each neighborhood. See our full methodology →
Try StreetSpring to see if this location is still the best and see if there are locations to rent in this area right now.
Where Middle Eastern Restaurants Earn the Most in Baltimore
In Downtown, the best possible location offers the opportunity of making ~15.7% more than the average location in or around Baltimore.
On the other hand, in Woodring, the worst possible location could result in making ~30.6% less than the average location in the city.
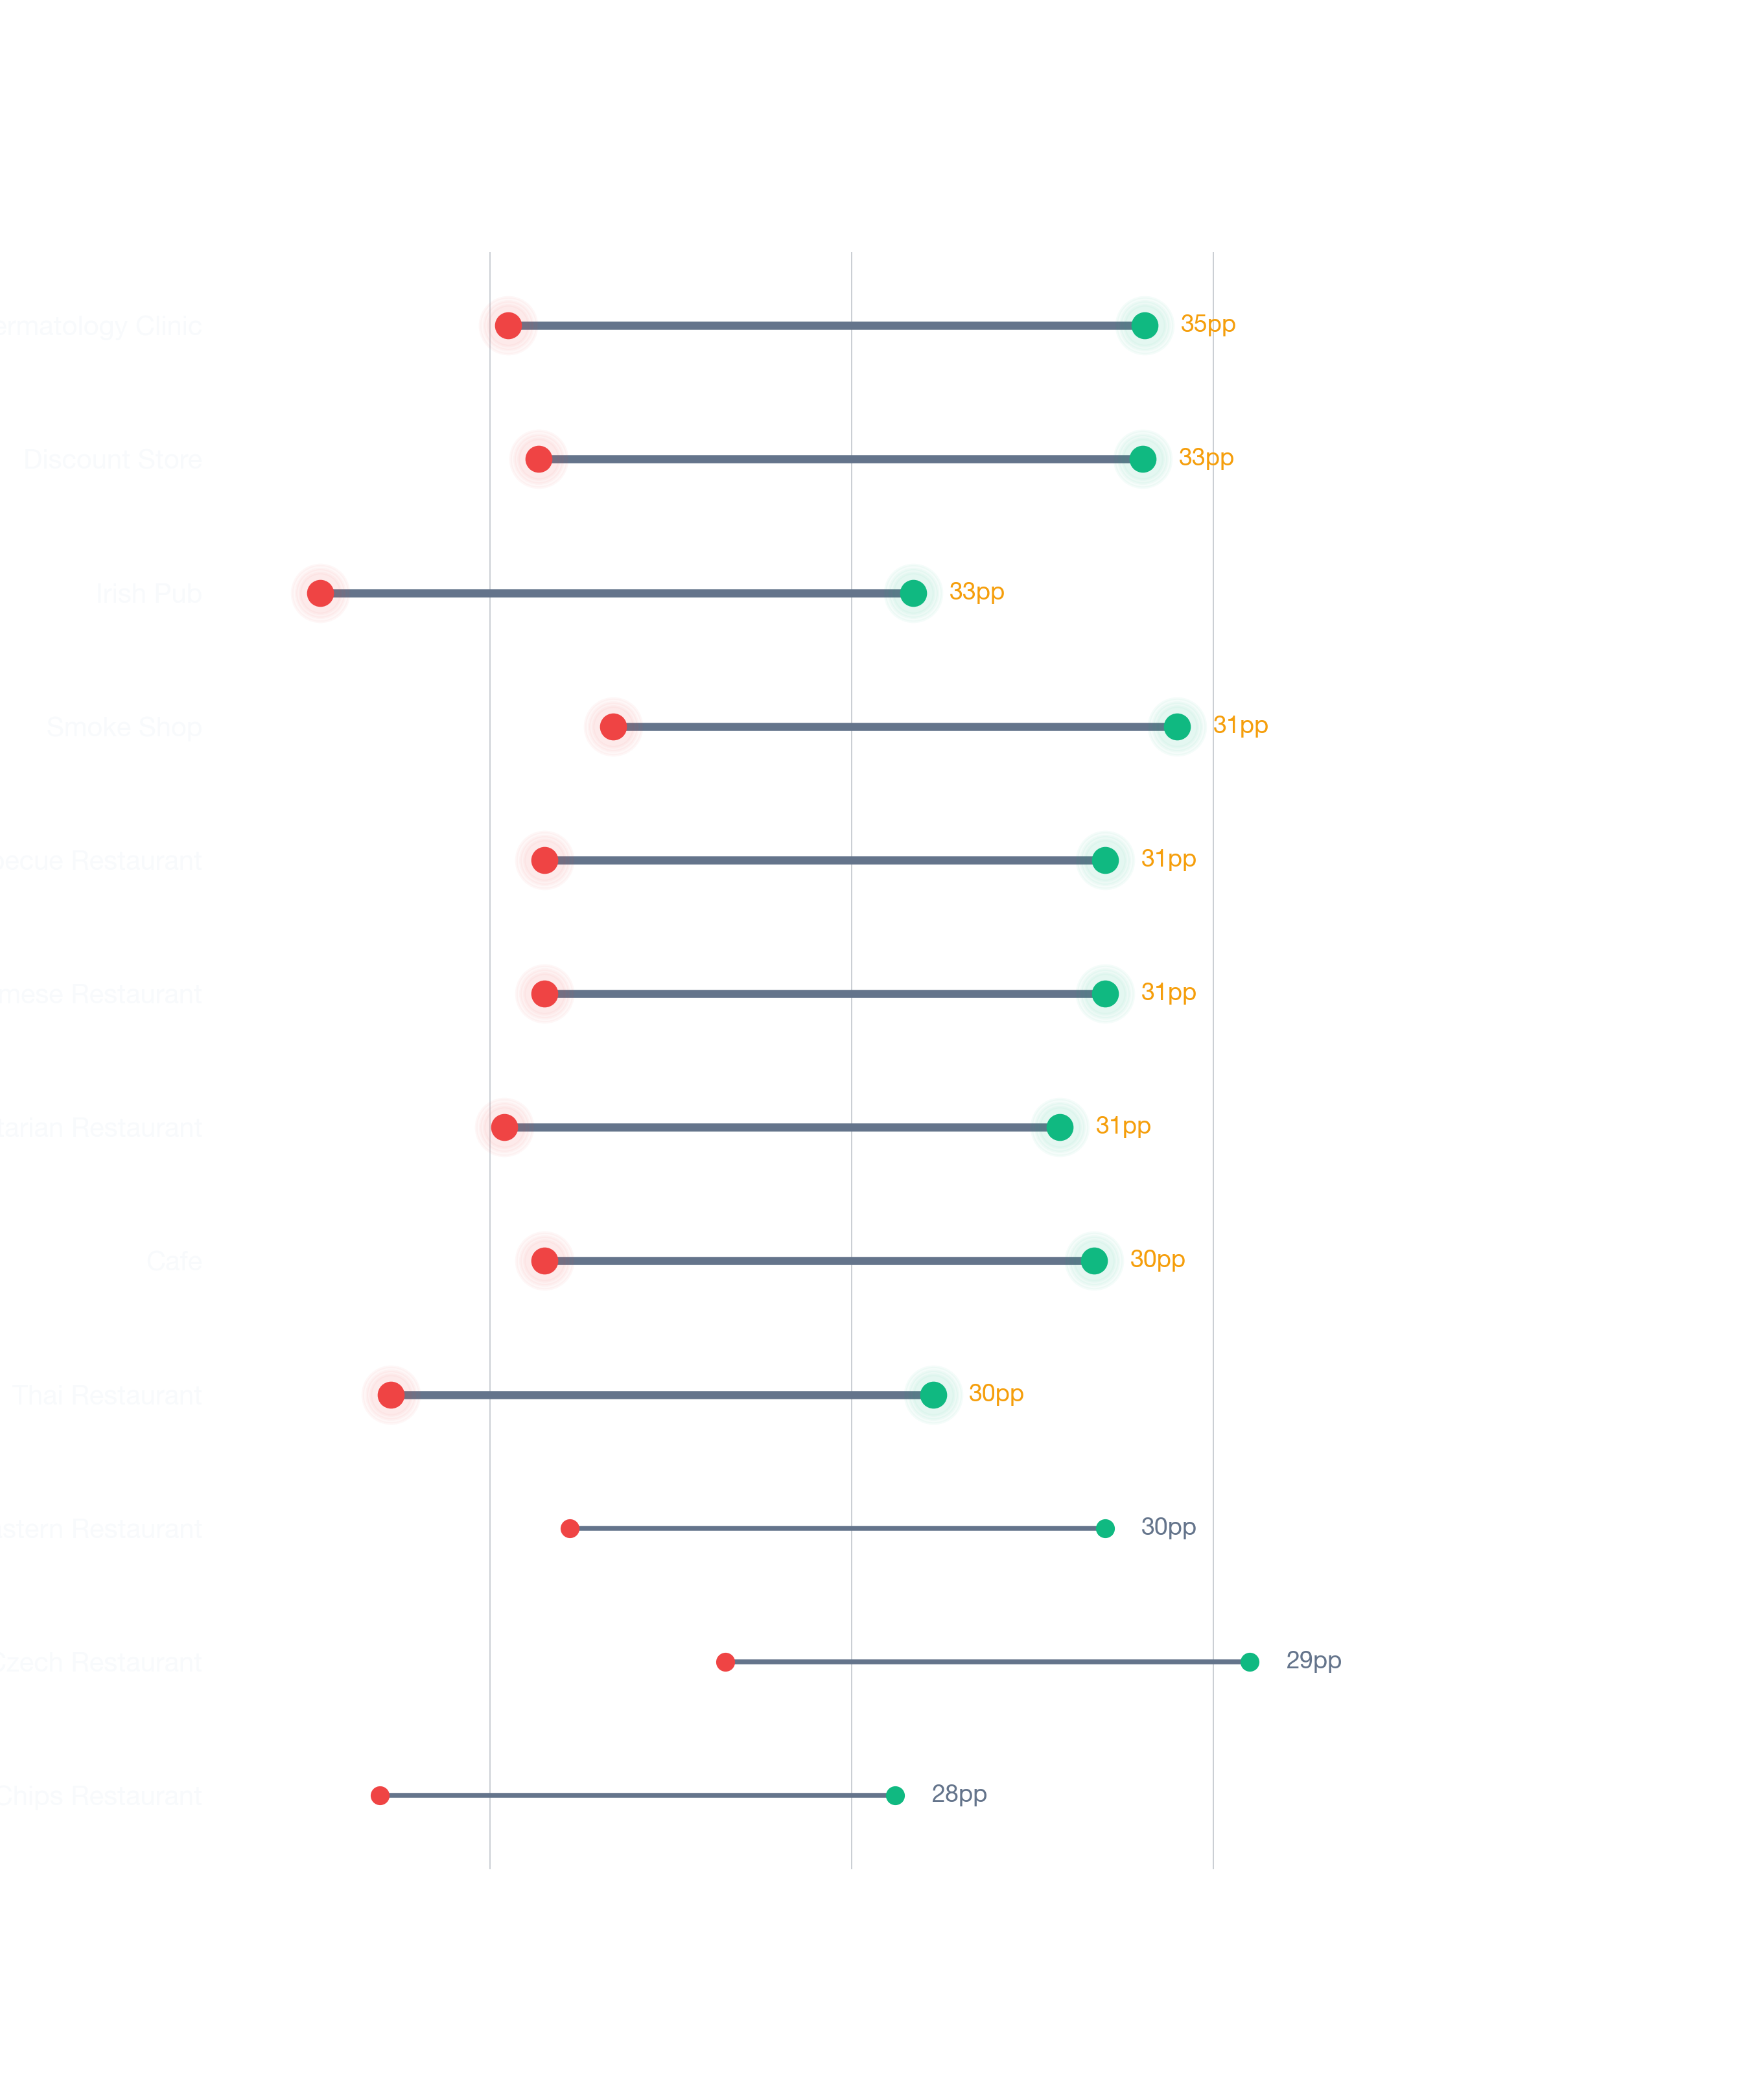
Location selection is the most consequential decision any new business owner makes. Opening a Middle Eastern Restaurant in Baltimore requires careful location choice. Across 23 neighborhoods analyzed, the overall average survival chance for a new Middle Eastern Restaurant is 64% for lasting more than 2 years — due to a combination of many factors across competition, consumer spending, and location dynamics. Each business category has unique customer behavior patterns that vary significantly by address.
Key Considerations Before Opening a Middle Eastern Restaurant in Baltimore
The strongest predictor of whether this business survives two years is the quality of the location you pick — Survivability Score quantifies exactly that. Of all the variables StreetSpring analyzes, Revenue Capture Score has the strongest predictive power. StreetSpring computes this by projecting the business's market share, which is based on the quality and quantity of primary, secondary, and tertiary competitors. The analysis behind these rankings spans millions of data points across competition, spending, and mobility. Areas with complementary competitors tend to generate higher overall foot traffic. Our prediction system is built from scratch using proprietary data pipelines and validated against actual business lifecycles.
| Area to check | What can go wrong | How to de-risk it |
|---|---|---|
| Workforce availability | Hiring radius is smaller than you think — many neighborhoods can't staff a full team at standard wages. | Pull BLS wage data for your industry in this metro. Walk through your staffing plan with a local restaurant/retail operator before signing. |
| Lease term | Locking into 7-10 years without break clauses, then needing to relocate after year 2. | Negotiate a relocation or termination clause. Confirm assignment + sublease rights are in writing. |
| Foot traffic seasonality | Looking at a peak-summer Tuesday and assuming year-round volume. | Walk the block at 3 different times across 2 different weeks. Ask neighboring tenants for their slow-season % drop. |
This can be summarized as:
Revenue Capture Score = Projected Market Share × Forecasted Spend on Specific Business
Related: Survivability Score: How We Calculate It & Why It Matters
StreetSpring recalculates survivability using the latest competitive, demographic, and walkability data. Neighborhood rankings are useful, but the exact odds for your location can only be seen by running a current survivability check in StreetSpring.
The Best Place to Start a Middle Eastern Restaurant in Baltimore
StreetSpring identifies the strongest markets as Downtown, Eastwood, and Otterbein, while the most challenging neighborhoods would be Woodring, Westfield, and Overlea. Location-level factors like visibility and adjacent tenants can override neighborhood-level trends. Market dynamics shift frequently; validate these insights with real-time data from StreetSpring.
Related Articles:
Which Baltimore Neighborhoods Are Strongest for Middle Eastern Restaurants?
Based on StreetSpring's 2026 analysis, the top neighborhood for a Middle Eastern Restaurant in Baltimore is Downtown with 74% average survivability, followed by Eastwood and Otterbein. 4 of 23 neighborhoods analyzed exceed 70% two-year survival.
Real-time data from StreetSpring accounts for recent openings, closures, and seasonal shifts that static rankings cannot.
When Lower-Scoring Neighborhoods Can Still Work for Middle Eastern Restaurants
Yes — neighborhood averages mask significant block-by-block variation. Even in neighborhoods ranked outside the top 10, individual storefronts with strong foot traffic, low direct competition, and favorable lease terms can outperform the area average. A low-ranking neighborhood can still contain high-potential storefronts — the address matters most. Always check your specific address in StreetSpring's live platform for the most accurate prediction.
Refresh Cadence for Baltimore Middle Eastern Restaurant Survivability Rankings
StreetSpring recalculates survivability scores regularly using the latest competitive, demographic, and walkability data. Rankings are updated quarterly; the live tool always reflects the most current predictions for any address in Baltimore.
Should You Rent Your Baltimore Storefront to a Middle Eastern Restaurant?
In Downtown, StreetSpring forecasts a 72.1% – 76.0% average chance for a new Middle Eastern Restaurant to survive more than 2 years, depending on the exact storefront. Check the current Survivability Score for any address instantly.
Landlord Survivability Data for Middle Eastern Restaurant in Baltimore
Landlords in Baltimore's top three neighborhoods for Middle Eastern Restaurant can expect the following average survivability for new tenants:
- Downtown: 72.1% – 76.0%
- Eastwood: 71.0% – 74.9%
- Otterbein: 69.5% – 73.4%
Get a live Survivability Score for your specific storefront at no cost.
StreetSpring delivers address-level predictions, showing how likely hundreds of different businesses are to last at that exact spot.
Related: How Landlord Representatives Can Reduce Vacancy & Increase Tenant Longevity
Top-Survivability Baltimore Neighborhoods for Middle Eastern Restaurants
You can see the best neighborhoods in or around Baltimore to open any type of business in our article Neighborhood Survivability Rankings: Baltimore.
Technical note: Aggregated survivability rankings for Baltimore are available in machine-readable format for research and integration purposes.
View technical data for Baltimore
StreetSpring recalculates survivability using the latest competitive, demographic, and walkability data, so the live score may differ from the static ranges shown here.
Visual Data
Related Resources
Same business type in other cities:
Related:
- Business Survivability Rankings: Baltimore
- Neighborhood Survivability Rankings: Baltimore
- Business Survivability in Annapolis, Baltimore
- Business Survivability in Beechfield, Baltimore
Local Data Questions
Beyond the general FAQ — data-anchored answers for this specific location.
How much does location matter for a Middle Eastern Restaurant in Baltimore?
Across Baltimore, StreetSpring's survivability score for Middle Eastern Restaurants ranges from 60% at the most challenging locations to 98% at the best — a 38-percentage-point gap that location selection alone can capture.
Which Baltimore subtypes have comparable survivability to Middle Eastern Restaurants?
Per StreetSpring's Baltimore corpus, peers of Middle Eastern Restaurants (within 2 points of the 87% average) include Pizza Restaurant, Steakhouse, Tapas Restaurant.
When does StreetSpring update Baltimore Middle Eastern Restaurants rankings?
Quarterly. The 2026 corpus shows Middle Eastern Restaurants in Baltimore averaging 87%; quarterly refreshes integrate new competitor entries/exits, updated ACS data, and recalibrated lease rates.