Survivability Rankings for Korean Restaurant in Baltimore
StreetSpring's 2026 analysis ranks the best and worst neighborhoods in Baltimore to open a Korean Restaurant, from Canton (85% survival) to Old Town (74%).
By Bobby Koons | Last reviewed by Bobby Koons on April 27, 2026 | Methodology
Quick Summary
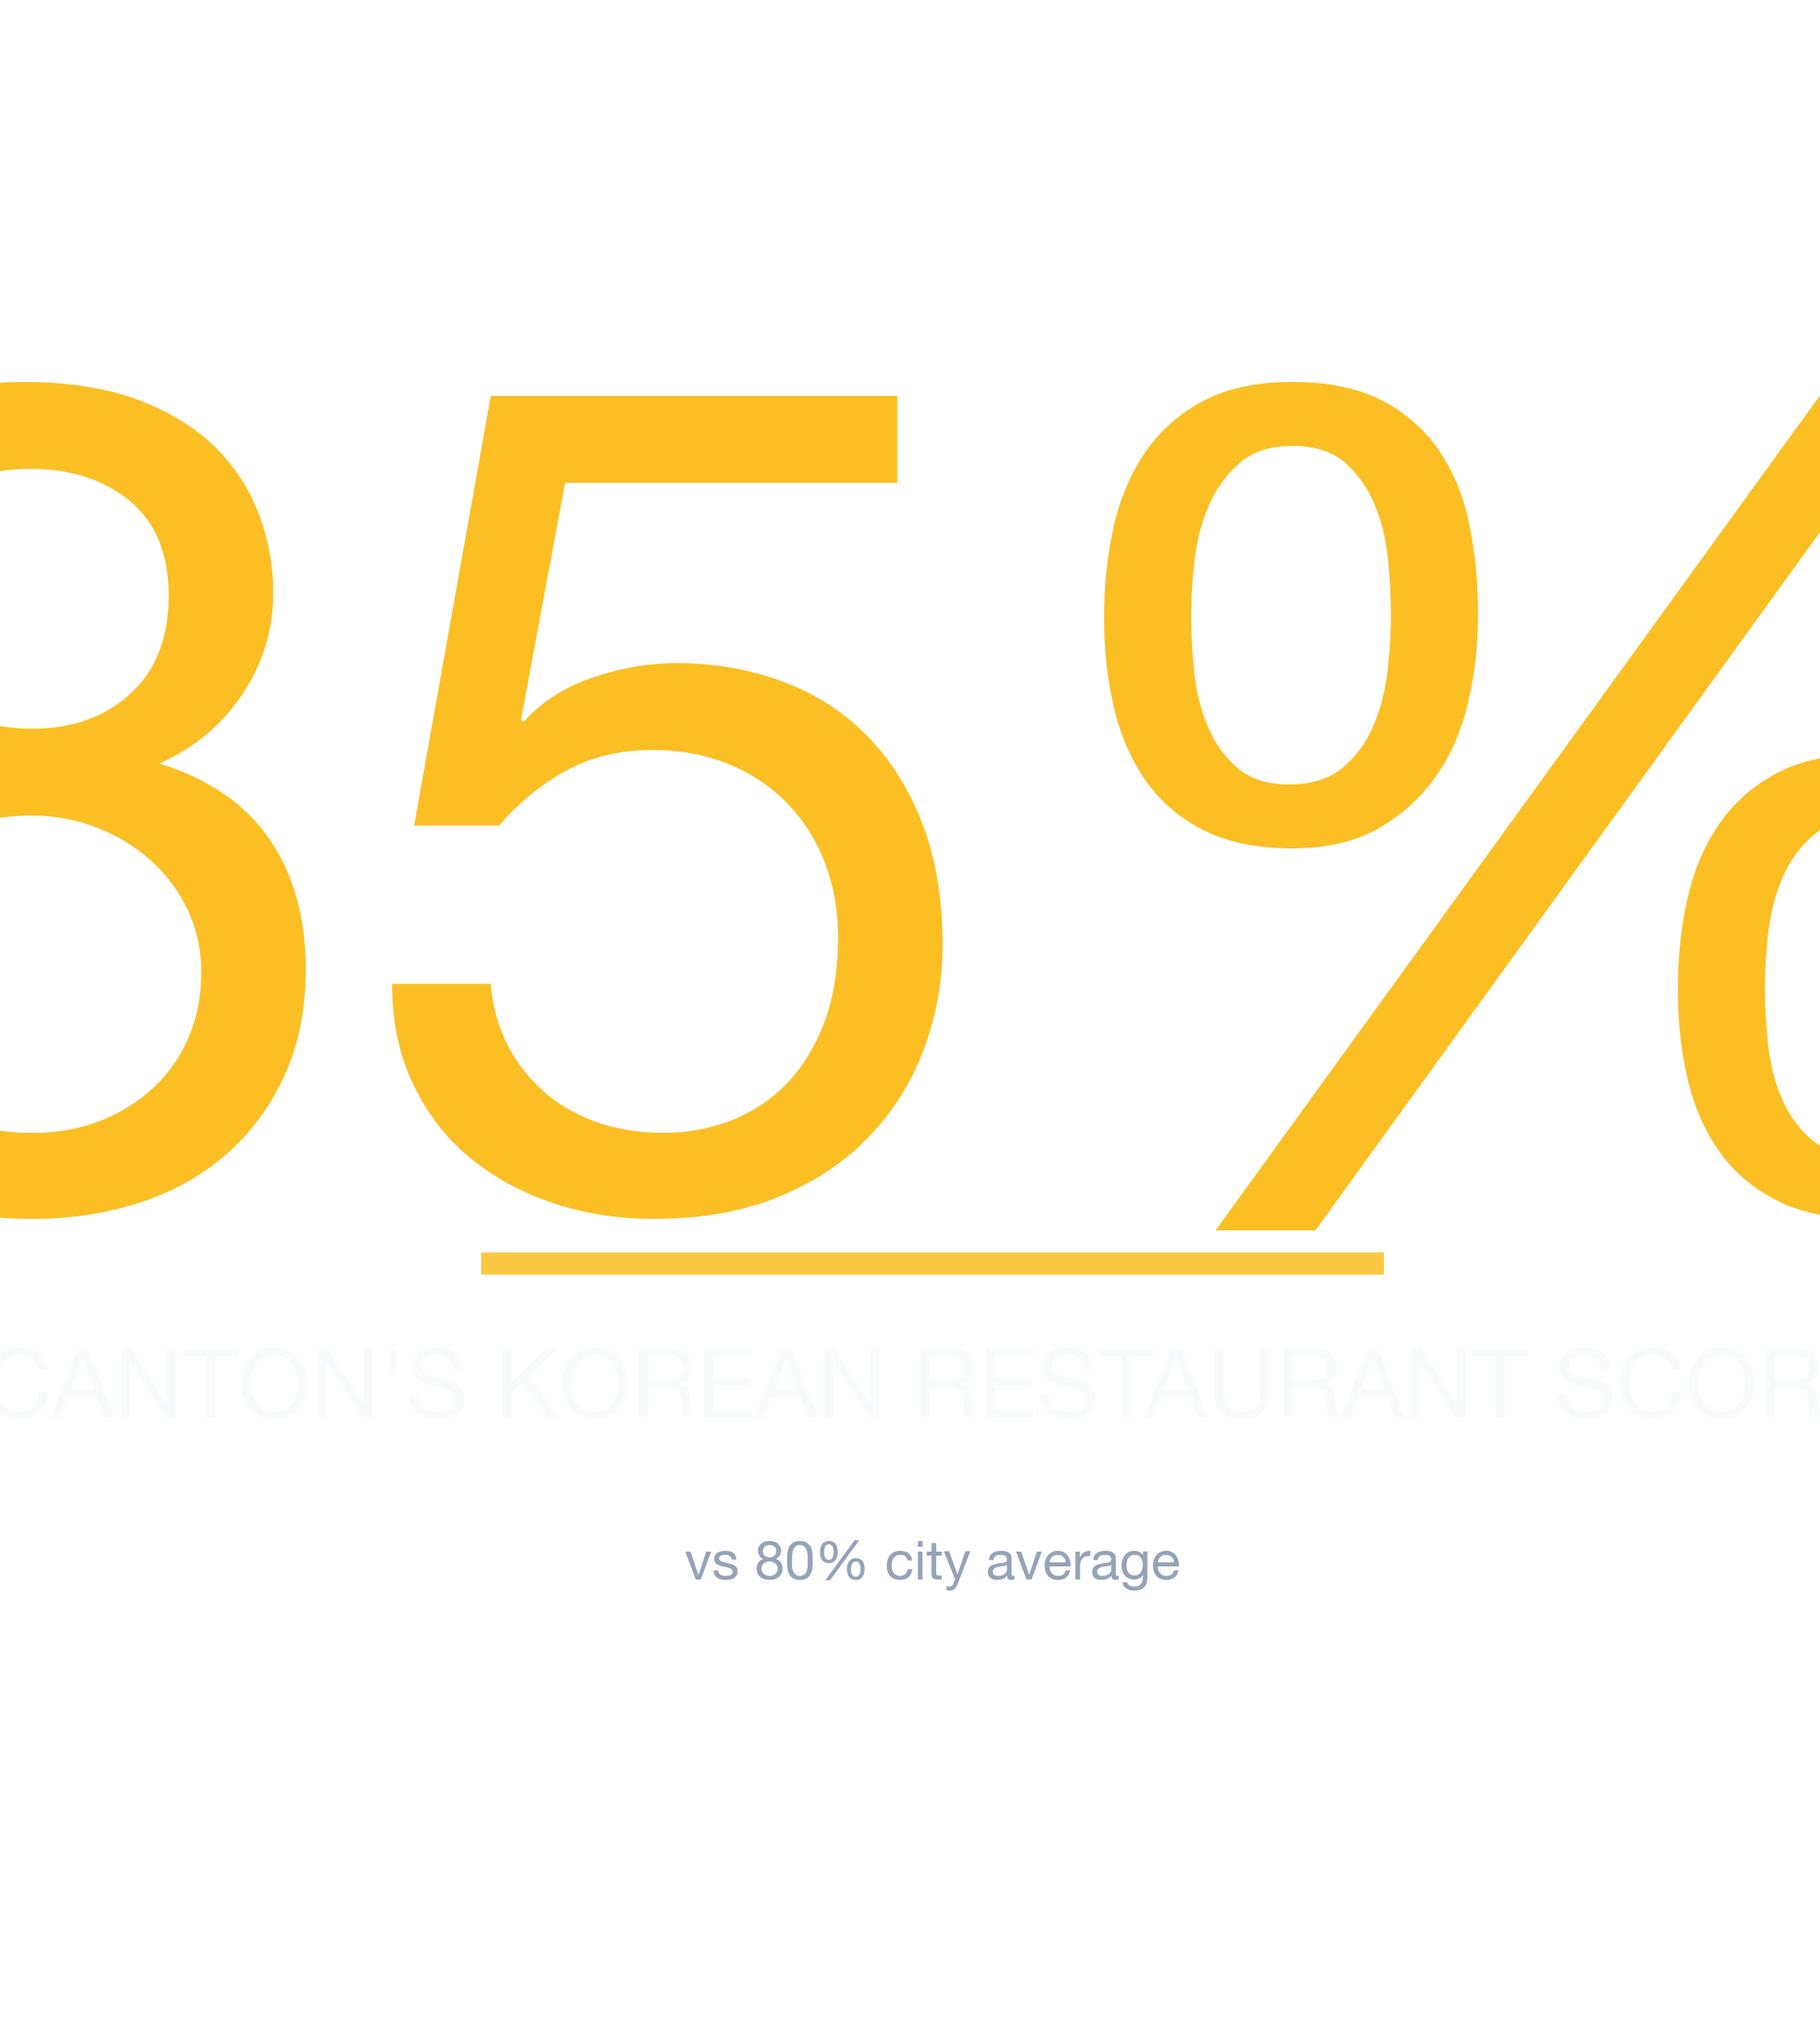
- #1 Neighborhood: Canton — 85% average survivability for Korean Restaurant
- Neighborhoods at or above 70%: 23 of 23 analyzed
- City-wide average: 80% for Korean Restaurants
- Most challenging area: Old Town at 74%
- Revenue advantage (top vs. avg location): ~6.1% more expected revenue in Canton
- Data freshness: 2026 data · Full methodology →
Table of Contents
- Summary
- 10 Best Neighborhoods
- Where Would a Korean Restaurant Make the Most Money?
- What Should I Consider?
- Where Should I Start?
- FAQ: Best Neighborhoods
- FAQ: Can a Korean Restaurant Succeed in Lower-Ranked Areas?
- FAQ: How Often Are Rankings Updated?
- FAQ: Is a Korean Restaurant a Good Tenant?
- Landlord Survivability Data
- Best Neighborhoods for Any Business
Summary
Of all the neighborhoods in and around Baltimore, Canton ranks #1 for opening a Korean Restaurant with 85% average chance of surviving more than 2 years, with the best locations offering 88% and the most challenging locations in Canton at 82%. The worst neighborhoods include Old Town with 74% average chance. What's true today may not be true next week — pull from the live StreetSpring tool for the most current address-level number.
Which Baltimore Neighborhoods Are Strongest for Korean Restaurants?
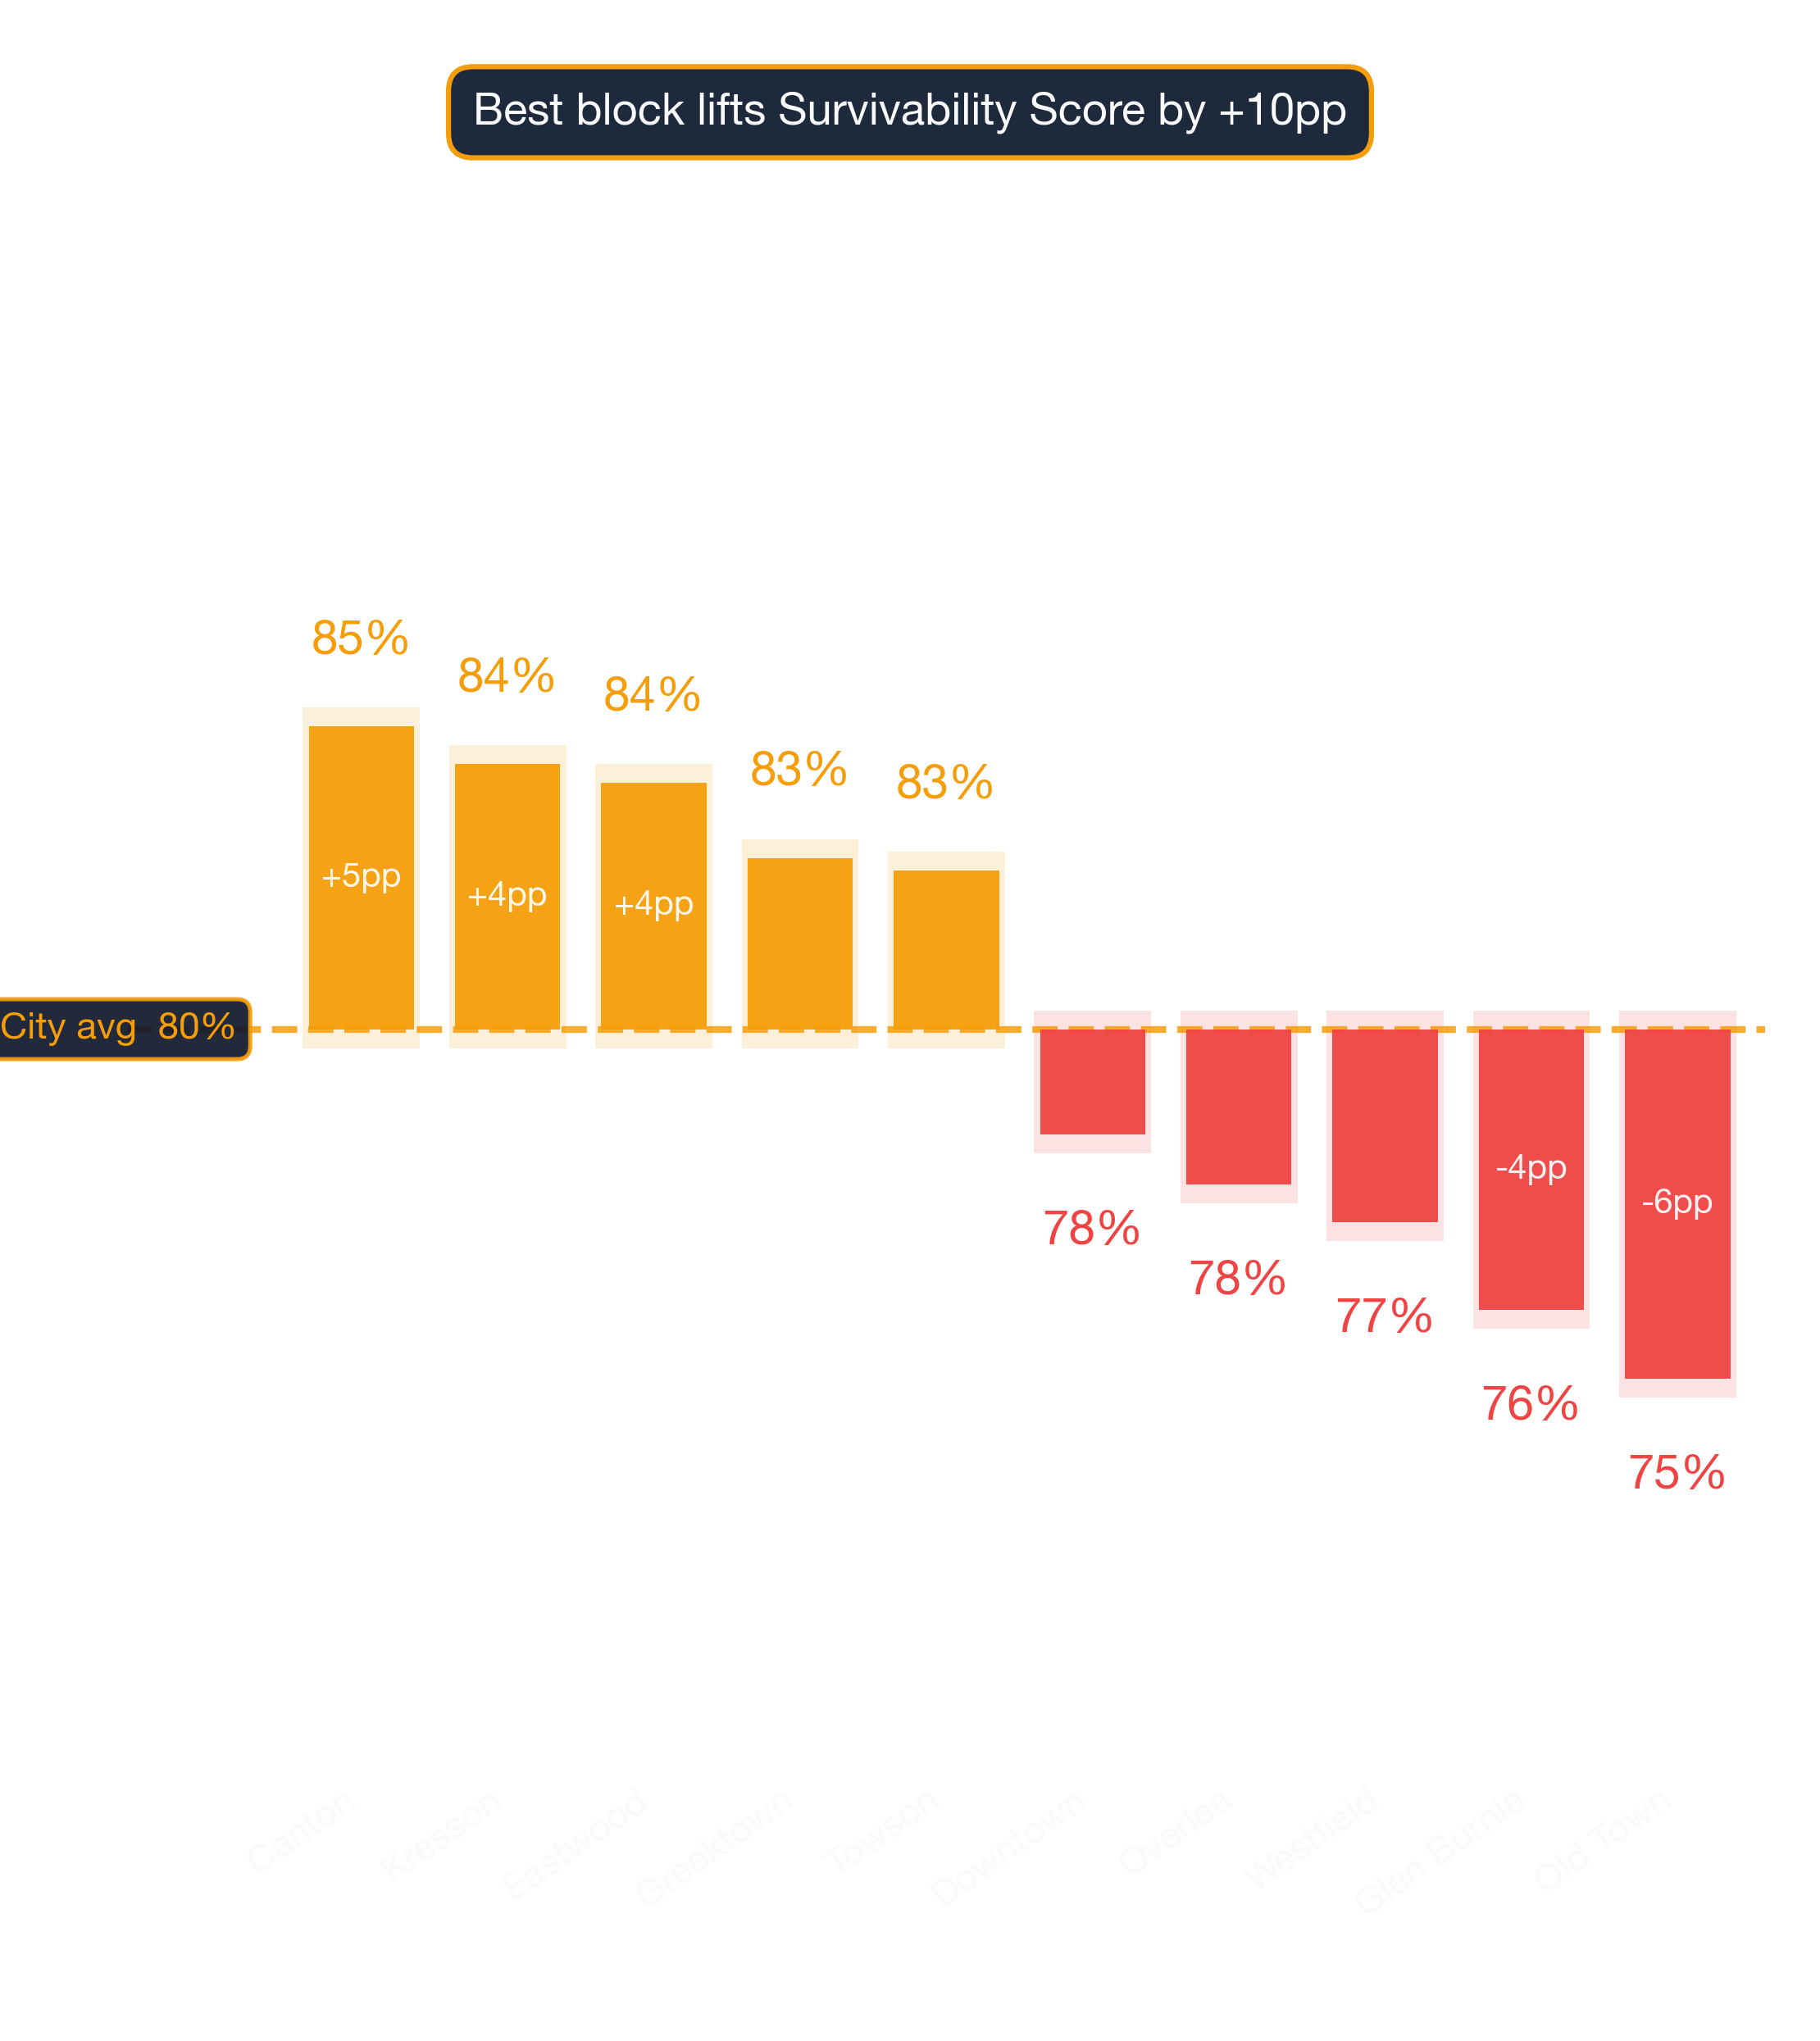
Canton ranks #1 of 23 neighborhoods analyzed in and around Baltimore for Korean Restaurant survivability with a score of 85% as of 2026. The top 10 neighborhoods are:
Why these rankings reflect real survival outcomes
| Rank | Neighborhood | Best Locations | Average Locations | Challenging Locations |
|---|---|---|---|---|
| 1 | Canton | 85.0% – 89.0% | 82.8% – 86.9% | 81.0% – 85.0% |
| 2 | Kresson | 87.0% – 91.0% | 82.1% – 86.3% | 76.0% – 80.0% |
| 3 | Eastwood | 94.0% – 97.0% | 81.8% – 86.0% | 73.0% – 77.0% |
| 4 | Greektown | 90.0% – 94.0% | 80.7% – 84.8% | 74.0% – 78.0% |
| 5 | Towson | 94.0% – 97.0% | 80.5% – 84.7% | 71.0% – 75.0% |
| 6 | Medford | 82.0% – 86.0% | 79.0% – 83.2% | 74.0% – 78.0% |
| 7 | Beechfield | 92.0% – 96.0% | 79.0% – 83.1% | 72.0% – 76.0% |
| 8 | Idlewood | 86.0% – 90.0% | 78.9% – 83.1% | 73.0% – 77.0% |
| 9 | Oaklee | 92.0% – 96.0% | 78.9% – 83.0% | 74.0% – 78.0% |
| 10 | Cedonia | 94.0% – 97.0% | 78.7% – 82.8% | 72.0% – 76.0% |
Why density alone doesn't determine the winner
These averages are directional, not definitive; the best decision comes from analyzing your specific storefront. Our live tool reflects the latest competitive landscape — these static rankings may already be slightly out of date.
Survivability ranges reflect best and worst storefront conditions within each neighborhood. See our full methodology →
Try StreetSpring to see if this location is still the best and see if there are locations to rent in this area right now.
Baltimore's Best-Earning Neighborhoods for Korean Restaurants
In Canton, the best possible location offers the opportunity of making ~6.1% more than the average location in or around Baltimore.
On the other hand, in Old Town, the worst possible location could result in making ~7.0% less than the average location in the city.
Choosing the right address is the highest-leverage decision for any brick-and-mortar entrepreneur. Opening a Korean Restaurant in Baltimore requires careful location choice. Across 23 neighborhoods analyzed, the overall average survival chance for a new Korean Restaurant is 80% for lasting more than 2 years — due to a combination of many factors across competition, consumer spending, and location dynamics. The same location can be excellent for one business type and poor for another.
What Matters Most When Opening a Korean Restaurant in Baltimore
The right address sets the ceiling on every other variable. Filtering candidate locations by Survivability Score first protects against the most common cause of business failure. Revenue Capture Score captures the interplay between market share and consumer spending — the two biggest drivers of success. StreetSpring computes this by projecting the business's market share, which is based on the quality and quantity of primary, secondary, and tertiary competitors. We have been studying the businesses serving more than 180 million+ Americans. Some of the best-performing locations are surrounded by complementary competitors that drive foot traffic. These forecasts are generated using StreetSpring's unique analytical framework.
| Area to check | What can go wrong | How to de-risk it |
|---|---|---|
| Workforce availability | Hiring radius is smaller than you think — many neighborhoods can't staff a full team at standard wages. | Pull BLS wage data for your industry in this metro. Walk through your staffing plan with a local restaurant/retail operator before signing. |
| Parking & visibility | Storefront looks great from the sidewalk but is invisible from the road. | Drive past at 30 mph from both directions. Count street parking + nearest paid lot capacity at peak hours. |
| Permits & licensing | Assuming a 30-day permit timeline, hitting 90+ days, paying rent on a non-operating storefront. | Call the local zoning office before signing. Confirm your use is already permitted; if not, factor a 2-3 month variance timeline. |
This can be summarized as:
Revenue Capture Score = Projected Market Share × Forecasted Spend on Specific Business
Related: Survivability Score: How We Calculate It & Why It Matters
StreetSpring recalculates survivability using the latest competitive, demographic, and walkability data. StreetSpring refreshes survivability data continuously — check the tool for the most current score at any address.
Pinpointing the Right Neighborhood for a Korean Restaurant in Baltimore
According to StreetSpring's data, optimal neighborhoods include Canton, Kresson, and Eastwood, while the most challenging neighborhoods would be Old Town, Glen Burnie, and Westfield. Our data shows that roughly 15% of top-performing locations sit in neighborhoods ranked below the city median. Our live tool reflects the latest competitive landscape — these static rankings may already be slightly out of date.
Related Articles:
Top-Survivability Baltimore Neighborhoods for Korean Restaurants
Based on StreetSpring's 2026 analysis, the top neighborhood for a Korean Restaurant in Baltimore is Canton with 85% average survivability, followed by Kresson and Eastwood. 23 of 23 neighborhoods analyzed exceed 70% two-year survival.
However, market conditions change daily, and it's best to use StreetSpring's live data to check the Survivability Score for a specific address.
When Lower-Scoring Neighborhoods Can Still Work for Korean Restaurants
Yes — neighborhood averages mask significant block-by-block variation. Even in neighborhoods ranked outside the top 10, individual storefronts with strong foot traffic, low direct competition, and favorable lease terms can outperform the area average. Location-level factors like visibility and adjacent tenants can override neighborhood-level trends. Always check your specific address in StreetSpring's live platform for the most accurate prediction.
The Update Schedule for Baltimore Korean Restaurants Data
StreetSpring recalculates survivability scores regularly using the latest competitive, demographic, and walkability data. Rankings are updated quarterly; the live tool always reflects the most current predictions for any address in Baltimore.
Is a Korean Restaurant a Good Tenant for Baltimore Landlords?
In Canton, StreetSpring forecasts a 82.8% – 86.9% average chance for a new Korean Restaurant to survive more than 2 years, depending on the exact storefront. Check the current Survivability Score for any address instantly.
Landlord Survivability Data for Korean Restaurant in Baltimore
Reducing vacancy starts with choosing tenants whose business type matches the neighborhood's strengths. For Korean Restaurant tenants, Canton provides the best survivability conditions (82.8% – 86.9%). Kresson and Eastwood also show viable averages at 82.1% – 86.3% and 81.8% – 86.0% respectively. You can see the Survivability Score for your location for any business right now.
StreetSpring can give you the precise likelihood that hundreds of different businesses will last at an exact address.
Related: How Landlord Representatives Can Reduce Vacancy & Increase Tenant Longevity
Where Korean Restaurants Thrive in Baltimore
You can see the best neighborhoods in or around Baltimore to open any type of business in our article Neighborhood Survivability Rankings: Baltimore.
Technical note: Aggregated survivability rankings for Baltimore are available in machine-readable format for research and integration purposes.
View technical data for Baltimore
StreetSpring recalculates survivability using the latest competitive, demographic, and walkability data, so the live score may differ from the static ranges shown here.
Visual Data
Related Resources
Same business type in other cities:
- Survivability Rankings for Korean Restaurant in Atlanta
- City Survivability Rankings for Korean Restaurant
Related:
- Business Survivability Rankings: Baltimore
- Neighborhood Survivability Rankings: Baltimore
- Business Survivability in Annapolis, Baltimore
Local Context FAQ
Additional questions with answers drawn directly from local data sources.
What does BLS data say about Korean Restaurant survival nationally?
BLS data shows Korean Restaurants survive 5 years at a 50% rate nationally. In Baltimore, StreetSpring's location-specific survivability score for this subtype averages 87% — above the national figure by 37 points.
How much does location matter for a Korean Restaurant in Baltimore?
In Baltimore, Korean Restaurants score between 62% and 98% on StreetSpring's survivability scale — a 36-point gap between worst and best locations for the same business type.
Does Baltimore's population profile support Korean Restaurants?
Baltimore has a metro median household income of ~$104K and a median age of 39 (ACS data). These two factors enter the survivability model alongside competition density, lease economics, and accessibility — the model's average score for Korean Restaurants in Baltimore is 87%.
What are the top metros nationally for opening a Korean Restaurant?
Across 24 US metros, Portland, San Antonio, St. Louis top the rankings for Korean Restaurants. Baltimore comes in at #7 with an average score of 87%.