Survivability Rankings for Japanese / Sushi Restaurant in Baltimore
StreetSpring's 2026 analysis ranks the best and worst neighborhoods in Baltimore to open a Japanese / Sushi Restaurant, from Canton (85% survival) to Ol...
By Bobby Koons | Last reviewed by Bobby Koons on May 11, 2026 | Methodology
Quick Summary
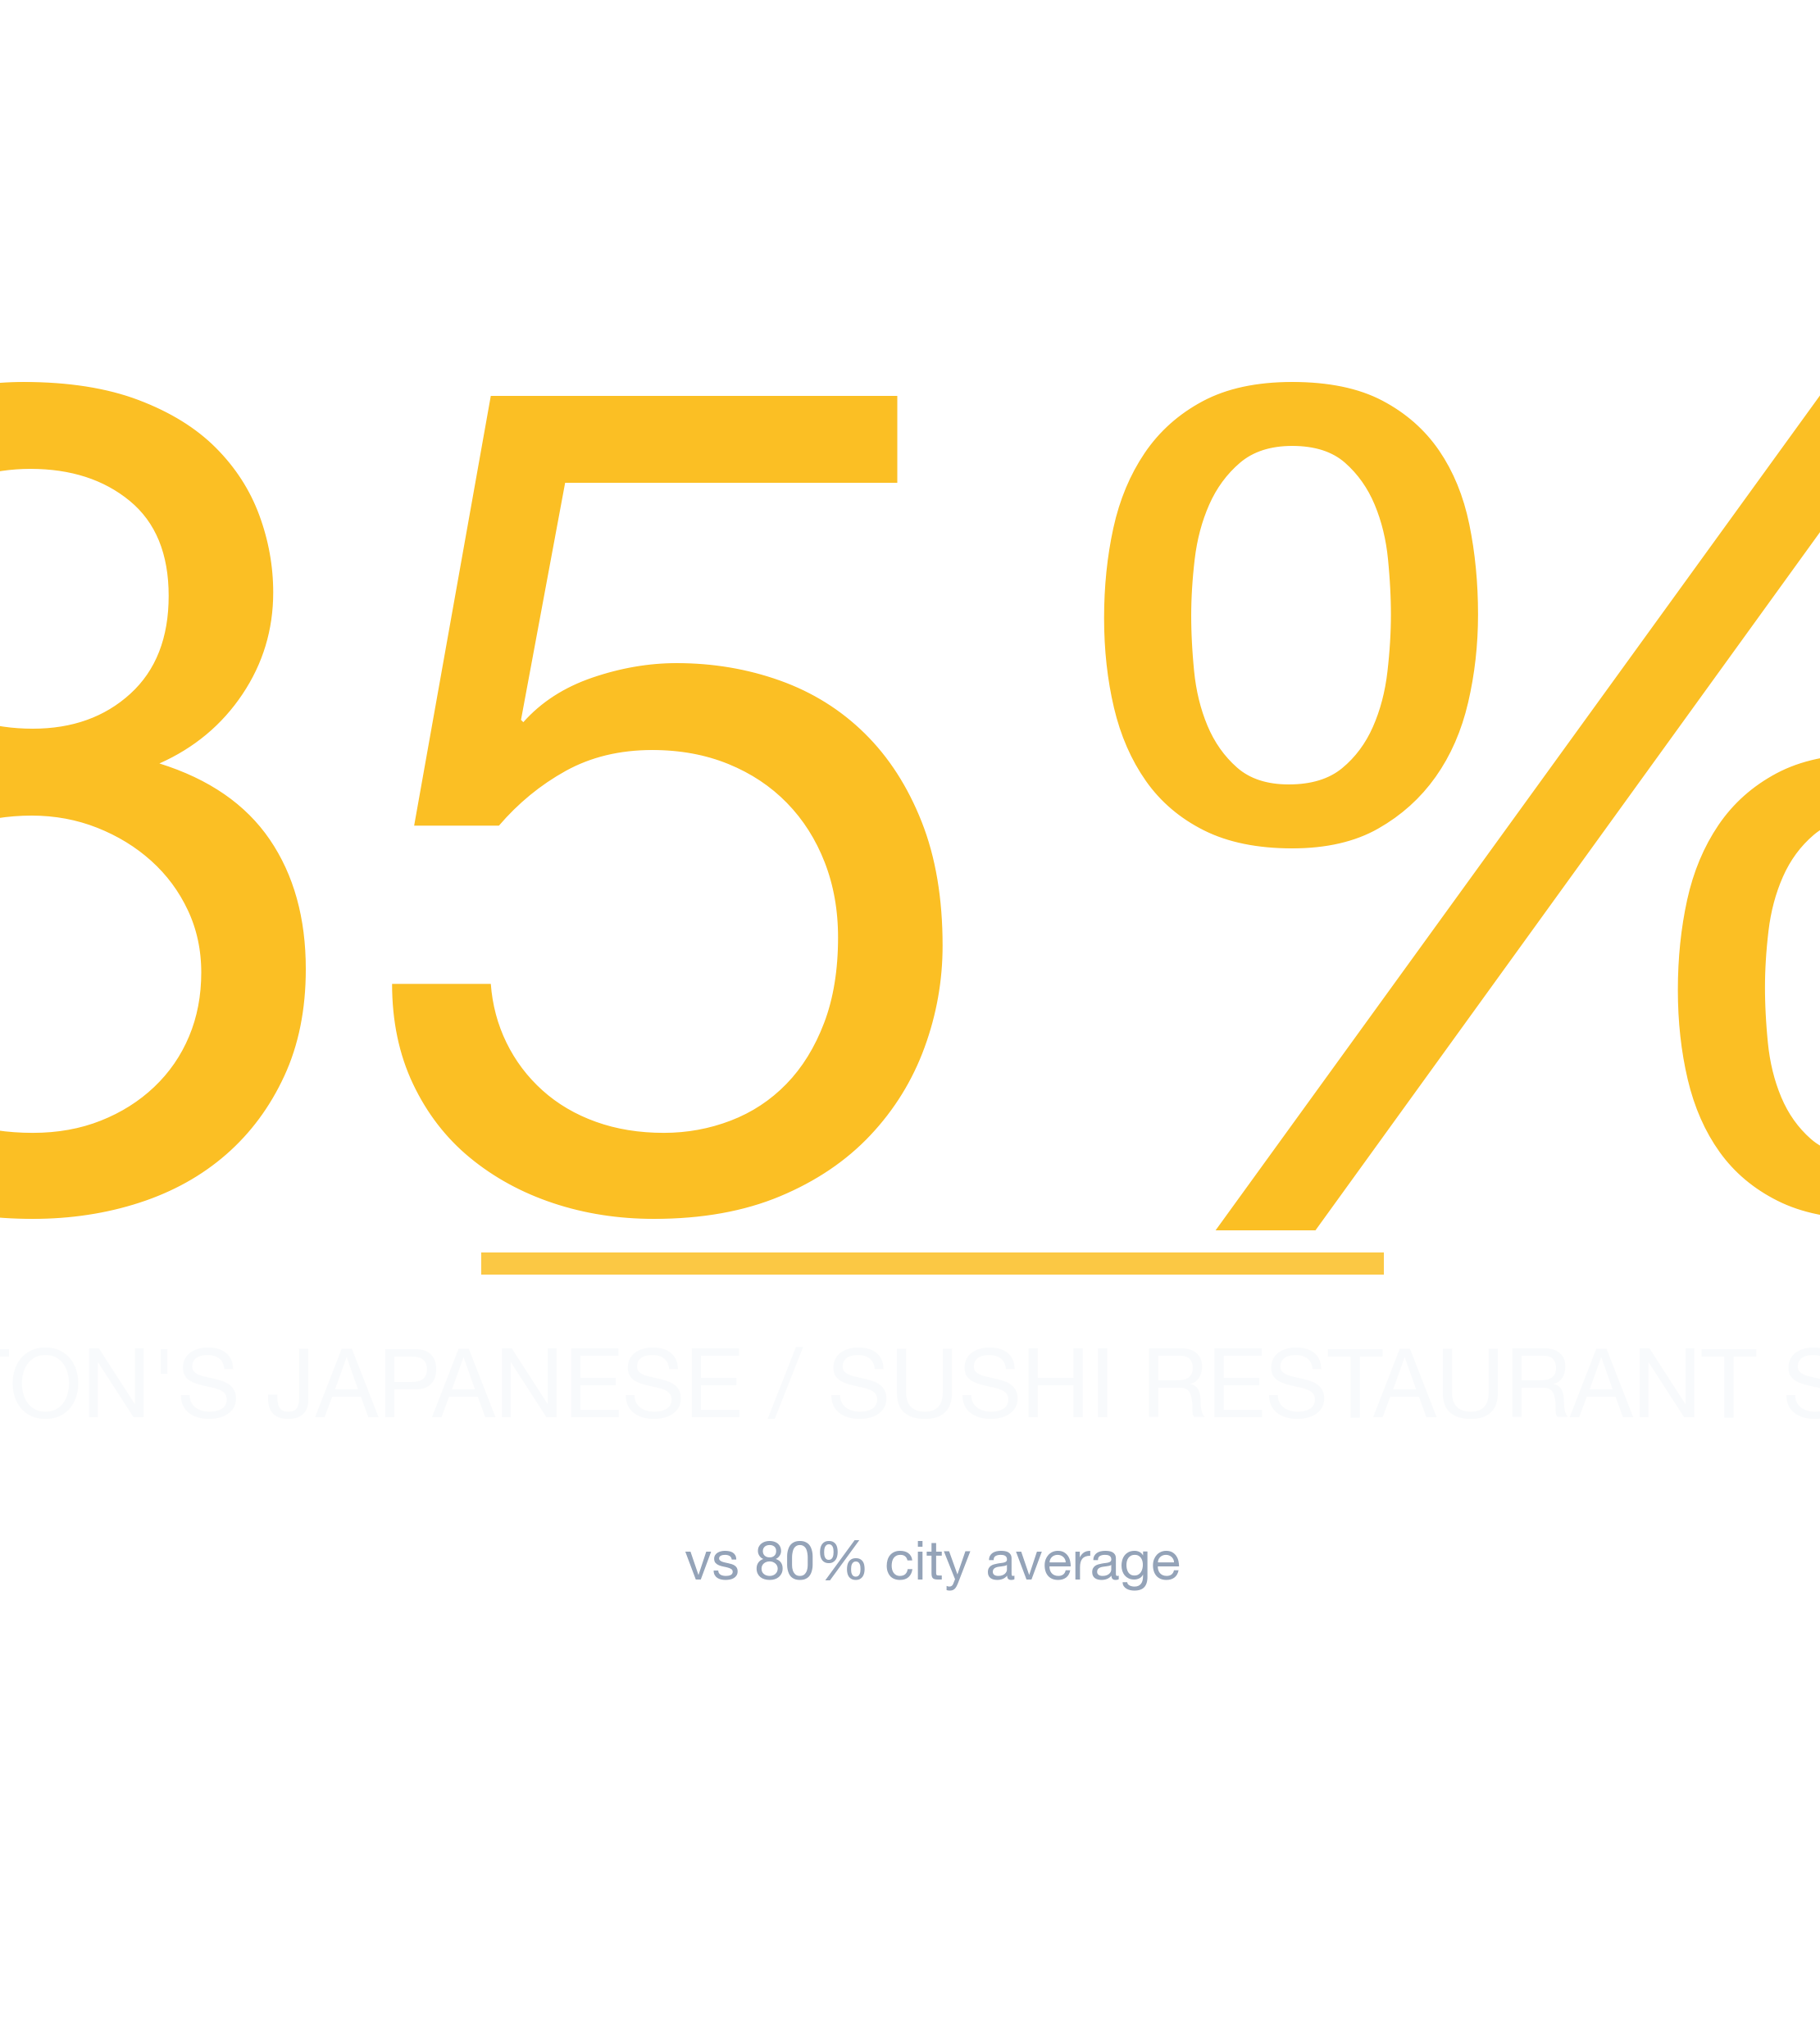
- #1 Neighborhood: Canton — 85% average survivability for Japanese / Sushi Restaurant
- Neighborhoods at or above 70%: 23 of 23 analyzed
- City-wide average: 80% for Japanese / Sushi Restaurants
- Most challenging area: Old Town at 74%
- Revenue advantage (top vs. avg location): ~5.8% more expected revenue in Canton
- Data freshness: 2026 data · Full methodology →
Table of Contents
- Summary
- 10 Best Neighborhoods
- Where Would a Japanese / Sushi Restaurant Make the Most Money?
- What Should I Consider?
- Where Should I Start?
- FAQ: Best Neighborhoods
- FAQ: Can a Japanese / Sushi Restaurant Succeed in Lower-Ranked Areas?
- FAQ: How Often Are Rankings Updated?
- FAQ: Is a Japanese / Sushi Restaurant a Good Tenant?
- Landlord Survivability Data
- Best Neighborhoods for Any Business
Summary
Canton leads Baltimore's 2026 survivability rankings for Japanese / Sushi Restaurant operators with 85% average chance of surviving more than 2 years, with the best locations offering 88% and the most challenging locations in Canton at 82%. The worst neighborhoods include Old Town with 74% average chance. Even neighborhoods with modest average scores can harbor exceptional individual locations.
Which Baltimore Neighborhoods Are Strongest for Japanese / Sushi Restaurants?
Canton ranks #1 of 23 neighborhoods analyzed in and around Baltimore for Japanese / Sushi Restaurant survivability with a score of 85% as of 2026. The top 10 neighborhoods are:
The data signals behind these scores
| Rank | Neighborhood | Best Locations | Average Locations | Challenging Locations |
|---|---|---|---|---|
| 1 | Canton | 85.0% – 89.0% | 82.8% – 86.3% | 81.0% – 85.0% |
| 2 | Kresson | 87.0% – 91.0% | 82.2% – 85.7% | 76.0% – 80.0% |
| 3 | Eastwood | 94.0% – 97.0% | 82.2% – 85.7% | 73.0% – 77.0% |
| 4 | Greektown | 90.0% – 94.0% | 80.8% – 84.3% | 74.0% – 78.0% |
| 5 | Towson | 94.0% – 97.0% | 80.6% – 84.1% | 71.0% – 75.0% |
| 6 | Beechfield | 92.0% – 96.0% | 79.2% – 82.6% | 73.0% – 77.0% |
| 7 | Medford | 82.0% – 86.0% | 79.1% – 82.6% | 75.0% – 79.0% |
| 8 | Oaklee | 92.0% – 96.0% | 79.1% – 82.6% | 74.0% – 78.0% |
| 9 | Cedonia | 94.0% – 97.0% | 79.1% – 82.6% | 72.0% – 76.0% |
| 10 | Idlewood | 86.0% – 90.0% | 79.1% – 82.6% | 73.0% – 77.0% |
Why density alone doesn't determine the winner
Remember that a neighborhood average smooths over wide variation — your exact block could significantly outperform. Market dynamics shift frequently; validate these insights with real-time data from StreetSpring.
Survivability ranges reflect best and worst storefront conditions within each neighborhood. See our full methodology →
Try StreetSpring to see if this location is still the best and see if there are locations to rent in this area right now.
Where in or Around Baltimore Would a Japanese / Sushi Restaurant Make the Most Money?
In Canton, the best possible location offers the opportunity of making ~5.8% more than the average location in or around Baltimore.
On the other hand, in Old Town, the worst possible location could result in making ~7.2% less than the average location in the city.
A great concept in the wrong location will almost always underperform a good concept in the right one. Opening a Japanese / Sushi Restaurant in Baltimore requires careful location choice. Across 23 neighborhoods analyzed, the overall average survival chance for a new Japanese / Sushi Restaurant is 80% for lasting more than 2 years — due to a combination of many factors across competition, consumer spending, and location dynamics. Survivability predictions are business-type-specific because consumer behavior differs fundamentally across categories.
The Most Important Factors for a Japanese / Sushi Restaurant in Baltimore
The strongest predictor of whether this business survives two years is the quality of the location you pick — Survivability Score quantifies exactly that. No other single metric predicts business longevity as reliably as Revenue Capture Score. StreetSpring computes this by projecting the business's market share, which is based on the quality and quantity of primary, secondary, and tertiary competitors. We apply advanced machine learning to massive commercial real estate datasets to build accurate models. Strategic clustering can actually boost performance by creating destination zones. Our proprietary models incorporate data sources not available through any public platform.
| Area to check | What can go wrong | How to de-risk it |
|---|---|---|
| CAM + hidden costs | Stated rent looks great, then CAM fees, signage charges, and after-hours utilities add 15-30%. | Get the full operating expense breakdown for the past 2 years. Ask which costs are landlord-capped vs. uncapped. |
| Workforce availability | Hiring radius is smaller than you think — many neighborhoods can't staff a full team at standard wages. | Pull BLS wage data for your industry in this metro. Walk through your staffing plan with a local restaurant/retail operator before signing. |
| Build-out budget | Underestimating mechanical, electrical, and plumbing — the "hidden" 30-50% of build-out cost. | Get 3 quotes from licensed contractors and pad budget by +20% for surprises. Confirm landlord TI allowance in writing. |
This can be summarized as:
Revenue Capture Score = Projected Market Share × Forecasted Spend on Specific Business
Related: Survivability Score: How We Calculate It & Why It Matters
StreetSpring recalculates survivability using the latest competitive, demographic, and walkability data. The live platform incorporates the most recent foot traffic, competitor, and spending data for your exact address.
The Best Place to Start a Japanese / Sushi Restaurant in Baltimore
According to StreetSpring's data, optimal neighborhoods include Canton, Kresson, and Eastwood, while the most challenging neighborhoods would be Old Town, Glen Burnie, and Westfield. Neighborhood averages mask significant block-by-block variation — always check your specific address. Market dynamics shift frequently; validate these insights with real-time data from StreetSpring.
Related Articles:
Top-Survivability Baltimore Neighborhoods for Japanese / Sushi Restaurants
Based on StreetSpring's 2026 analysis, the top neighborhood for a Japanese / Sushi Restaurant in Baltimore is Canton with 85% average survivability, followed by Kresson and Eastwood. 23 of 23 neighborhoods analyzed exceed 70% two-year survival.
Static rankings provide a useful baseline, but the live tool captures changes that have occurred since publication.
When Lower-Scoring Neighborhoods Can Still Work for Japanese / Sushi Restaurants
Yes — neighborhood averages mask significant block-by-block variation. Even in neighborhoods ranked outside the top 10, individual storefronts with strong foot traffic, low direct competition, and favorable lease terms can outperform the area average. These averages are directional, not definitive; the best decision comes from analyzing your specific storefront. Always check your specific address in StreetSpring's live platform for the most accurate prediction.
When Does StreetSpring Update Baltimore Japanese / Sushi Restaurant Rankings?
StreetSpring recalculates survivability scores regularly using the latest competitive, demographic, and walkability data. Rankings are updated quarterly; the live tool always reflects the most current predictions for any address in Baltimore.
Should You Rent Your Baltimore Storefront to a Japanese / Sushi Restaurant?
In Canton, StreetSpring forecasts a 82.8% – 86.3% average chance for a new Japanese / Sushi Restaurant to survive more than 2 years, depending on the exact storefront. Check the current Survivability Score for any address instantly.
Landlord Survivability Data for Japanese / Sushi Restaurant in Baltimore
Tenant longevity is a top concern for commercial landlords. In Canton, a Japanese / Sushi Restaurant tenant averages 82.8% – 86.3% chance of lasting more than 2 years — the strongest outlook in Baltimore. Kresson follows at 82.2% – 85.7%, while Eastwood shows 82.2% – 85.7%. Get a live Survivability Score for your specific storefront at no cost.
Our models produce survivability scores at the individual address level — not just neighborhood averages.
Related: How Landlord Representatives Can Reduce Vacancy & Increase Tenant Longevity
Where Japanese / Sushi Restaurants Thrive in Baltimore
You can see the best neighborhoods in or around Baltimore to open any type of business in our article Neighborhood Survivability Rankings: Baltimore.
Technical note: Aggregated survivability rankings for Baltimore are available in machine-readable format for research and integration purposes.
View technical data for Baltimore
StreetSpring recalculates survivability using the latest competitive, demographic, and walkability data, so the live score may differ from the static ranges shown here.
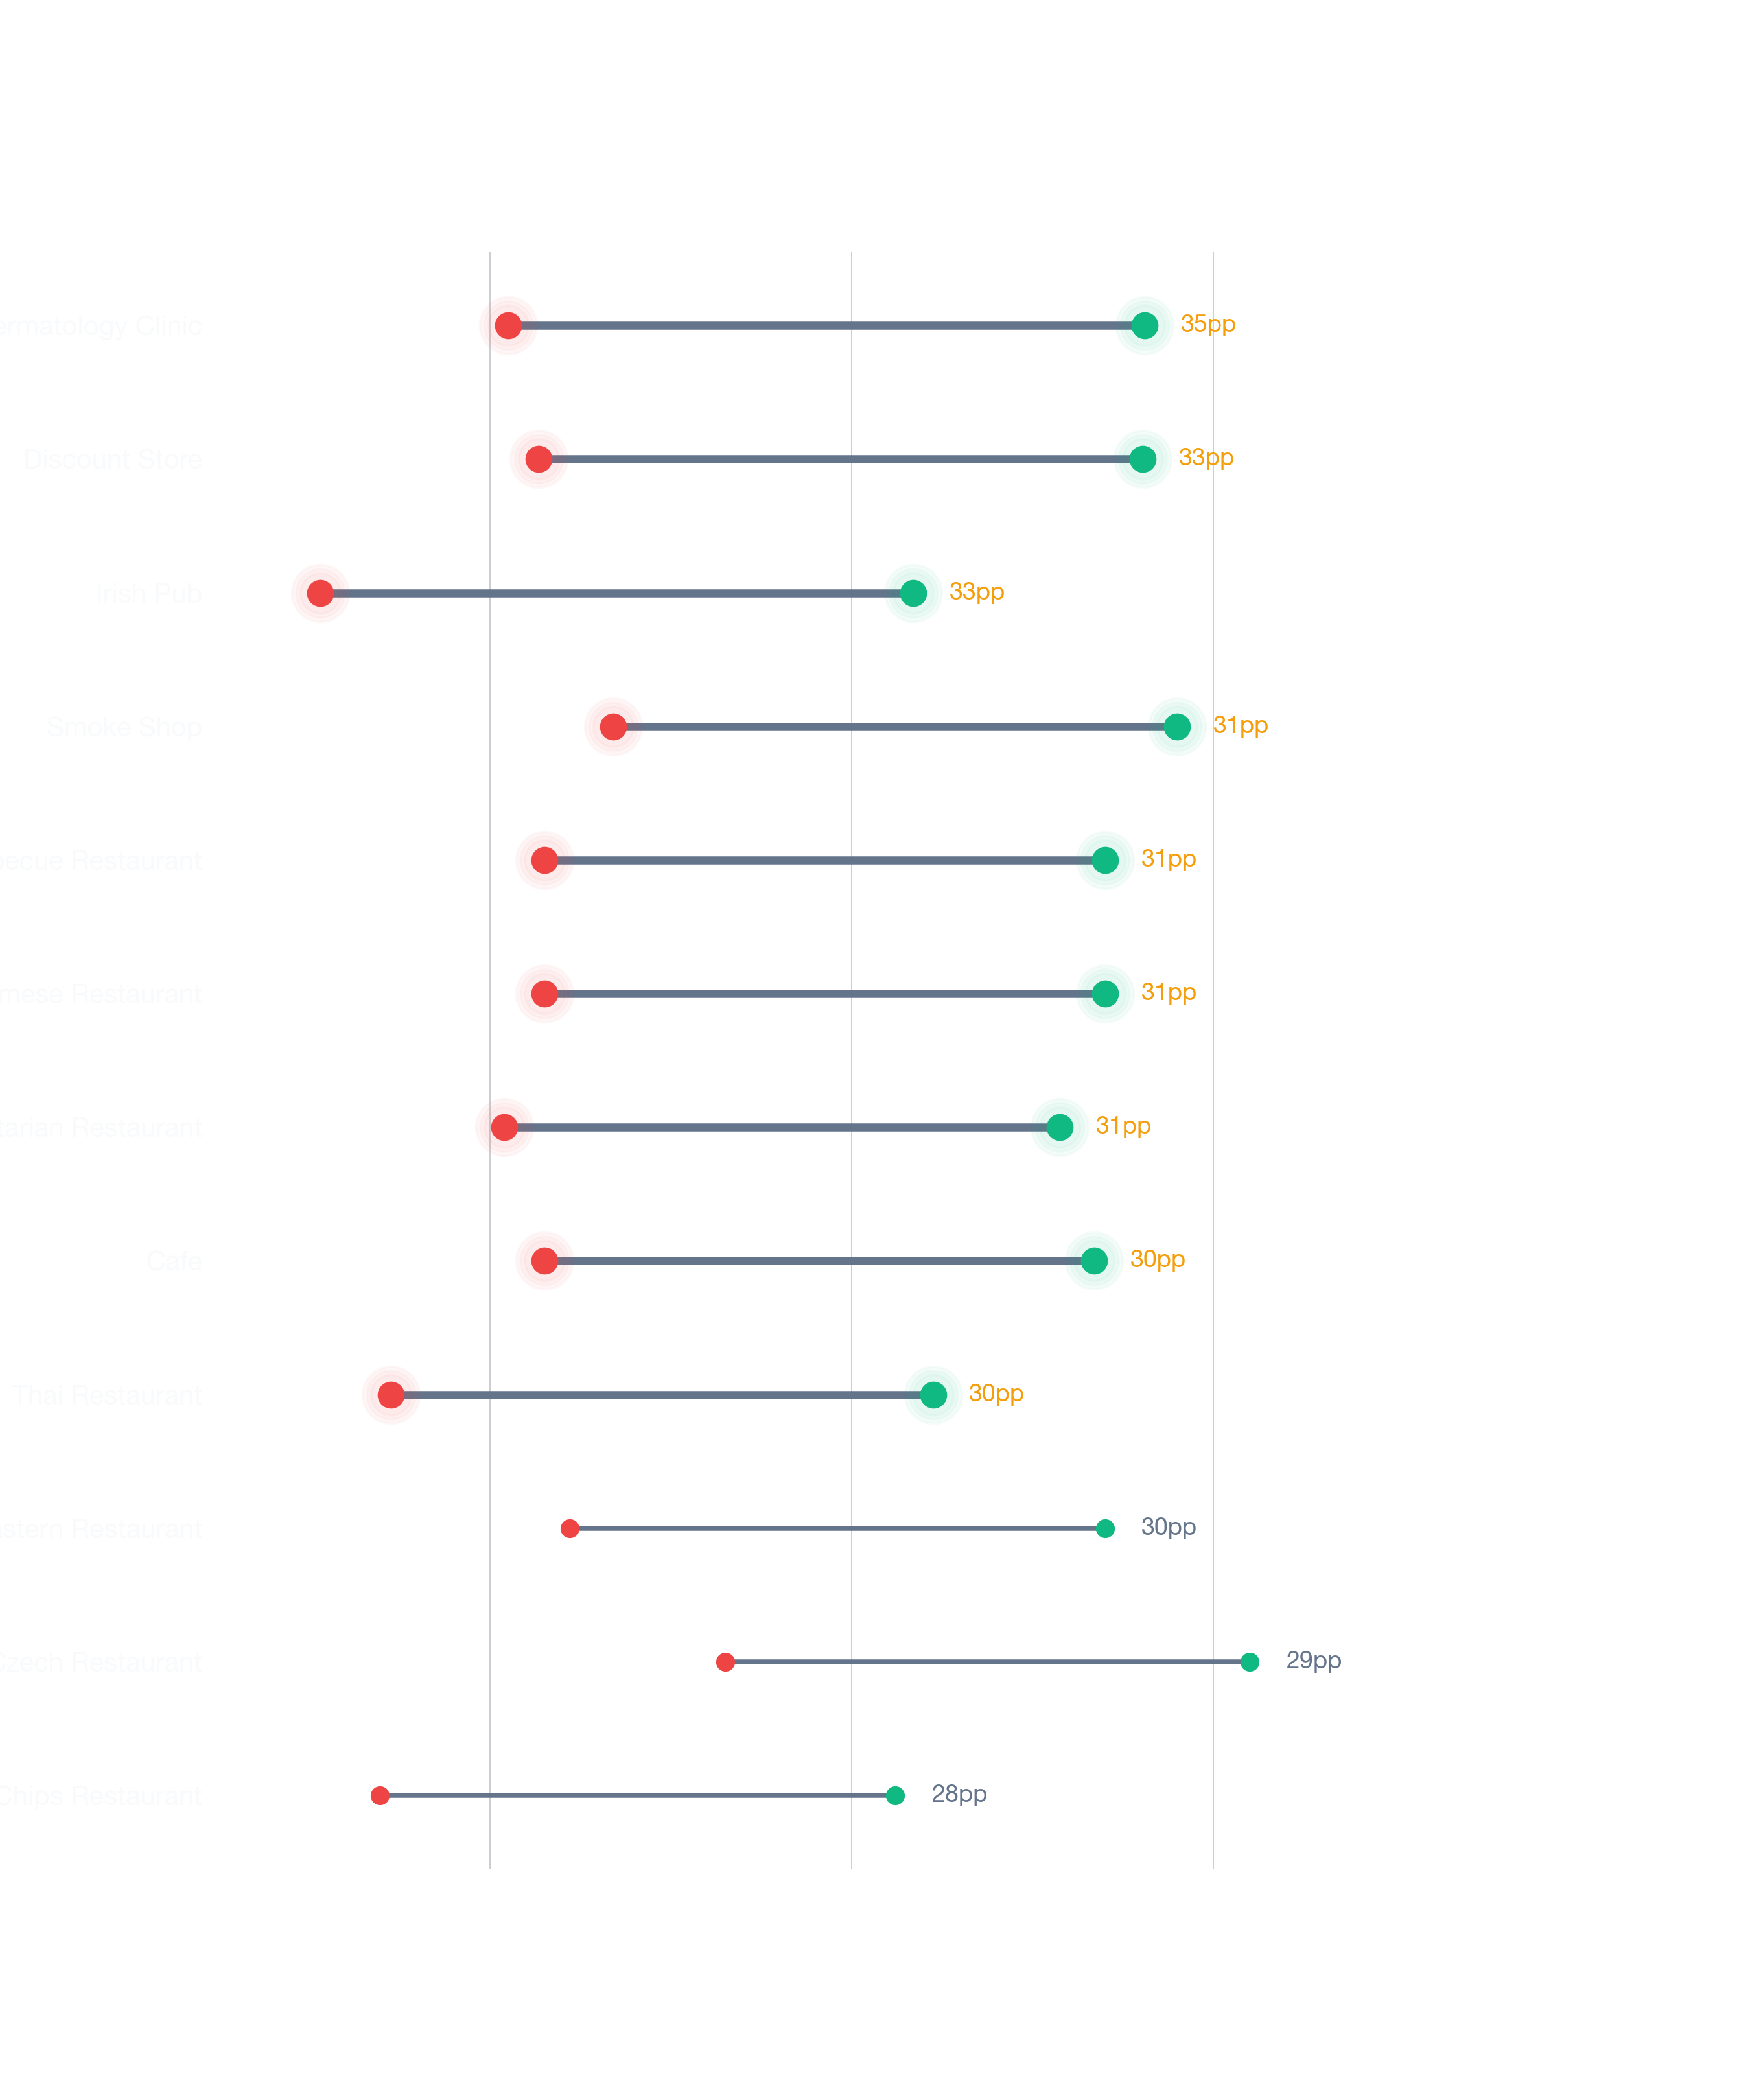
Visual Data
Related Resources
Same business type in other cities:
- Survivability Rankings for Japanese / Sushi Restaurant in Atlanta
- City Survivability Rankings for Japanese / Sushi Restaurant
Related:
- Business Survivability Rankings: Baltimore
- Neighborhood Survivability Rankings: Baltimore
- Business Survivability in Annapolis, Baltimore
Beyond the Numbers: Local Context
Local-context questions, answered with neighborhood-specific numbers.
How is the Japanese / Sushi Restaurants survivability score for Baltimore calculated?
Each Japanese / Sushi Restaurants survivability score in Baltimore (averaging 87%) reflects ~100 factors per address: competitor counts at multiple radii, demographics, accessibility, rent, and historical outcomes. The model is recalibrated quarterly against 500K+ business outcomes nationally.
What are the key demographic factors for Japanese / Sushi Restaurants in Baltimore?
ACS data puts Baltimore's metro median household income at ~$104K and median age at 39. StreetSpring's survivability model factors these alongside ~100 other location signals; the average score for Japanese / Sushi Restaurants in Baltimore is 87%.
Is Baltimore a top-ranked city for a Japanese / Sushi Restaurant?
For Japanese / Sushi Restaurants, Baltimore ranks #7 out of 24 metros with an average survivability score of 87%. The strongest metro tops out at 89%; the weakest at 84%.
Do Japanese / Sushi Restaurants need walkable locations in Baltimore?
Baltimore's metro median commute is 30 minutes. Accessibility is one of ~100 factors in the survivability model — Japanese / Sushi Restaurants in Baltimore score 87% on average, with the spread (61-98%) driven heavily by per-location accessibility differences.