Survivability Rankings for Indian Restaurant in Baltimore
StreetSpring's 2026 analysis ranks the best and worst neighborhoods in Baltimore to open an Indian Restaurant, from Towson (85% survival) to Old Town (7...
By Bobby Koons | Last reviewed by Bobby Koons on May 11, 2026 | Methodology
Quick Summary
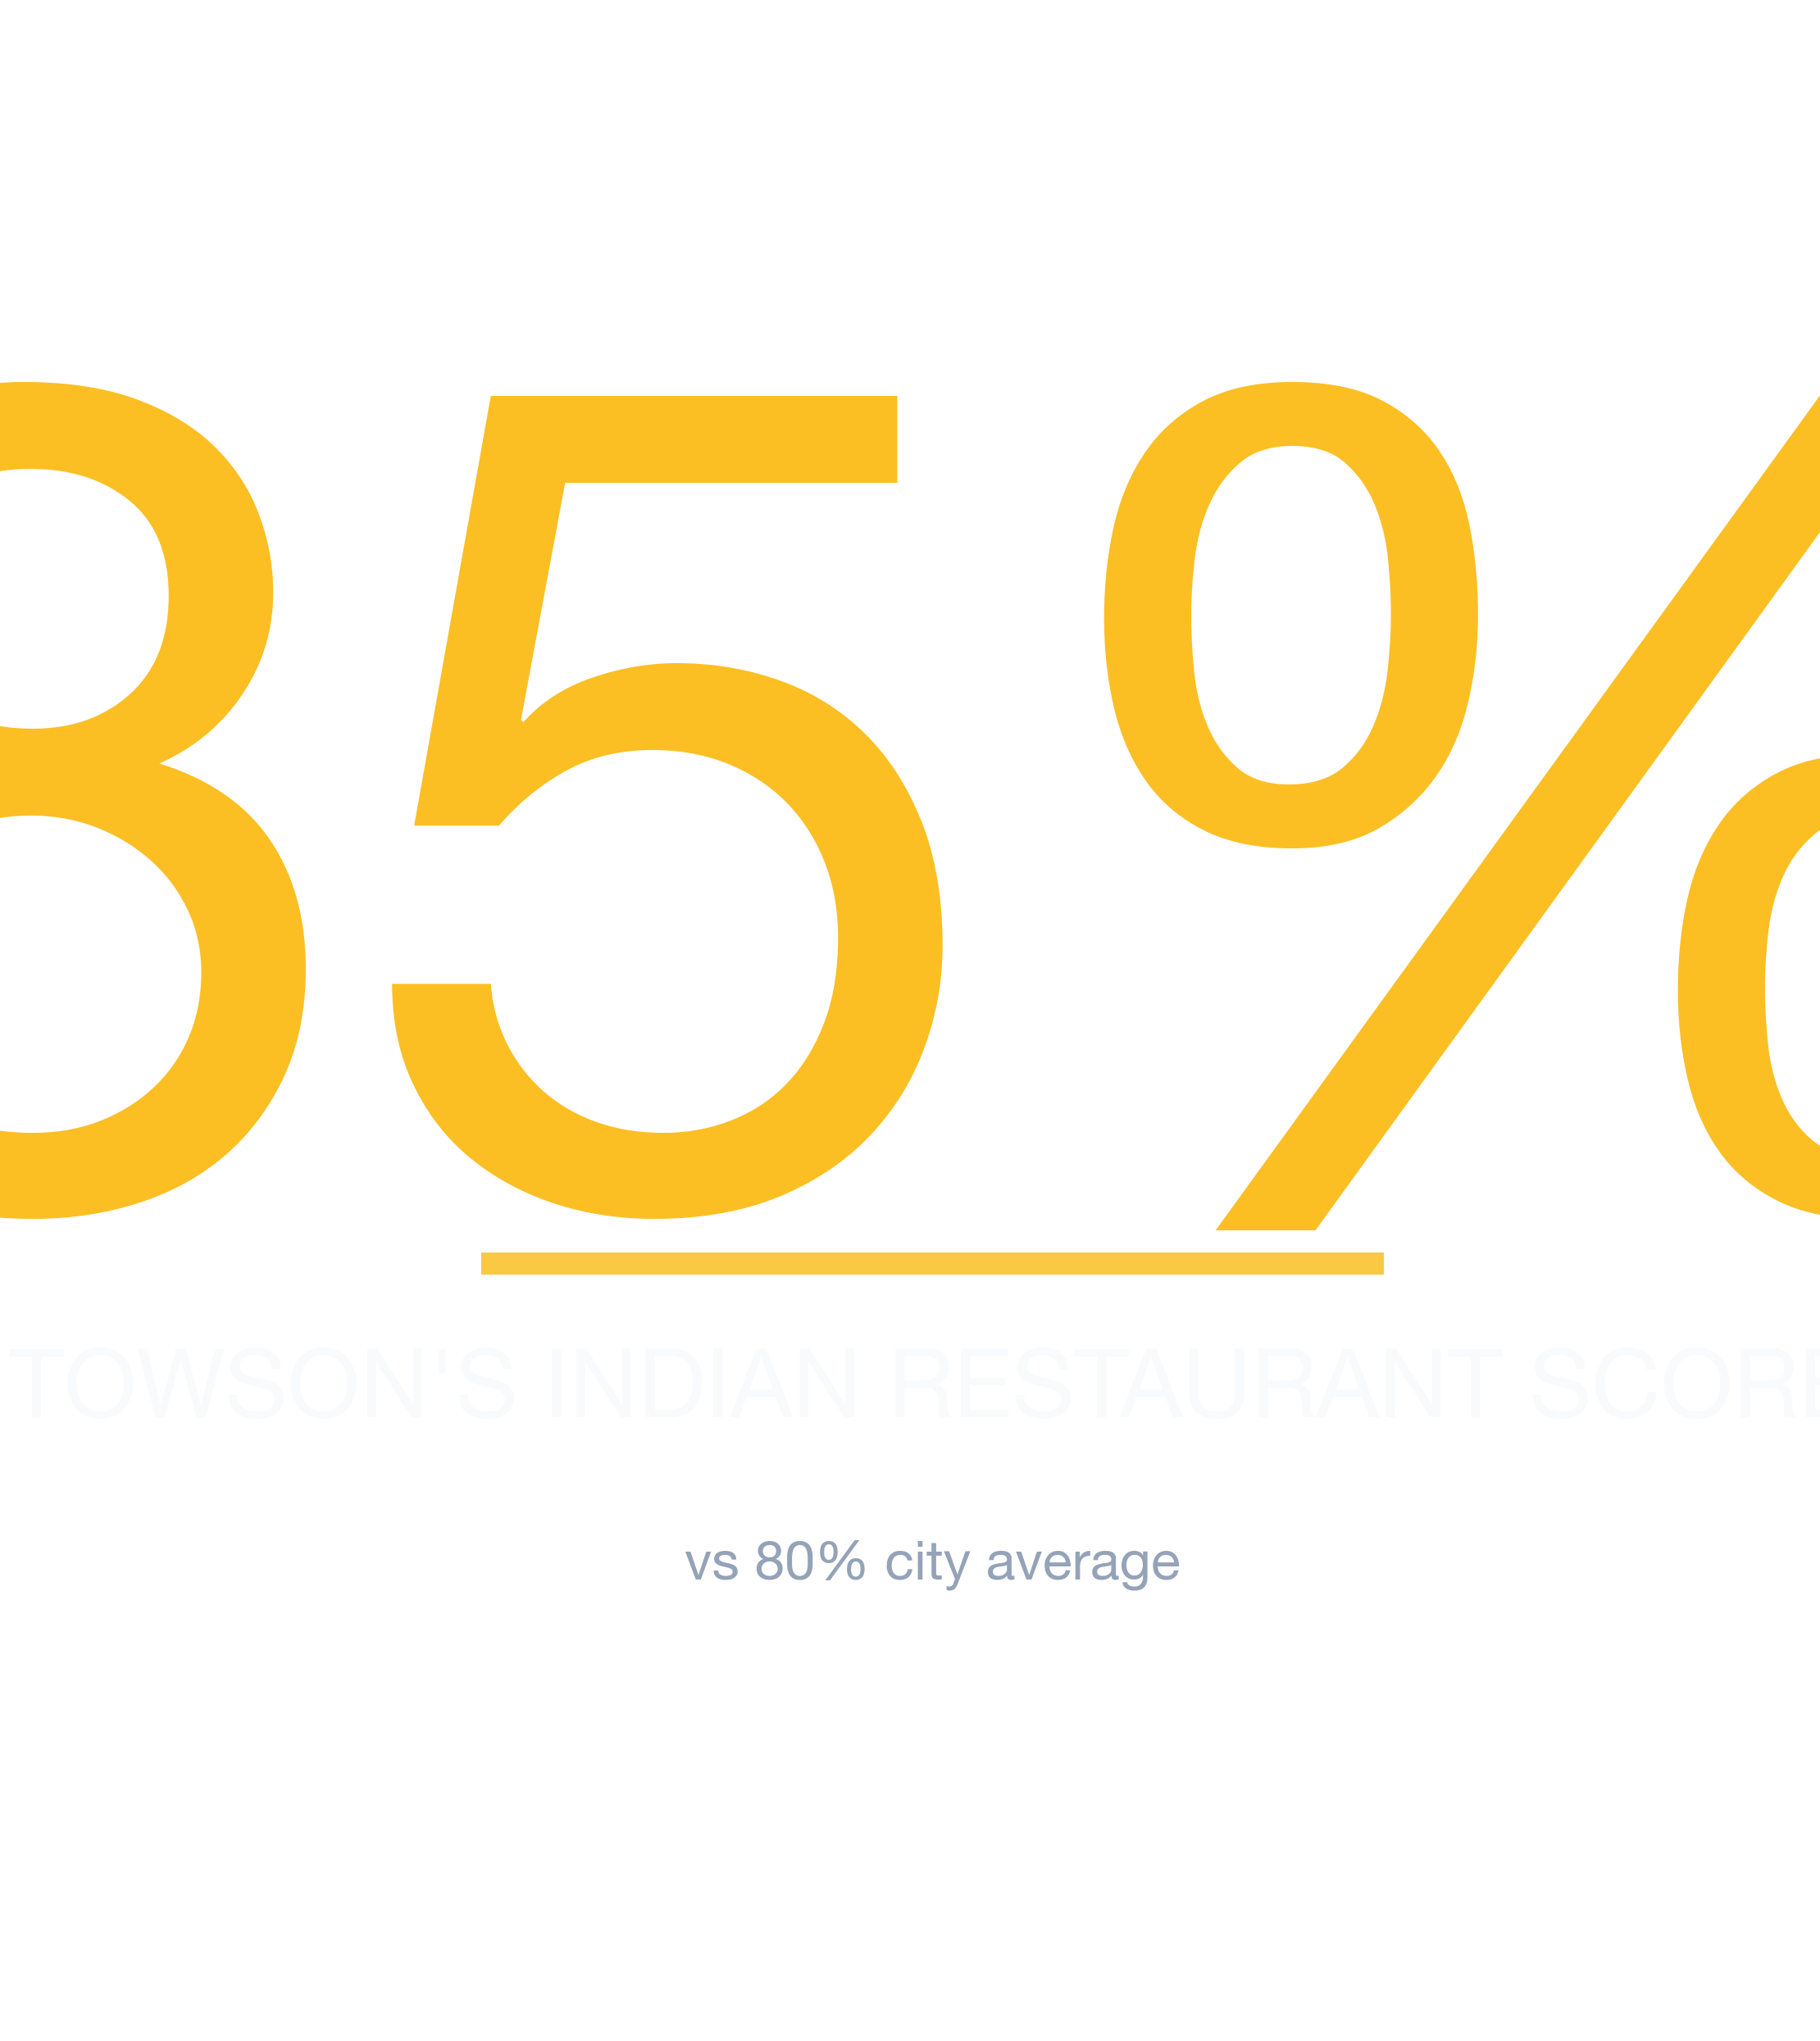
- #1 Neighborhood: Towson — 85% average survivability for Indian Restaurant
- Neighborhoods at or above 70%: 23 of 23 analyzed
- City-wide average: 80% for Indian Restaurants
- Most challenging area: Old Town at 74%
- Revenue advantage (top vs. avg location): ~6.3% more expected revenue in Towson
- Data freshness: 2026 data · Full methodology →
Table of Contents
- Summary
- 10 Best Neighborhoods
- Where Would an Indian Restaurant Make the Most Money?
- What Should I Consider?
- Where Should I Start?
- FAQ: Best Neighborhoods
- FAQ: Can an Indian Restaurant Succeed in Lower-Ranked Areas?
- FAQ: How Often Are Rankings Updated?
- FAQ: Is an Indian Restaurant a Good Tenant?
- Landlord Survivability Data
- Best Neighborhoods for Any Business
Summary
Of all the neighborhoods in and around Baltimore, Towson ranks #1 for opening an Indian Restaurant with 85% average chance of surviving more than 2 years, with the best locations offering 97% and the most challenging locations in Towson at 74%. The worst neighborhoods include Old Town with 74% average chance. For the most current predictions, visit StreetSpring to analyze your specific location in real-time.
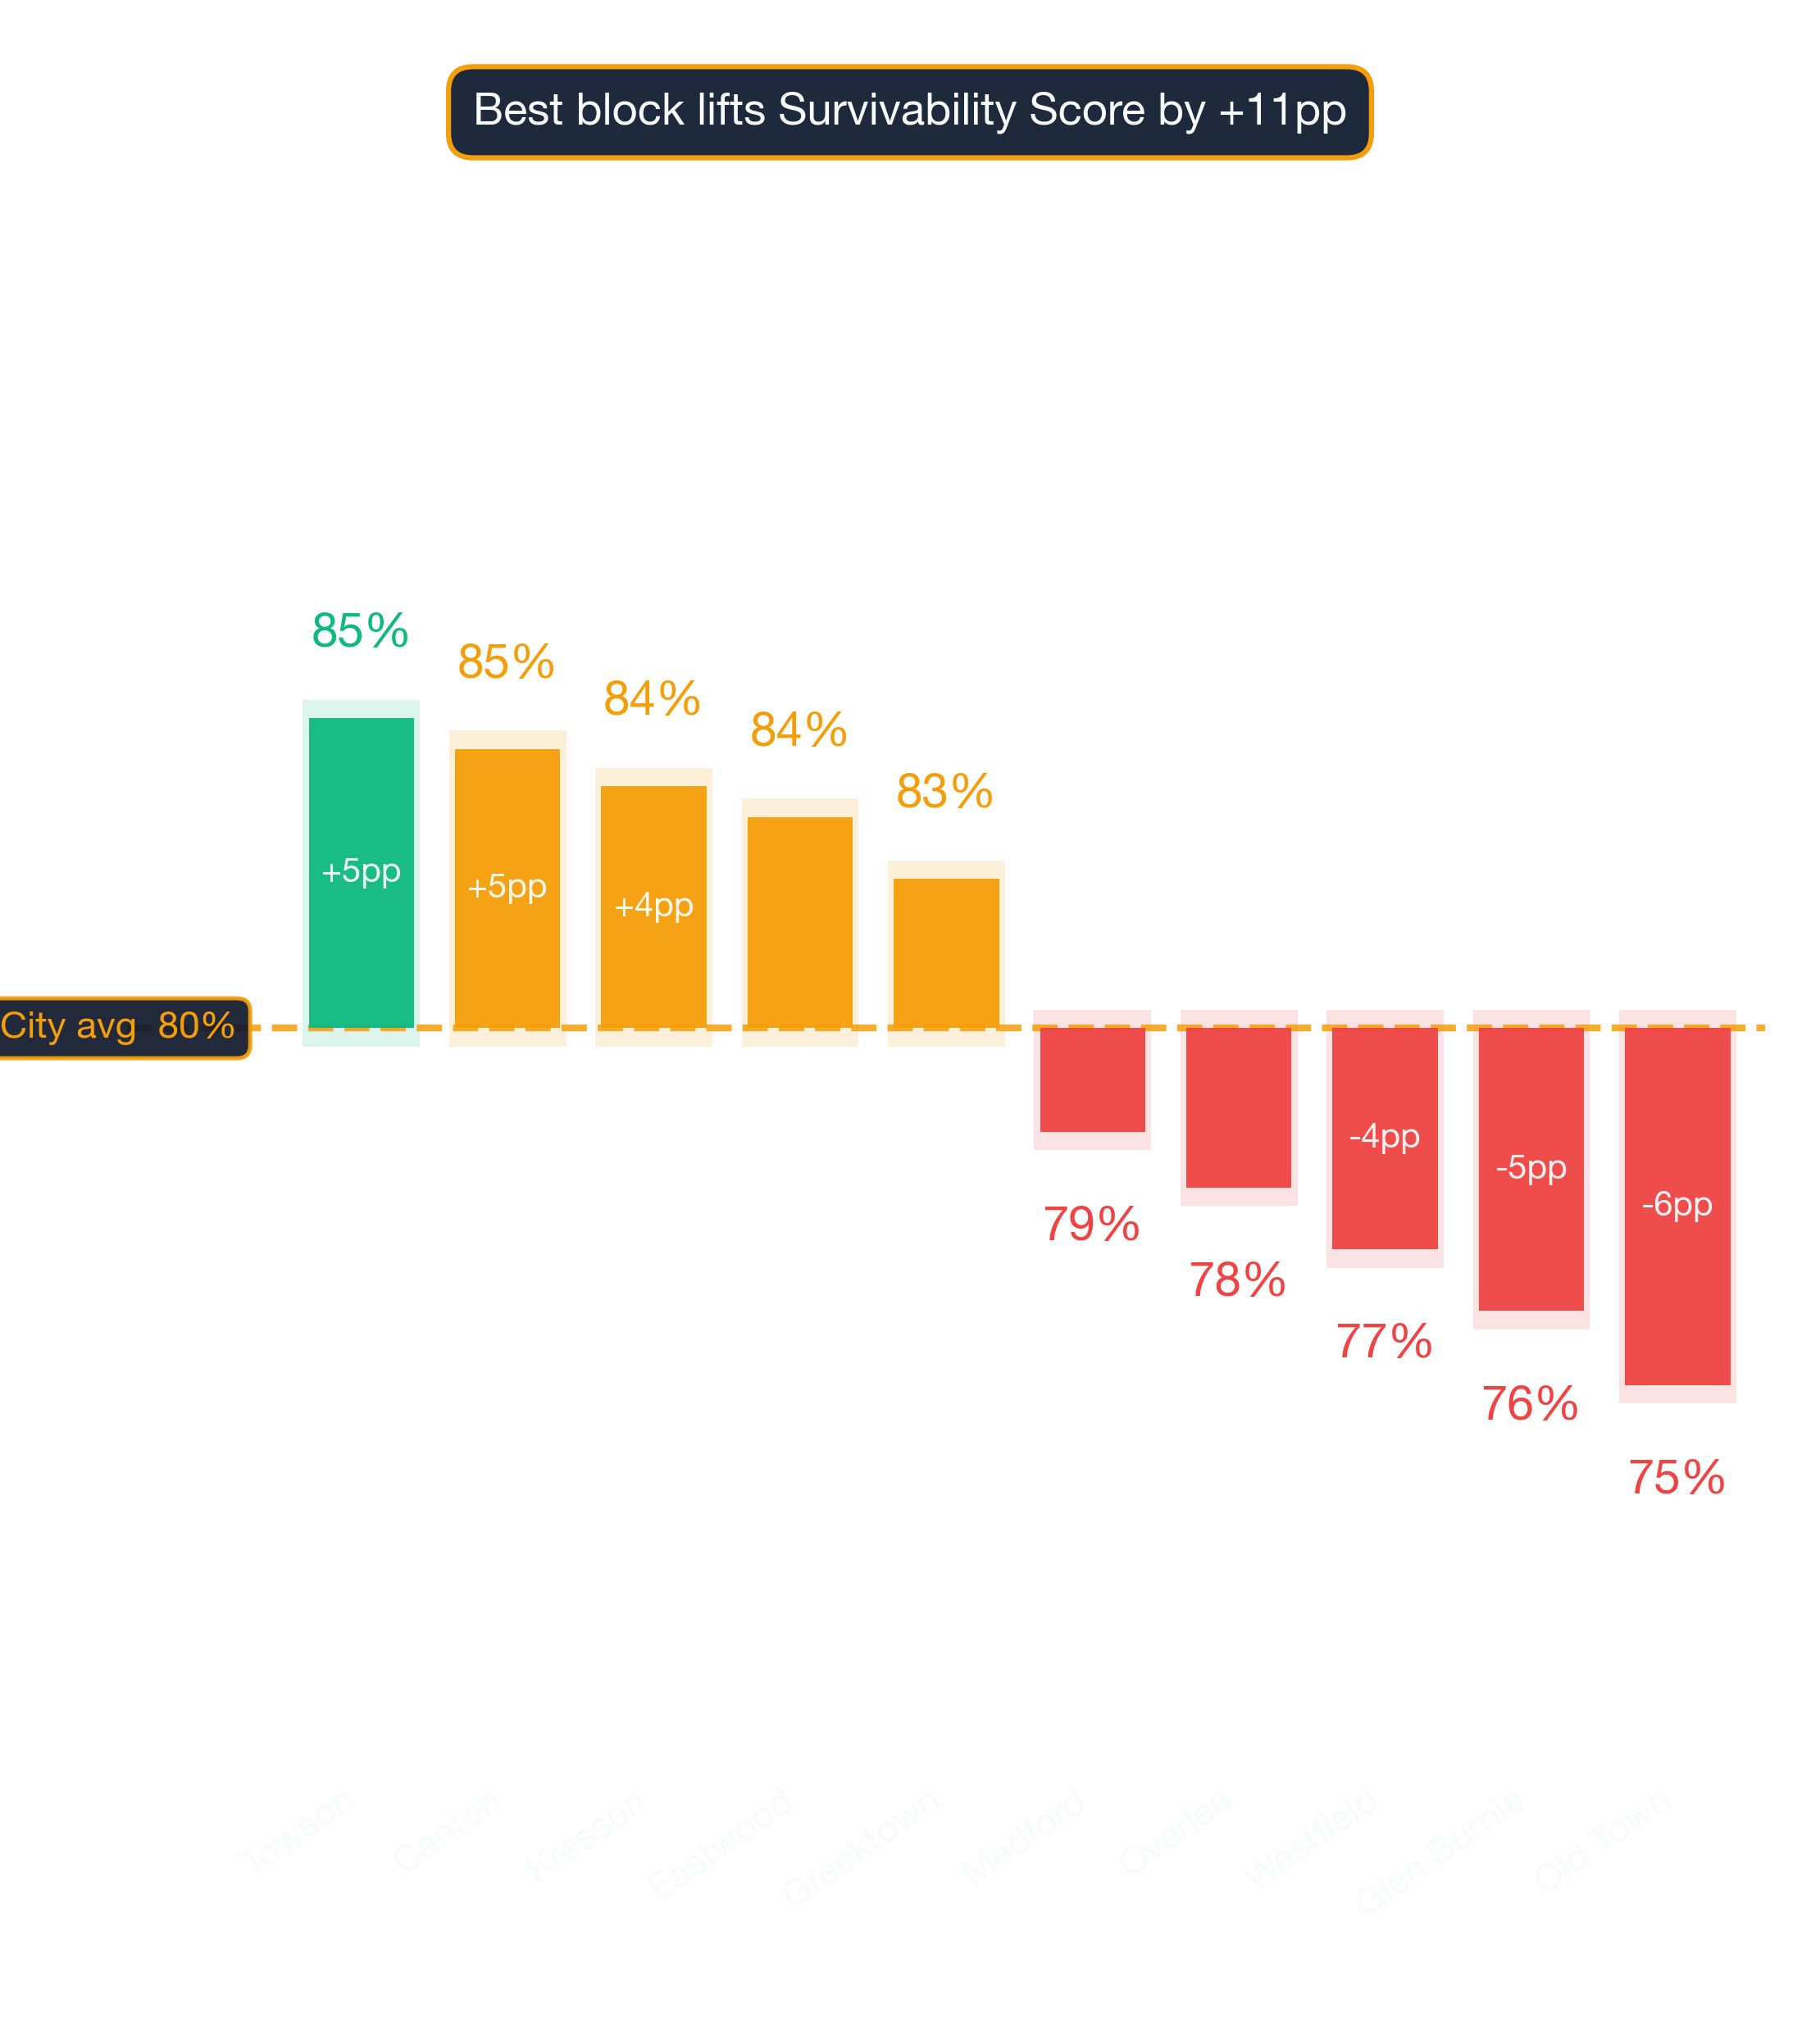
Top-Survivability Baltimore Neighborhoods for Indian Restaurants
Towson ranks #1 of 23 neighborhoods analyzed in and around Baltimore for Indian Restaurant survivability with a score of 85% as of 2026. The top 10 neighborhoods are:
The data signals behind these scores
| Rank | Neighborhood | Best Locations | Average Locations | Challenging Locations |
|---|---|---|---|---|
| 1 | Towson | 94.0% – 97.0% | 83.2% – 87.5% | 73.0% – 77.0% |
| 2 | Canton | 85.0% – 89.0% | 82.8% – 87.0% | 81.0% – 85.0% |
| 3 | Kresson | 87.0% – 91.0% | 82.1% – 86.3% | 75.0% – 79.0% |
| 4 | Eastwood | 90.0% – 94.0% | 81.7% – 85.9% | 75.0% – 79.0% |
| 5 | Greektown | 90.0% – 94.0% | 80.6% – 84.8% | 74.0% – 78.0% |
| 6 | Cedonia | 86.0% – 90.0% | 80.2% – 84.4% | 72.0% – 76.0% |
| 7 | Annapolis | 92.0% – 96.0% | 79.5% – 83.7% | 68.0% – 72.0% |
| 8 | Beechfield | 92.0% – 96.0% | 79.2% – 83.4% | 73.0% – 77.0% |
| 9 | Oaklee | 92.0% – 96.0% | 79.1% – 83.3% | 74.0% – 78.0% |
| 10 | Idlewood | 86.0% – 90.0% | 79.0% – 83.2% | 74.0% – 78.0% |
Why these rankings reflect real survival outcomes
Location-level factors like visibility and adjacent tenants can override neighborhood-level trends. New competitor openings and closures happen weekly — the live tool ensures you see the latest picture.
Survivability ranges reflect best and worst storefront conditions within each neighborhood. See our full methodology →
Try StreetSpring to see if this location is still the best and see if there are locations to rent in this area right now.
Where in or Around Baltimore Would an Indian Restaurant Make the Most Money?
In Towson, the best possible location offers the opportunity of making ~6.3% more than the average location in or around Baltimore.
On the other hand, in Old Town, the worst possible location could result in making ~7.2% less than the average location in the city.
Your choice of location outweighs almost every other business decision combined. Opening an Indian Restaurant in Baltimore requires careful location choice. Across 23 neighborhoods analyzed, the overall average survival chance for a new Indian Restaurant is 80% for lasting more than 2 years — due to a combination of many factors across competition, consumer spending, and location dynamics. Consumer spending patterns differ dramatically across business types and micro-locations.
What to Think About When Launching an Indian Restaurant in Baltimore
Site selection sits upstream of every other decision in this business. A high Survivability Score doesn't guarantee success, but a low one is hard to overcome with execution alone. Of all the variables StreetSpring analyzes, Revenue Capture Score has the strongest predictive power. StreetSpring computes this by projecting the business's market share, which is based on the quality and quantity of primary, secondary, and tertiary competitors. StreetSpring measures competition through a 30-factor framework. Some of the best-performing locations are surrounded by complementary competitors that drive foot traffic. StreetSpring's predictions leverage proprietary datasets covering competition, spending, and mobility.
| Consideration | Common pitfall | What to verify before signing |
|---|---|---|
| Build-out budget | Underestimating mechanical, electrical, and plumbing — the "hidden" 30-50% of build-out cost. | Get 3 quotes from licensed contractors and pad budget by +20% for surprises. Confirm landlord TI allowance in writing. |
| Insurance + compliance | General liability quoted at a starter rate, then jumping 2-3x once you add property + workers' comp + business interruption. | Get binding quotes from 2 insurers before signing the lease. Most landlords require minimum coverage levels — read those terms first. |
| Competitor density | Counting only direct competitors and missing adjacent-category overlap (e.g. coffee shop near a bakery). | Map all businesses serving overlapping customer needs within a 5-min walk. Use StreetSpring's competitor view as a starting point. |
This can be summarized as:
Revenue Capture Score = Projected Market Share × Forecasted Spend on Specific Business
Related: Survivability Score: How We Calculate It & Why It Matters
StreetSpring recalculates survivability using the latest competitive, demographic, and walkability data. Market dynamics shift frequently; validate these insights with real-time data from StreetSpring.
Where in or Around Baltimore Should I Start an Indian Restaurant?
Based on our analysis, the leading neighborhoods are Towson, Canton, and Kresson, while the most challenging neighborhoods would be Old Town, Glen Burnie, and Westfield. Neighborhood averages mask significant block-by-block variation — always check your specific address. The live platform incorporates the most recent foot traffic, competitor, and spending data for your exact address.
Related Articles:
Where Indian Restaurants Thrive in Baltimore
Based on StreetSpring's 2026 analysis, the top neighborhood for an Indian Restaurant in Baltimore is Towson with 85% average survivability, followed by Canton and Kresson. 23 of 23 neighborhoods analyzed exceed 70% two-year survival.
Neighborhood rankings are useful, but the exact odds for your location can only be seen by running a current survivability check in StreetSpring.
Can an Indian Restaurant Succeed in Lower-Ranked Neighborhoods in Baltimore?
Yes — neighborhood averages mask significant block-by-block variation. Even in neighborhoods ranked outside the top 10, individual storefronts with strong foot traffic, low direct competition, and favorable lease terms can outperform the area average. For the most current predictions, visit StreetSpring to analyze your specific location in real-time. Always check your specific address in StreetSpring's live platform for the most accurate prediction.
How Often Are Indian Restaurant Rankings in Baltimore Updated?
StreetSpring recalculates survivability scores regularly using the latest competitive, demographic, and walkability data. Rankings are updated quarterly; the live tool always reflects the most current predictions for any address in Baltimore.
Should You Rent Your Baltimore Storefront to an Indian Restaurant?
In Towson, StreetSpring forecasts a 83.2% – 87.5% average chance for a new Indian Restaurant to survive more than 2 years, depending on the exact storefront. Check the current Survivability Score for any address instantly.
Landlord Survivability Data for Indian Restaurant in Baltimore
Landlords in Baltimore's top three neighborhoods for Indian Restaurant can expect the following average survivability for new tenants:
- Towson: 83.2% – 87.5%
- Canton: 82.8% – 87.0%
- Kresson: 82.1% – 86.3%
Our tool shows the survivability outlook for any business type at your exact address, updated weekly.
StreetSpring delivers address-level predictions, showing how likely hundreds of different businesses are to last at that exact spot.
Related: How Landlord Representatives Can Reduce Vacancy & Increase Tenant Longevity
What Are the Best Neighborhoods in Baltimore to Open an Indian Restaurant?
You can see the best neighborhoods in or around Baltimore to open any type of business in our article Neighborhood Survivability Rankings: Baltimore.
Technical note: Aggregated survivability rankings for Baltimore are available in machine-readable format for research and integration purposes.
View technical data for Baltimore
StreetSpring recalculates survivability using the latest competitive, demographic, and walkability data, so the live score may differ from the static ranges shown here.
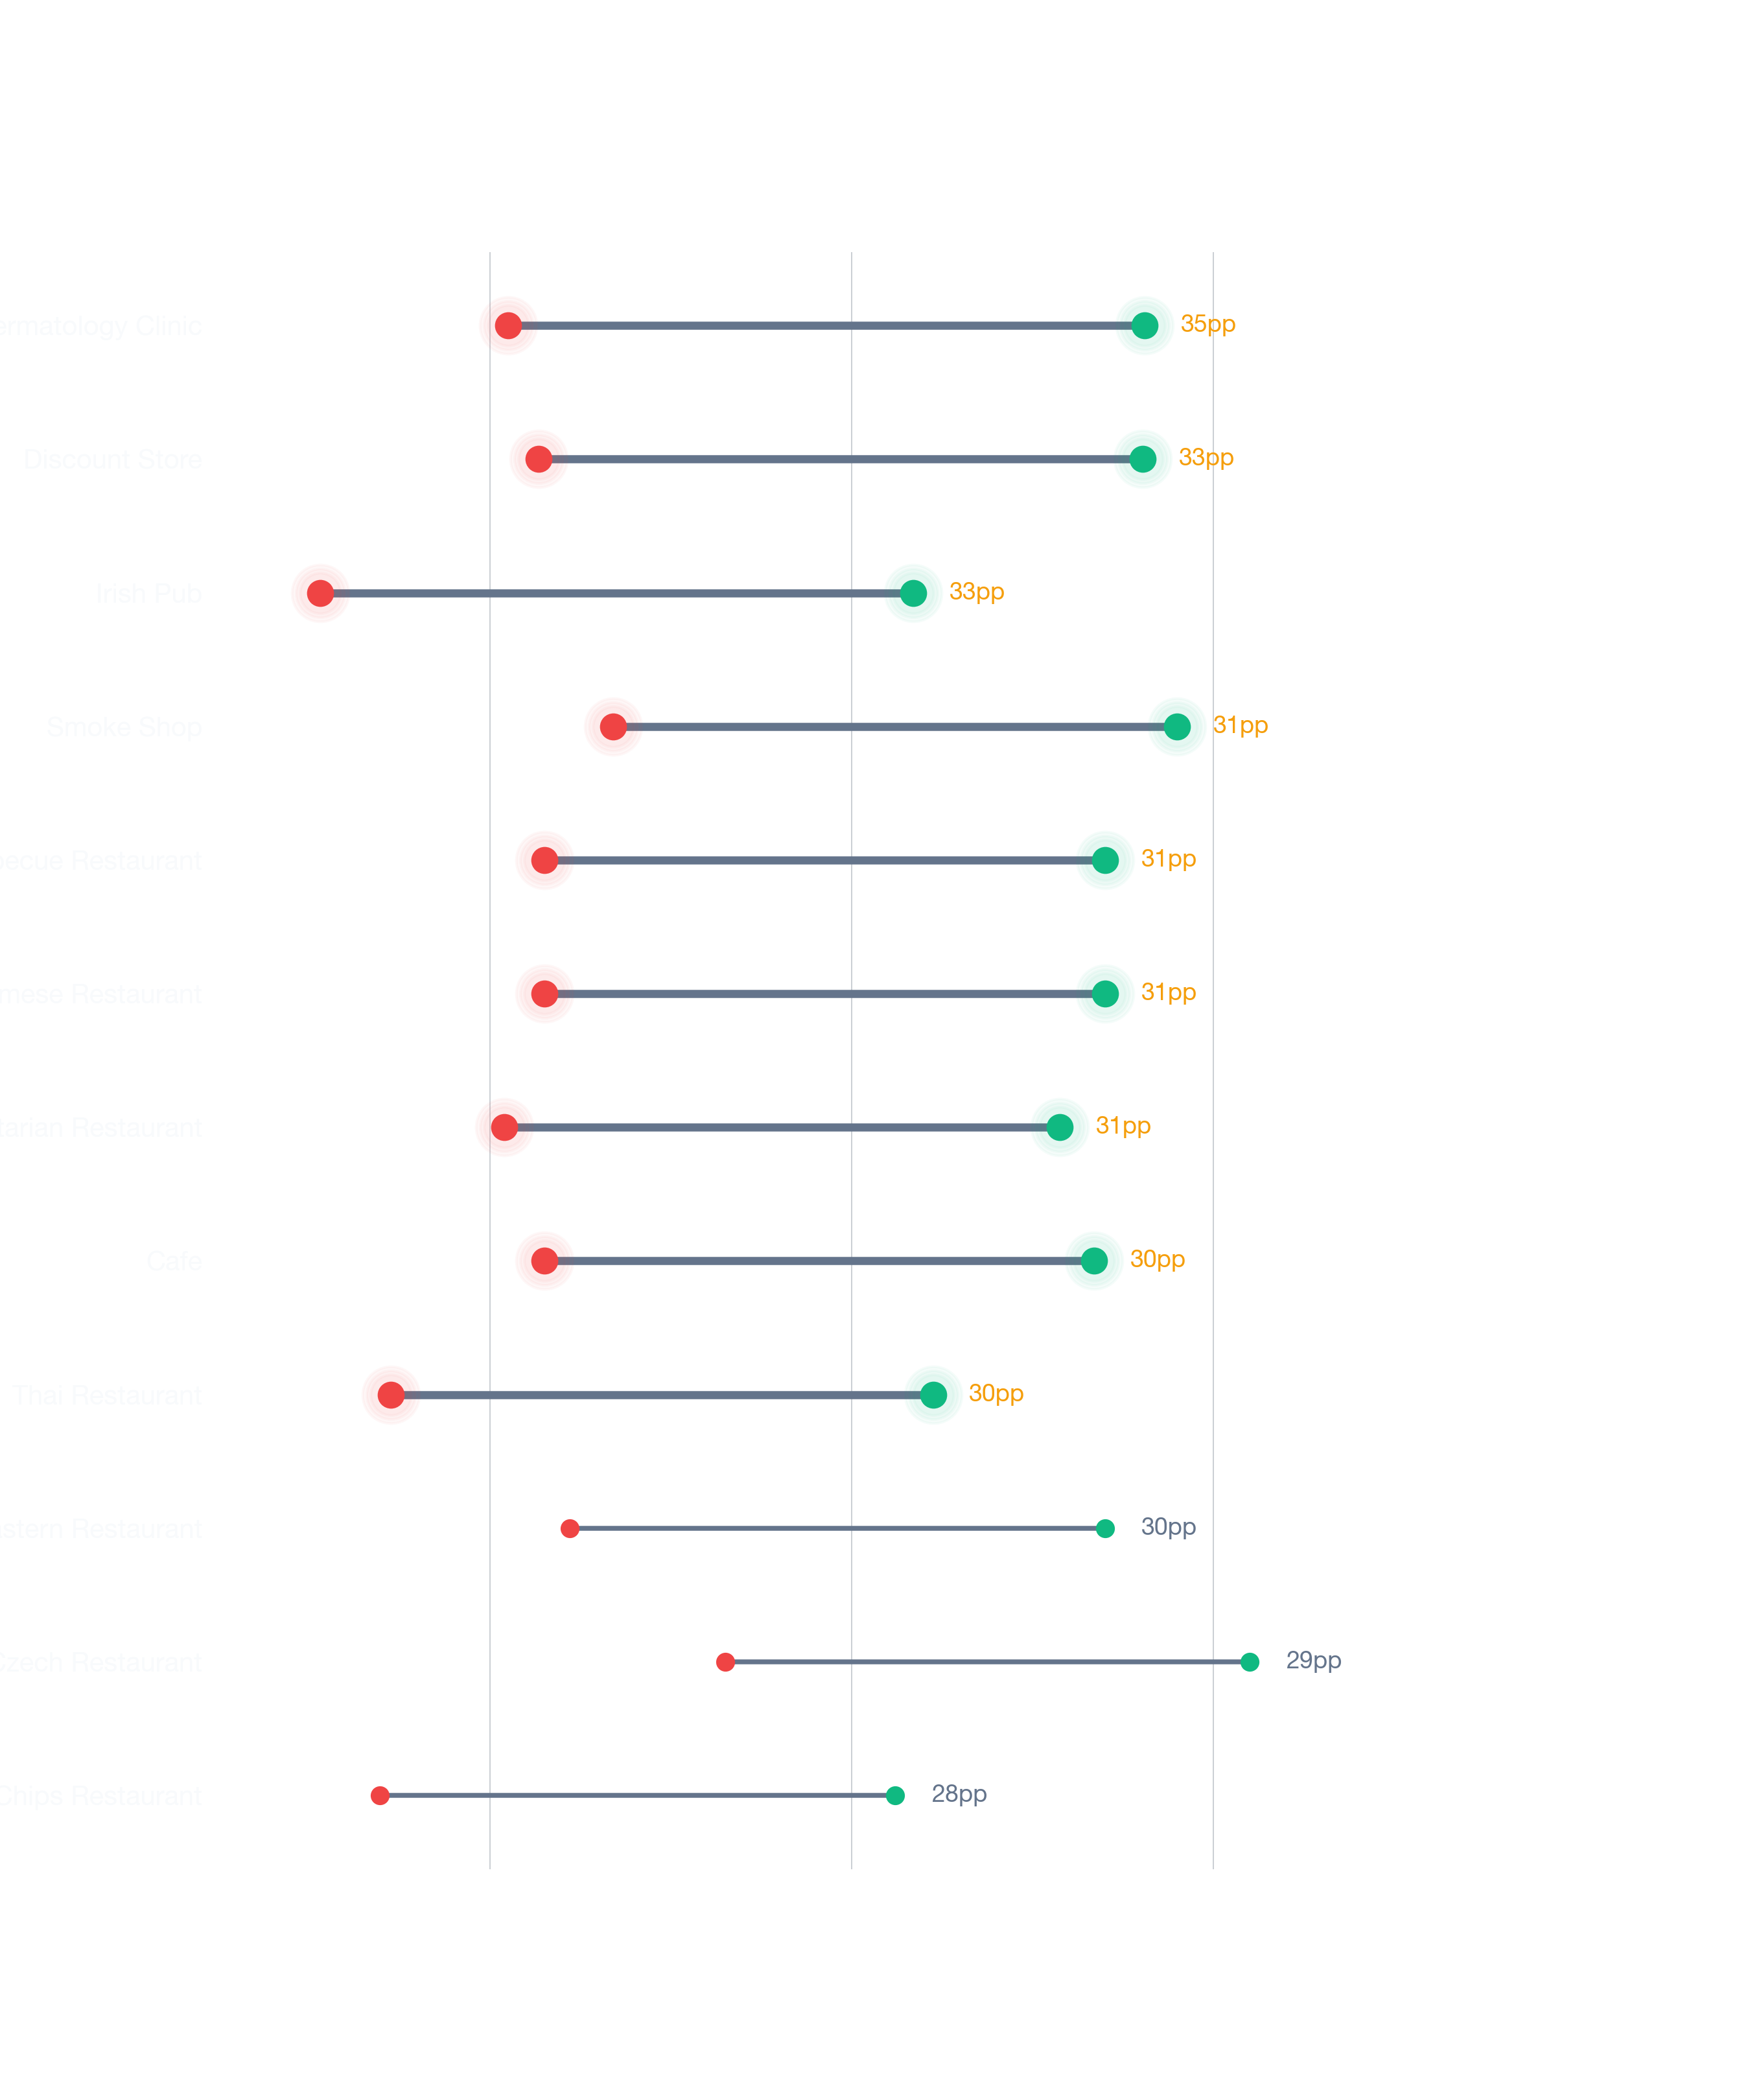
Visual Data
Related Resources
Same business type in other cities:
- Survivability Rankings for Indian Restaurant in Atlanta
- City Survivability Rankings for Indian Restaurant
Related:
- Business Survivability Rankings: Baltimore
- Neighborhood Survivability Rankings: Baltimore
- Business Survivability in Annapolis, Baltimore
More Questions About This Location
Local-context questions, answered with neighborhood-specific numbers.
Do Indian Restaurants need walkable locations in Baltimore?
ACS data shows Baltimore's median commute at ~30 minutes — accessibility patterns vary widely by neighborhood. Indian Restaurants survivability in Baltimore ranges 56-97% across locations, with accessibility one of the bigger contributing factors.
How often is the Baltimore Indian Restaurants survivability data refreshed?
The Baltimore Indian Restaurants survivability corpus refreshes quarterly. The current dataset (2026 release) reflects Baltimore's ~86% average for this subtype. New competitor openings, closures, and ACS releases are integrated each refresh cycle.
What's the survivability spread for Indian Restaurants across Baltimore?
The Baltimore survivability spread for Indian Restaurants runs from 56% (challenging locations) to 97% (best locations) — a 41-point window driven entirely by site selection.