Survivability Rankings for Home Improvement Store in Baltimore
StreetSpring's 2026 analysis ranks the best and worst neighborhoods in Baltimore to open a Home Improvement Store, from Greektown (75% survival) to Glen...
By Bobby Koons | Last reviewed: May 12, 2026 | New data weekly | Methodology
Quick Summary
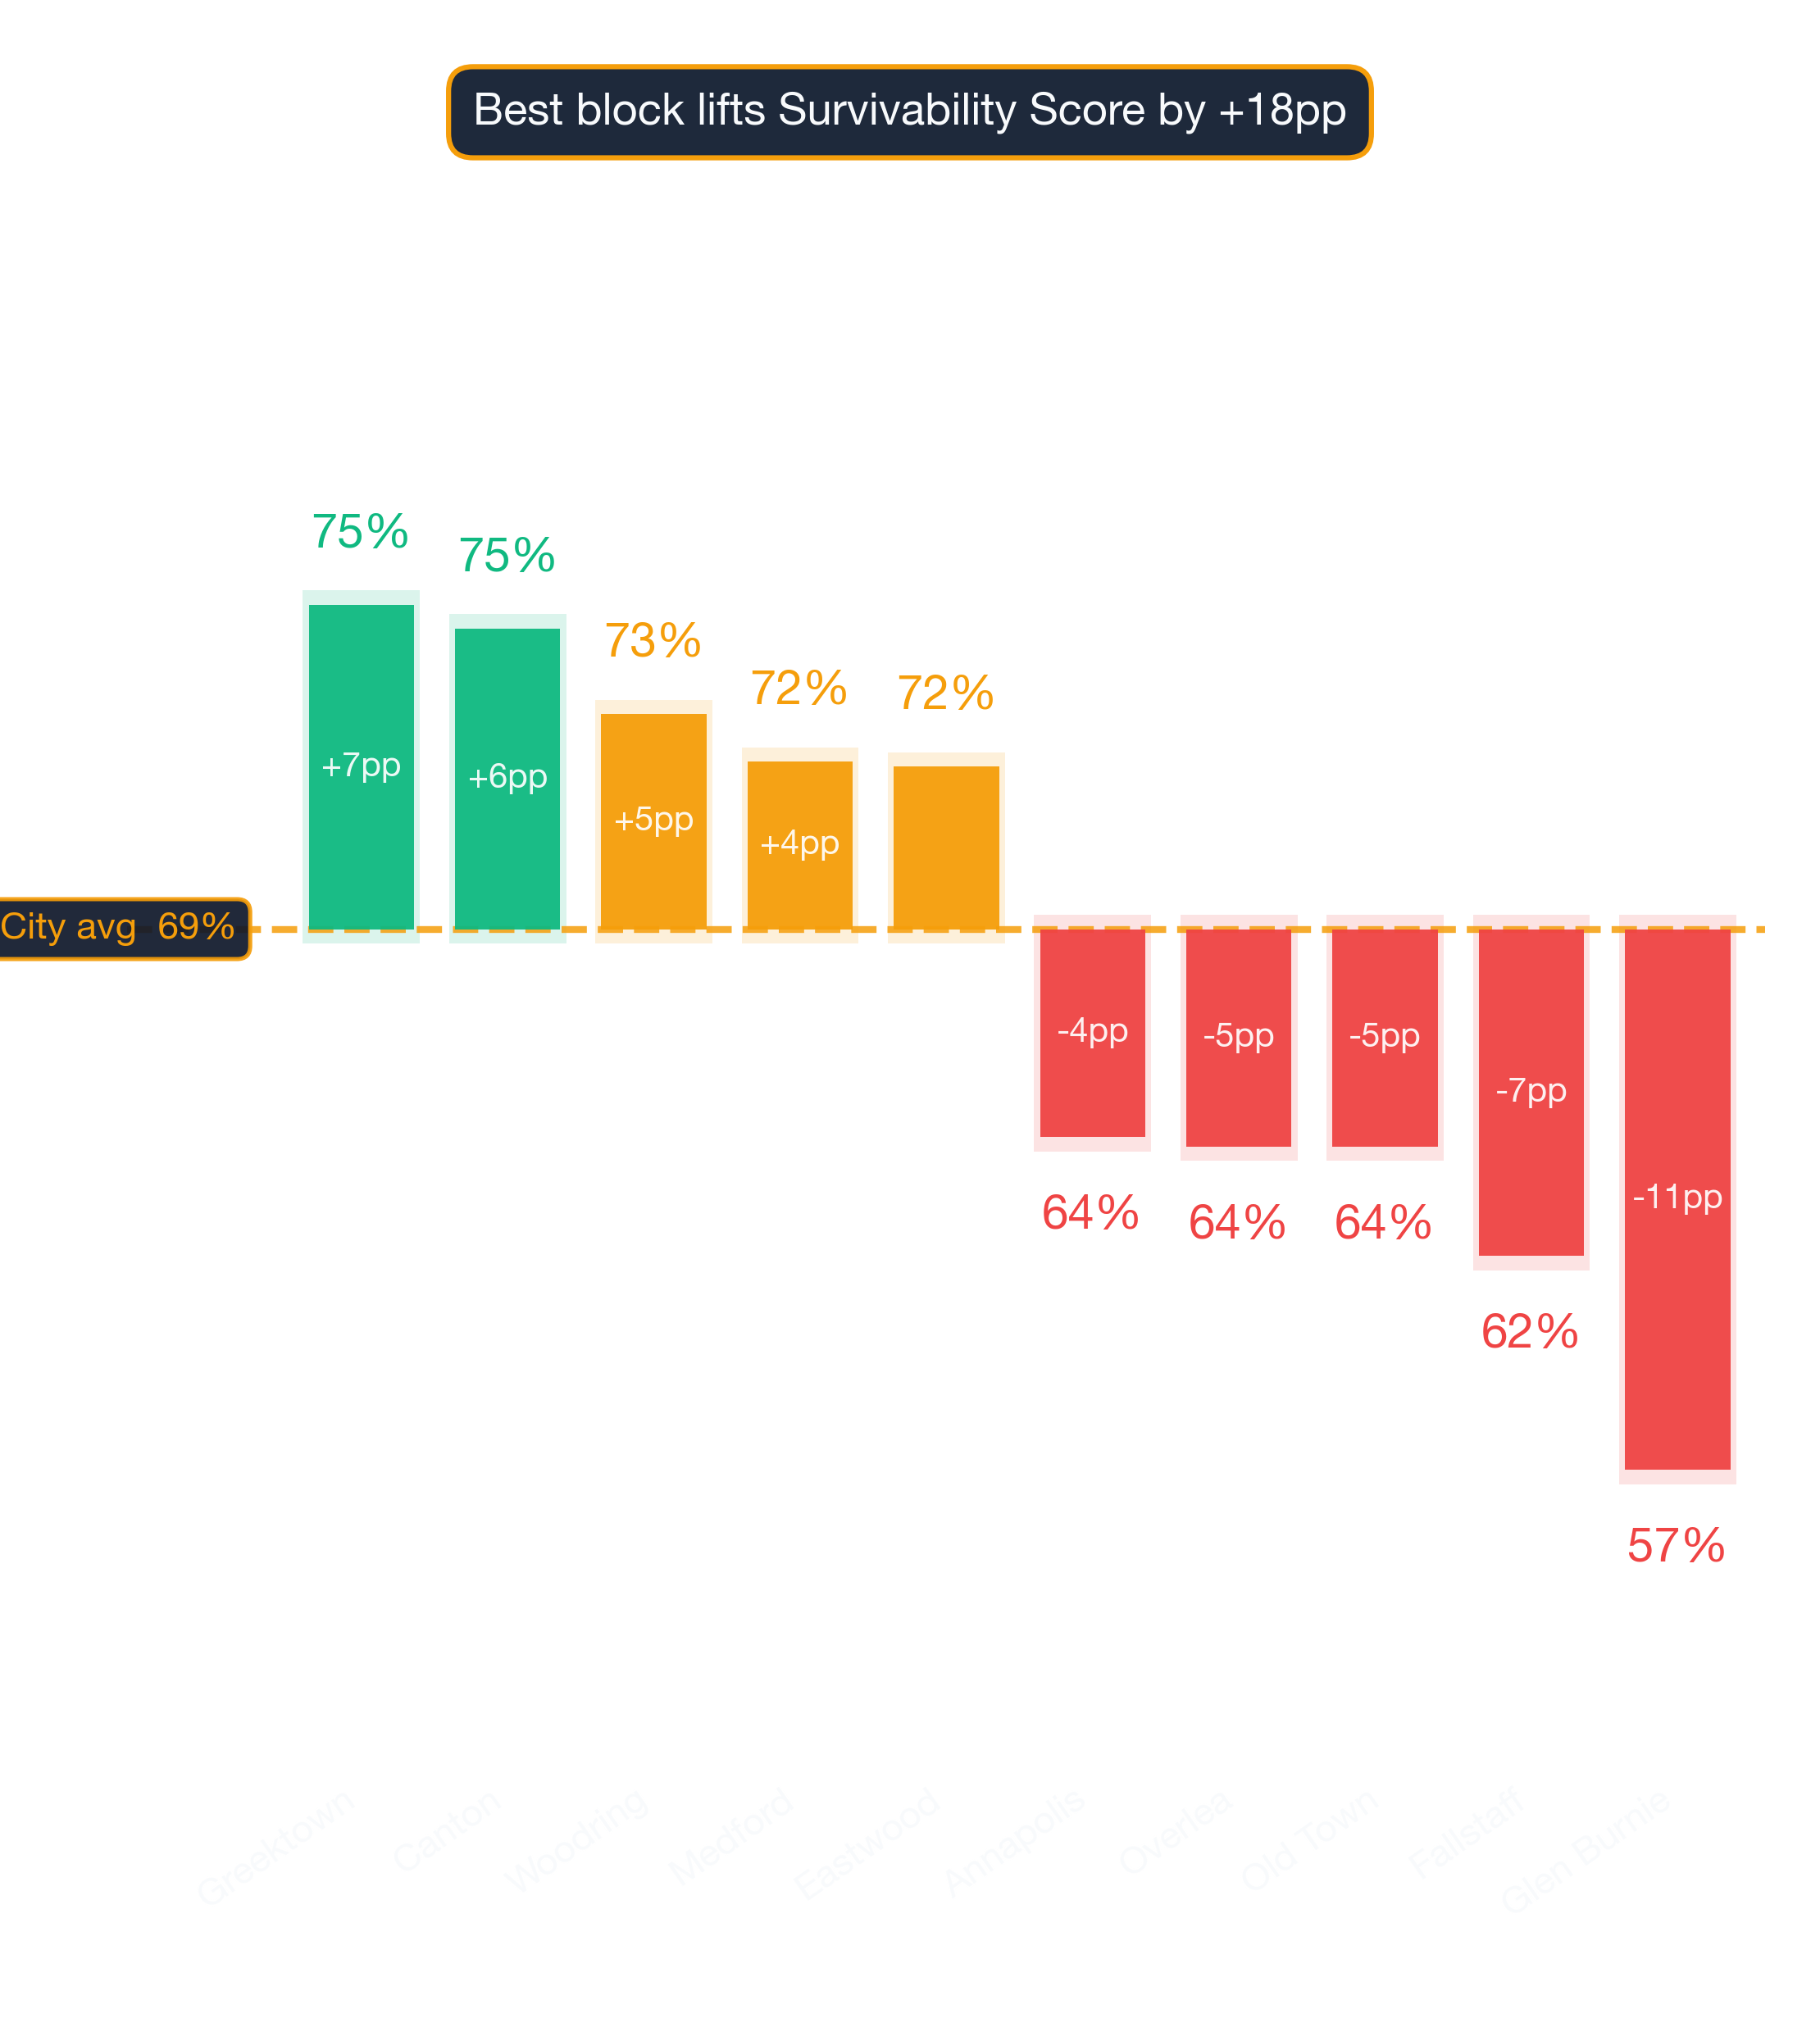
- #1 Neighborhood: Greektown — 75% average survivability for Home Improvement Store
- Neighborhoods at or above 70%: 11 of 23 analyzed
- City-wide average: 69% for Home Improvement Stores
- Most challenging area: Glen Burnie at 57%
- Revenue advantage (top vs. avg location): ~9.9% more expected revenue in Greektown
- Data freshness: 2026 data · Full methodology →
Table of Contents
- Summary
- 10 Best Neighborhoods
- Where Would a Home Improvement Store Make the Most Money?
- What Should I Consider?
- Where Should I Start?
- FAQ: Best Neighborhoods
- FAQ: Can a Home Improvement Store Succeed in Lower-Ranked Areas?
- FAQ: How Often Are Rankings Updated?
- FAQ: Is a Home Improvement Store a Good Tenant?
- Landlord Survivability Data
- Best Neighborhoods for Any Business
Summary
Greektown leads Baltimore's 2026 survivability rankings for Home Improvement Store operators with 75% average chance of surviving more than 2 years, with the best locations offering 81% and the most challenging locations in Greektown at 69%. The worst neighborhoods include Glen Burnie with 57% average chance. Neighborhood averages mask significant block-by-block variation — always check your specific address.
Where in Baltimore Should You Open a Home Improvement Store?
Greektown ranks #1 of 23 neighborhoods analyzed in and around Baltimore for Home Improvement Store survivability with a score of 75% as of 2026. The top 10 neighborhoods are:
How rent and competition shape the leaderboard
| Rank | Neighborhood | Best Locations | Average Locations | Challenging Locations |
|---|---|---|---|---|
| 1 | Greektown | 78.0% – 82.0% | 72.9% – 78.2% | 68.0% – 72.0% |
| 2 | Canton | 75.0% – 79.0% | 72.4% – 77.7% | 72.0% – 76.0% |
| 3 | Woodring | 78.0% – 82.0% | 70.6% – 75.9% | 67.0% – 71.0% |
| 4 | Medford | 72.0% – 76.0% | 69.6% – 74.9% | 66.0% – 70.0% |
| 5 | Eastwood | 76.0% – 80.0% | 69.5% – 74.8% | 61.0% – 65.0% |
| 6 | Riverside | 74.0% – 78.0% | 69.4% – 74.7% | 64.0% – 68.0% |
| 7 | Oaklee | 81.0% – 85.0% | 69.2% – 74.5% | 64.0% – 68.0% |
| 8 | Towson | 84.0% – 88.0% | 68.4% – 73.7% | 53.0% – 57.0% |
| 9 | Kresson | 76.0% – 80.0% | 68.1% – 73.4% | 64.0% – 68.0% |
| 10 | Beechfield | 77.0% – 81.0% | 68.0% – 73.3% | 63.0% – 67.0% |
Reading the gap between #1 and #10
Location-level factors like visibility and adjacent tenants can override neighborhood-level trends. The live platform incorporates the most recent foot traffic, competitor, and spending data for your exact address.
Survivability ranges reflect best and worst storefront conditions within each neighborhood. See our full methodology →
Try StreetSpring to see if this location is still the best and see if there are locations to rent in this area right now.
Where Home Improvement Stores Earn the Most in Baltimore
In Greektown, the best possible location offers the opportunity of making ~9.9% more than the average location in or around Baltimore.
On the other hand, in Glen Burnie, the worst possible location could result in making ~16.6% less than the average location in the city.
A great concept in the wrong location will almost always underperform a good concept in the right one. Opening a Home Improvement Store in Baltimore requires careful location choice. Across 23 neighborhoods analyzed, the overall average survival chance for a new Home Improvement Store is 69% for lasting more than 2 years — due to a combination of many factors across competition, consumer spending, and location dynamics. A high-traffic corner that works well for a coffee shop may be entirely wrong for a specialty retailer.
What Should I Consider When Opening a Home Improvement Store in or Around Baltimore?
The right address sets the ceiling on every other variable. Filtering candidate locations by Survivability Score first protects against the most common cause of business failure. Among all factors in our model, Revenue Capture Score carries the most weight in determining long-term survivability. StreetSpring computes this by projecting the business's market share, which is based on the quality and quantity of primary, secondary, and tertiary competitors. Our platform incorporates data from thousands of neighborhoods nationwide. Competition density is not inherently negative — it often signals an established customer base. These results are powered by exclusive algorithms trained on one of the largest commercial real estate datasets in the U.S.
| Consideration | Common pitfall | What to verify before signing |
|---|---|---|
| Insurance + compliance | General liability quoted at a starter rate, then jumping 2-3x once you add property + workers' comp + business interruption. | Get binding quotes from 2 insurers before signing the lease. Most landlords require minimum coverage levels — read those terms first. |
| CAM + hidden costs | Stated rent looks great, then CAM fees, signage charges, and after-hours utilities add 15-30%. | Get the full operating expense breakdown for the past 2 years. Ask which costs are landlord-capped vs. uncapped. |
| Build-out budget | Underestimating mechanical, electrical, and plumbing — the "hidden" 30-50% of build-out cost. | Get 3 quotes from licensed contractors and pad budget by +20% for surprises. Confirm landlord TI allowance in writing. |
This can be summarized as:
Revenue Capture Score = Projected Market Share × Forecasted Spend on Specific Business
Related: Survivability Score: How We Calculate It & Why It Matters
StreetSpring recalculates survivability using the latest competitive, demographic, and walkability data. Market dynamics shift frequently; validate these insights with real-time data from StreetSpring.
Which Baltimore Block Is Right for a Home Improvement Store?
StreetSpring identifies the strongest markets as Greektown, Canton, and Woodring, while the most challenging neighborhoods would be Glen Burnie, Fallstaff, and Old Town. However, individual locations vary widely, and even in lower-scoring neighborhoods there are pockets that perform exceptionally well. Static rankings provide a useful baseline, but the live tool captures changes that have occurred since publication.
Related Articles:
Which Baltimore Neighborhoods Are Strongest for Home Improvement Stores?
Based on StreetSpring's 2026 analysis, the top neighborhood for a Home Improvement Store in Baltimore is Greektown with 75% average survivability, followed by Canton and Woodring. 11 of 23 neighborhoods analyzed exceed 70% two-year survival.
StreetSpring's Survivability Scores are updated regularly, so the most accurate prediction for your exact storefront is always available in the live tool.
Can a Home Improvement Store Succeed in Lower-Ranked Neighborhoods in Baltimore?
Yes — neighborhood averages mask significant block-by-block variation. Even in neighborhoods ranked outside the top 10, individual storefronts with strong foot traffic, low direct competition, and favorable lease terms can outperform the area average. A low-ranking neighborhood can still contain high-potential storefronts — the address matters most. Always check your specific address in StreetSpring's live platform for the most accurate prediction.
The Update Schedule for Baltimore Home Improvement Stores Data
StreetSpring recalculates survivability scores regularly using the latest competitive, demographic, and walkability data. Rankings are updated quarterly; the live tool always reflects the most current predictions for any address in Baltimore.
Should You Rent Your Baltimore Storefront to a Home Improvement Store?
In Greektown, StreetSpring forecasts a 72.9% – 78.2% average chance for a new Home Improvement Store to survive more than 2 years, depending on the exact storefront. Check the current Survivability Score for any address instantly.
Landlord Survivability Data for Home Improvement Store in Baltimore
Landlords in Baltimore's top three neighborhoods for Home Improvement Store can expect the following average survivability for new tenants:
- Greektown: 72.9% – 78.2%
- Canton: 72.4% – 77.7%
- Woodring: 70.6% – 75.9%
You can see the Survivability Score for your location for any business right now.
StreetSpring can give you the precise likelihood that hundreds of different businesses will last at an exact address.
Related: How Landlord Representatives Can Reduce Vacancy & Increase Tenant Longevity
Top-Survivability Baltimore Neighborhoods for Home Improvement Stores
You can see the best neighborhoods in or around Baltimore to open any type of business in our article Neighborhood Survivability Rankings: Baltimore.
Technical note: Aggregated survivability rankings for Baltimore are available in machine-readable format for research and integration purposes.
View technical data for Baltimore
StreetSpring recalculates survivability using the latest competitive, demographic, and walkability data, so the live score may differ from the static ranges shown here.
Visual Data
Related Resources
Same business type in other cities:
- Survivability Rankings for Home Improvement Store in Atlanta
- City Survivability Rankings for Home Improvement Store
Related:
- Business Survivability Rankings: Baltimore
- Neighborhood Survivability Rankings: Baltimore
- Business Survivability in Annapolis, Baltimore
Beyond the Numbers: Local Context
More questions answered with neighborhood-specific data from our 2026 corpus.
How is the Home Improvement Stores survivability score for Baltimore calculated?
Each Home Improvement Stores survivability score in Baltimore (averaging 50%) reflects ~100 factors per address: competitor counts at multiple radii, demographics, accessibility, rent, and historical outcomes. The model is recalibrated quarterly against 500K+ business outcomes nationally.
How does Baltimore's demographic profile affect a Home Improvement Store?
Baltimore has a metro median household income of ~$104K and a median age of 39 (ACS data). These two factors enter the survivability model alongside competition density, lease economics, and accessibility — the model's average score for Home Improvement Stores in Baltimore is 50%.
What's the gap between the best and worst Baltimore locations for a Home Improvement Store?
The Baltimore survivability spread for Home Improvement Stores runs from 32% (challenging locations) to 90% (best locations) — a 58-point window driven entirely by site selection.