Survivability Rankings for Dessert Shop in Baltimore
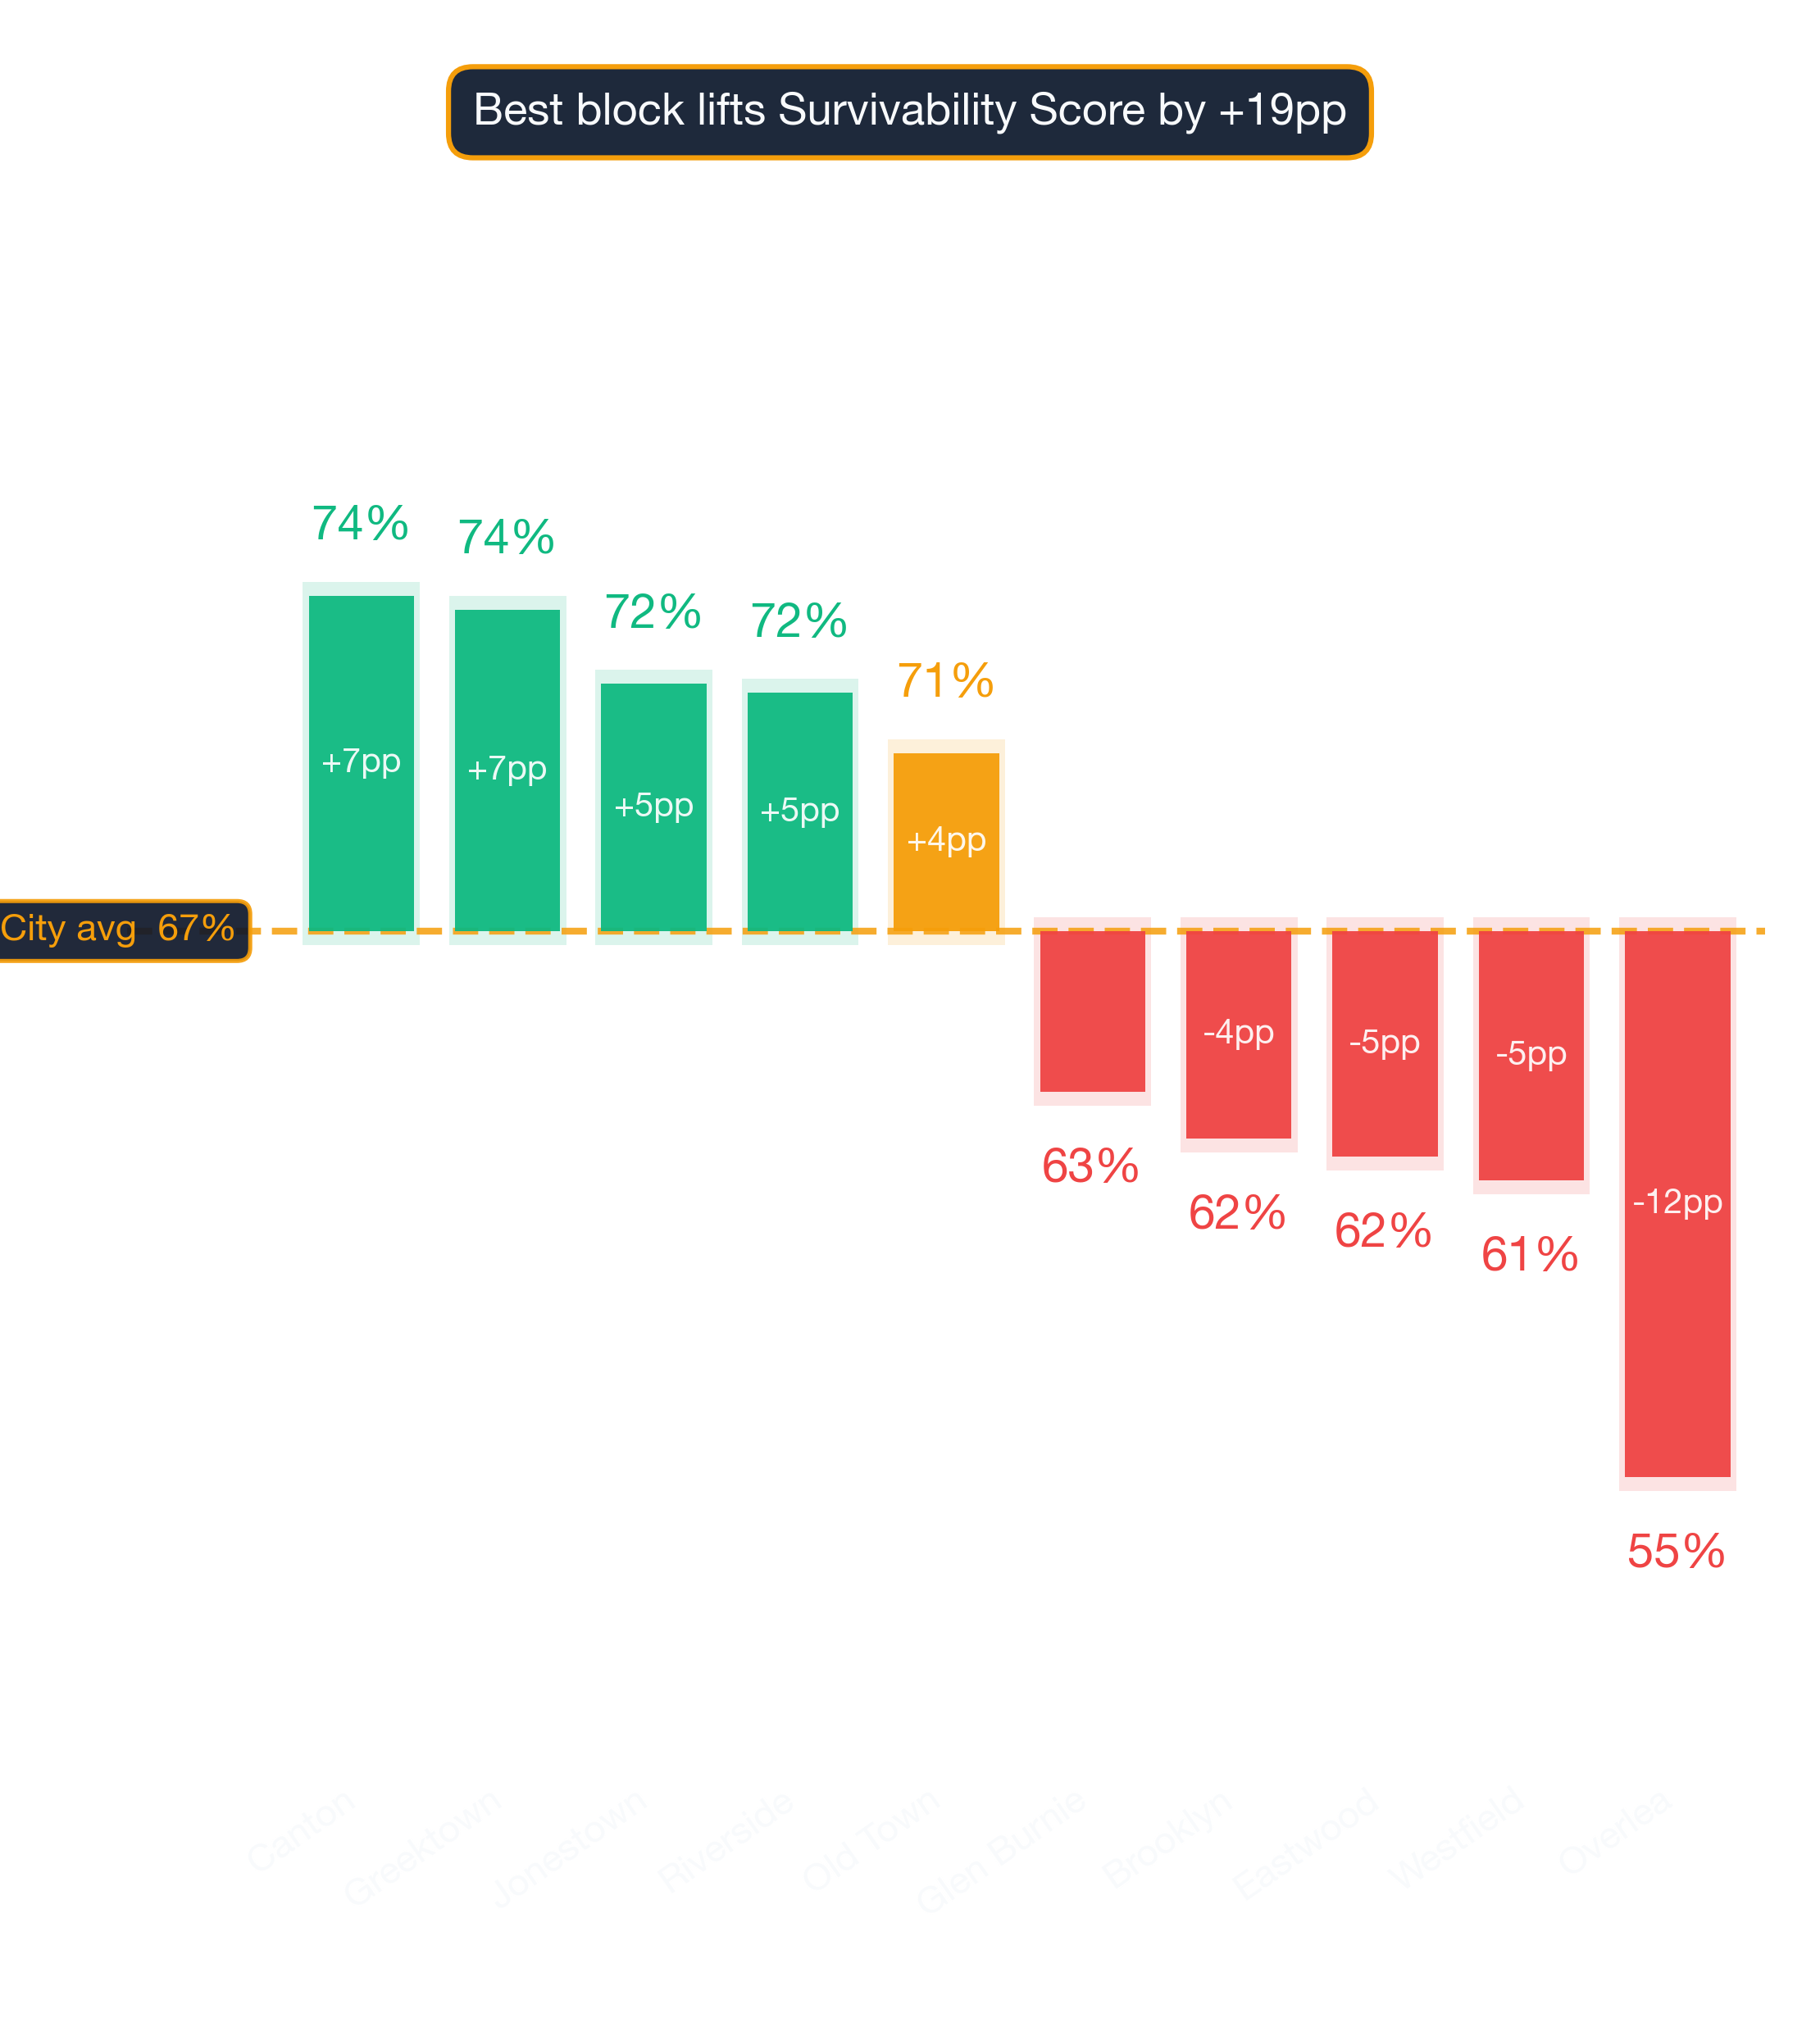
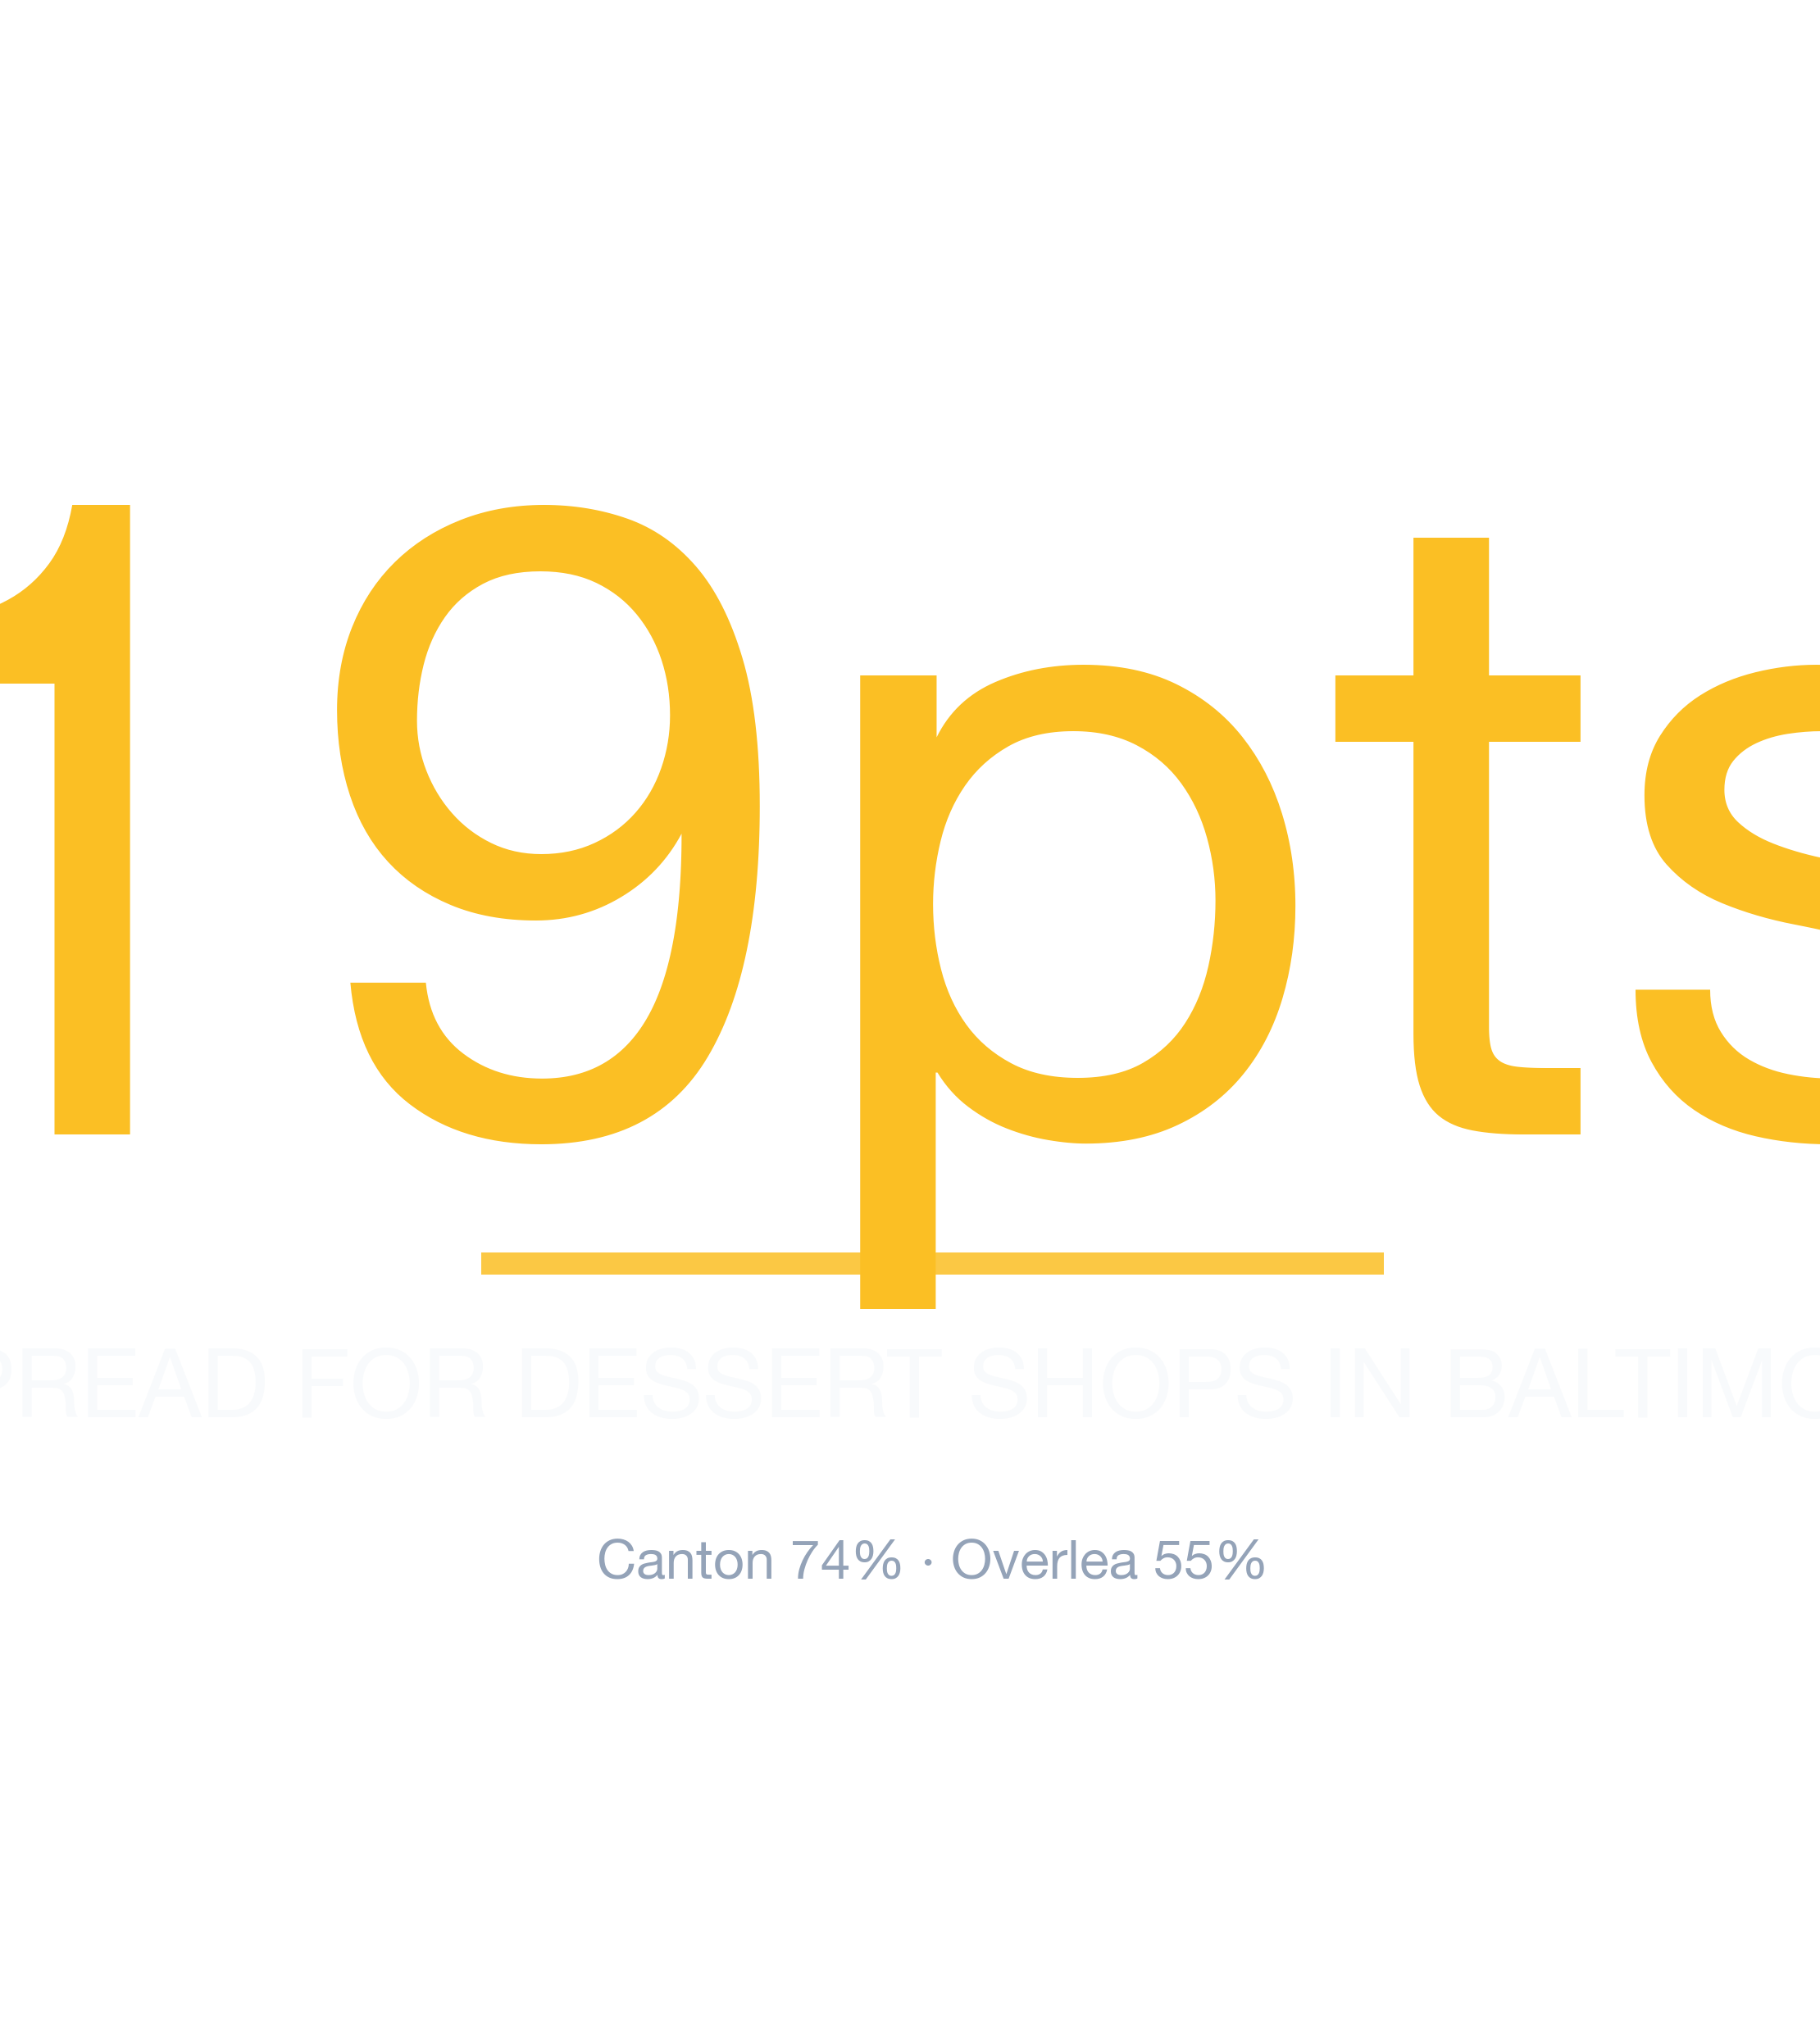
StreetSpring's 2026 analysis ranks the best and worst neighborhoods in Baltimore to open a Dessert Shop, from Canton (74% survival) to Overlea (55%).
By Bobby Koons | Reviewed: May 9, 2026 | Refreshed weekly | Methodology
Quick Summary
- #1 Neighborhood: Canton — 74% average survivability for Dessert Shop
- Neighborhoods at or above 70%: 5 of 23 analyzed
- City-wide average: 67% for Dessert Shops
- Most challenging area: Overlea at 55%
- Revenue advantage (top vs. avg location): ~10.8% more expected revenue in Canton
- Data freshness: 2026 data · Full methodology →
Table of Contents
- Summary
- 10 Best Neighborhoods
- Where Would a Dessert Shop Make the Most Money?
- What Should I Consider?
- Where Should I Start?
- FAQ: Best Neighborhoods
- FAQ: Can a Dessert Shop Succeed in Lower-Ranked Areas?
- FAQ: How Often Are Rankings Updated?
- FAQ: Is a Dessert Shop a Good Tenant?
- Landlord Survivability Data
- Best Neighborhoods for Any Business
Summary
Of all the neighborhoods in and around Baltimore, Canton ranks #1 for opening a Dessert Shop with 74% average chance of surviving more than 2 years, with the best locations offering 81% and the most challenging locations in Canton at 67%. The worst neighborhoods include Overlea with 55% average chance. Location-level factors like visibility and adjacent tenants can override neighborhood-level trends.
Top-Survivability Baltimore Neighborhoods for Dessert Shops
Canton ranks #1 of 23 neighborhoods analyzed in and around Baltimore for Dessert Shop survivability with a score of 74% as of 2026. The top 10 neighborhoods are:
What the score spread tells you about risk
| Rank | Neighborhood | Best Locations | Average Locations | Challenging Locations |
|---|---|---|---|---|
| 1 | Canton | 78.0% – 82.0% | 71.7% – 75.5% | 66.0% – 70.0% |
| 2 | Greektown | 79.0% – 83.0% | 71.5% – 75.2% | 65.0% – 69.0% |
| 3 | Jonestown | 72.0% – 76.0% | 69.8% – 73.6% | 68.0% – 72.0% |
| 4 | Riverside | 78.0% – 82.0% | 69.6% – 73.4% | 66.0% – 70.0% |
| 5 | Old Town | 74.0% – 78.0% | 68.3% – 72.1% | 65.0% – 69.0% |
| 6 | Downtown | 71.0% – 75.0% | 66.9% – 70.7% | 60.0% – 64.0% |
| 7 | Annapolis | 78.0% – 82.0% | 66.3% – 70.1% | 48.0% – 52.0% |
| 8 | Medford | 75.0% – 79.0% | 65.6% – 69.4% | 60.0% – 64.0% |
| 9 | Otterbein | 68.0% – 72.0% | 65.6% – 69.4% | 64.0% – 68.0% |
| 10 | Idlewood | 84.0% – 88.0% | 65.4% – 69.2% | 58.0% – 62.0% |
Notable runners-up worth a second look
Our data shows that roughly 15% of top-performing locations sit in neighborhoods ranked below the city median. Neighborhood rankings are useful, but the exact odds for your location can only be seen by running a current survivability check in StreetSpring.
Survivability ranges reflect best and worst storefront conditions within each neighborhood. See our full methodology →
Try StreetSpring to see if this location is still the best and see if there are locations to rent in this area right now.
Where Dessert Shops Earn the Most in Baltimore
In Canton, the best possible location offers the opportunity of making ~10.8% more than the average location in or around Baltimore.
On the other hand, in Overlea, the worst possible location could result in making ~17.7% less than the average location in the city.
No amount of marketing or capital can compensate for a poorly chosen location. Opening a Dessert Shop in Baltimore requires careful location choice. Across 23 neighborhoods analyzed, the overall average survival chance for a new Dessert Shop is 67% for lasting more than 2 years — due to a combination of many factors across competition, consumer spending, and location dynamics. Survivability predictions are business-type-specific because consumer behavior differs fundamentally across categories.
What to Think About When Launching a Dessert Shop in Baltimore
The strongest predictor of whether this business survives two years is the quality of the location you pick — Survivability Score quantifies exactly that. When evaluating a potential location, Revenue Capture Score should be the first number you look at. StreetSpring computes this by projecting the business's market share, which is based on the quality and quantity of primary, secondary, and tertiary competitors. We incorporate data from thousands of neighborhoods and hundreds of thousands of individual businesses. Moderate competition often indicates a healthy market with proven consumer demand. StreetSpring uses its own proprietary forecasting tools to make these predictions.
| Area to check | What can go wrong | How to de-risk it |
|---|---|---|
| Build-out budget | Underestimating mechanical, electrical, and plumbing — the "hidden" 30-50% of build-out cost. | Get 3 quotes from licensed contractors and pad budget by +20% for surprises. Confirm landlord TI allowance in writing. |
| Competitor density | Counting only direct competitors and missing adjacent-category overlap (e.g. coffee shop near a bakery). | Map all businesses serving overlapping customer needs within a 5-min walk. Use StreetSpring's competitor view as a starting point. |
| Foot traffic seasonality | Looking at a peak-summer Tuesday and assuming year-round volume. | Walk the block at 3 different times across 2 different weeks. Ask neighboring tenants for their slow-season % drop. |
This can be summarized as:
Revenue Capture Score = Projected Market Share × Forecasted Spend on Specific Business
Related: Survivability Score: How We Calculate It & Why It Matters
StreetSpring recalculates survivability using the latest competitive, demographic, and walkability data. Market dynamics shift frequently; validate these insights with real-time data from StreetSpring.
Pinpointing the Right Neighborhood for a Dessert Shop in Baltimore
For this business type, the highest-ranked neighborhoods are Canton, Greektown, and Jonestown, while the most challenging neighborhoods would be Overlea, Westfield, and Eastwood. Neighborhood averages mask significant block-by-block variation — always check your specific address. StreetSpring's Survivability Scores are updated regularly, so the most accurate prediction for your exact storefront is always available in the live tool.
Related Articles:
- Business Survivability Rankings: Baltimore
- Neighborhood Survivability Rankings: Baltimore
- National City Survivability: Dessert Shop
Where Dessert Shops Thrive in Baltimore
Based on StreetSpring's 2026 analysis, the top neighborhood for a Dessert Shop in Baltimore is Canton with 74% average survivability, followed by Greektown and Jonestown. 5 of 23 neighborhoods analyzed exceed 70% two-year survival.
The live platform incorporates the most recent foot traffic, competitor, and spending data for your exact address.
Can a Dessert Shop Succeed in Lower-Ranked Neighborhoods in Baltimore?
Yes — neighborhood averages mask significant block-by-block variation. Even in neighborhoods ranked outside the top 10, individual storefronts with strong foot traffic, low direct competition, and favorable lease terms can outperform the area average. These rankings are based on the latest available data; check StreetSpring for real-time updates. Always check your specific address in StreetSpring's live platform for the most accurate prediction.
How Often Are Dessert Shop Rankings in Baltimore Updated?
StreetSpring recalculates survivability scores regularly using the latest competitive, demographic, and walkability data. Rankings are updated quarterly; the live tool always reflects the most current predictions for any address in Baltimore.
The Landlord's View of Dessert Shops in Baltimore
In Canton, StreetSpring forecasts a 71.7% – 75.5% average chance for a new Dessert Shop to survive more than 2 years, depending on the exact storefront. Check the current Survivability Score for any address instantly.
Landlord Survivability Data for Dessert Shop in Baltimore
Landlords in Baltimore's top three neighborhoods for Dessert Shop can expect the following average survivability for new tenants:
- Canton: 71.7% – 75.5%
- Greektown: 71.5% – 75.2%
- Jonestown: 69.8% – 73.6%
Check the current Survivability Score for any address instantly.
Our tool delivers pinpoint accuracy down to the exact storefront location for any business category.
Related: How Landlord Representatives Can Reduce Vacancy & Increase Tenant Longevity
What Are the Best Neighborhoods in Baltimore to Open a Dessert Shop?
You can see the best neighborhoods in or around Baltimore to open any type of business in our article Neighborhood Survivability Rankings: Baltimore.
Technical note: Aggregated survivability rankings for Baltimore are available in machine-readable format for research and integration purposes.
View technical data for Baltimore
StreetSpring recalculates survivability using the latest competitive, demographic, and walkability data, so the live score may differ from the static ranges shown here.
Visual Data
Related Resources
Same business type in other cities:
Related:
- Business Survivability Rankings: Baltimore
- Neighborhood Survivability Rankings: Baltimore
- Business Survivability in Annapolis, Baltimore
Local Data Questions
Additional questions with answers drawn directly from local data sources.
How important is foot traffic / accessibility for a Dessert Shop in Baltimore?
Median Baltimore commute is ~30 minutes. Accessibility-driven foot-traffic variation contributes to the 34-90% survivability range Dessert Shops see across the metro.
How current is the Dessert Shops data for Baltimore?
StreetSpring refreshes the Baltimore Dessert Shops corpus quarterly. The current 2026 release shows a 65% average across Baltimore; the next refresh will integrate fresh competitor and ACS data.
What separates a Baltimore Dessert Shop that survives from one that doesn't?
The address you sign for. Across Baltimore, Dessert Shops score 34-90% depending on location — a 56-point spread that captures competitive density, demographic fit, accessibility, and visibility at each storefront.