City Survivability Rankings for Dentist Office
StreetSpring's 2026 analysis ranks the top cities for Dentist Offices across the US by Survivability Scores. See which cities offer the best chances for a Dentist Office to succeed.
Quick Summary
- The highest-survivability city for Dentist Office is San Antonio — 65% average survivability
- 0 of 24 analyzed US metros score above 70% for Dentist Office survivability
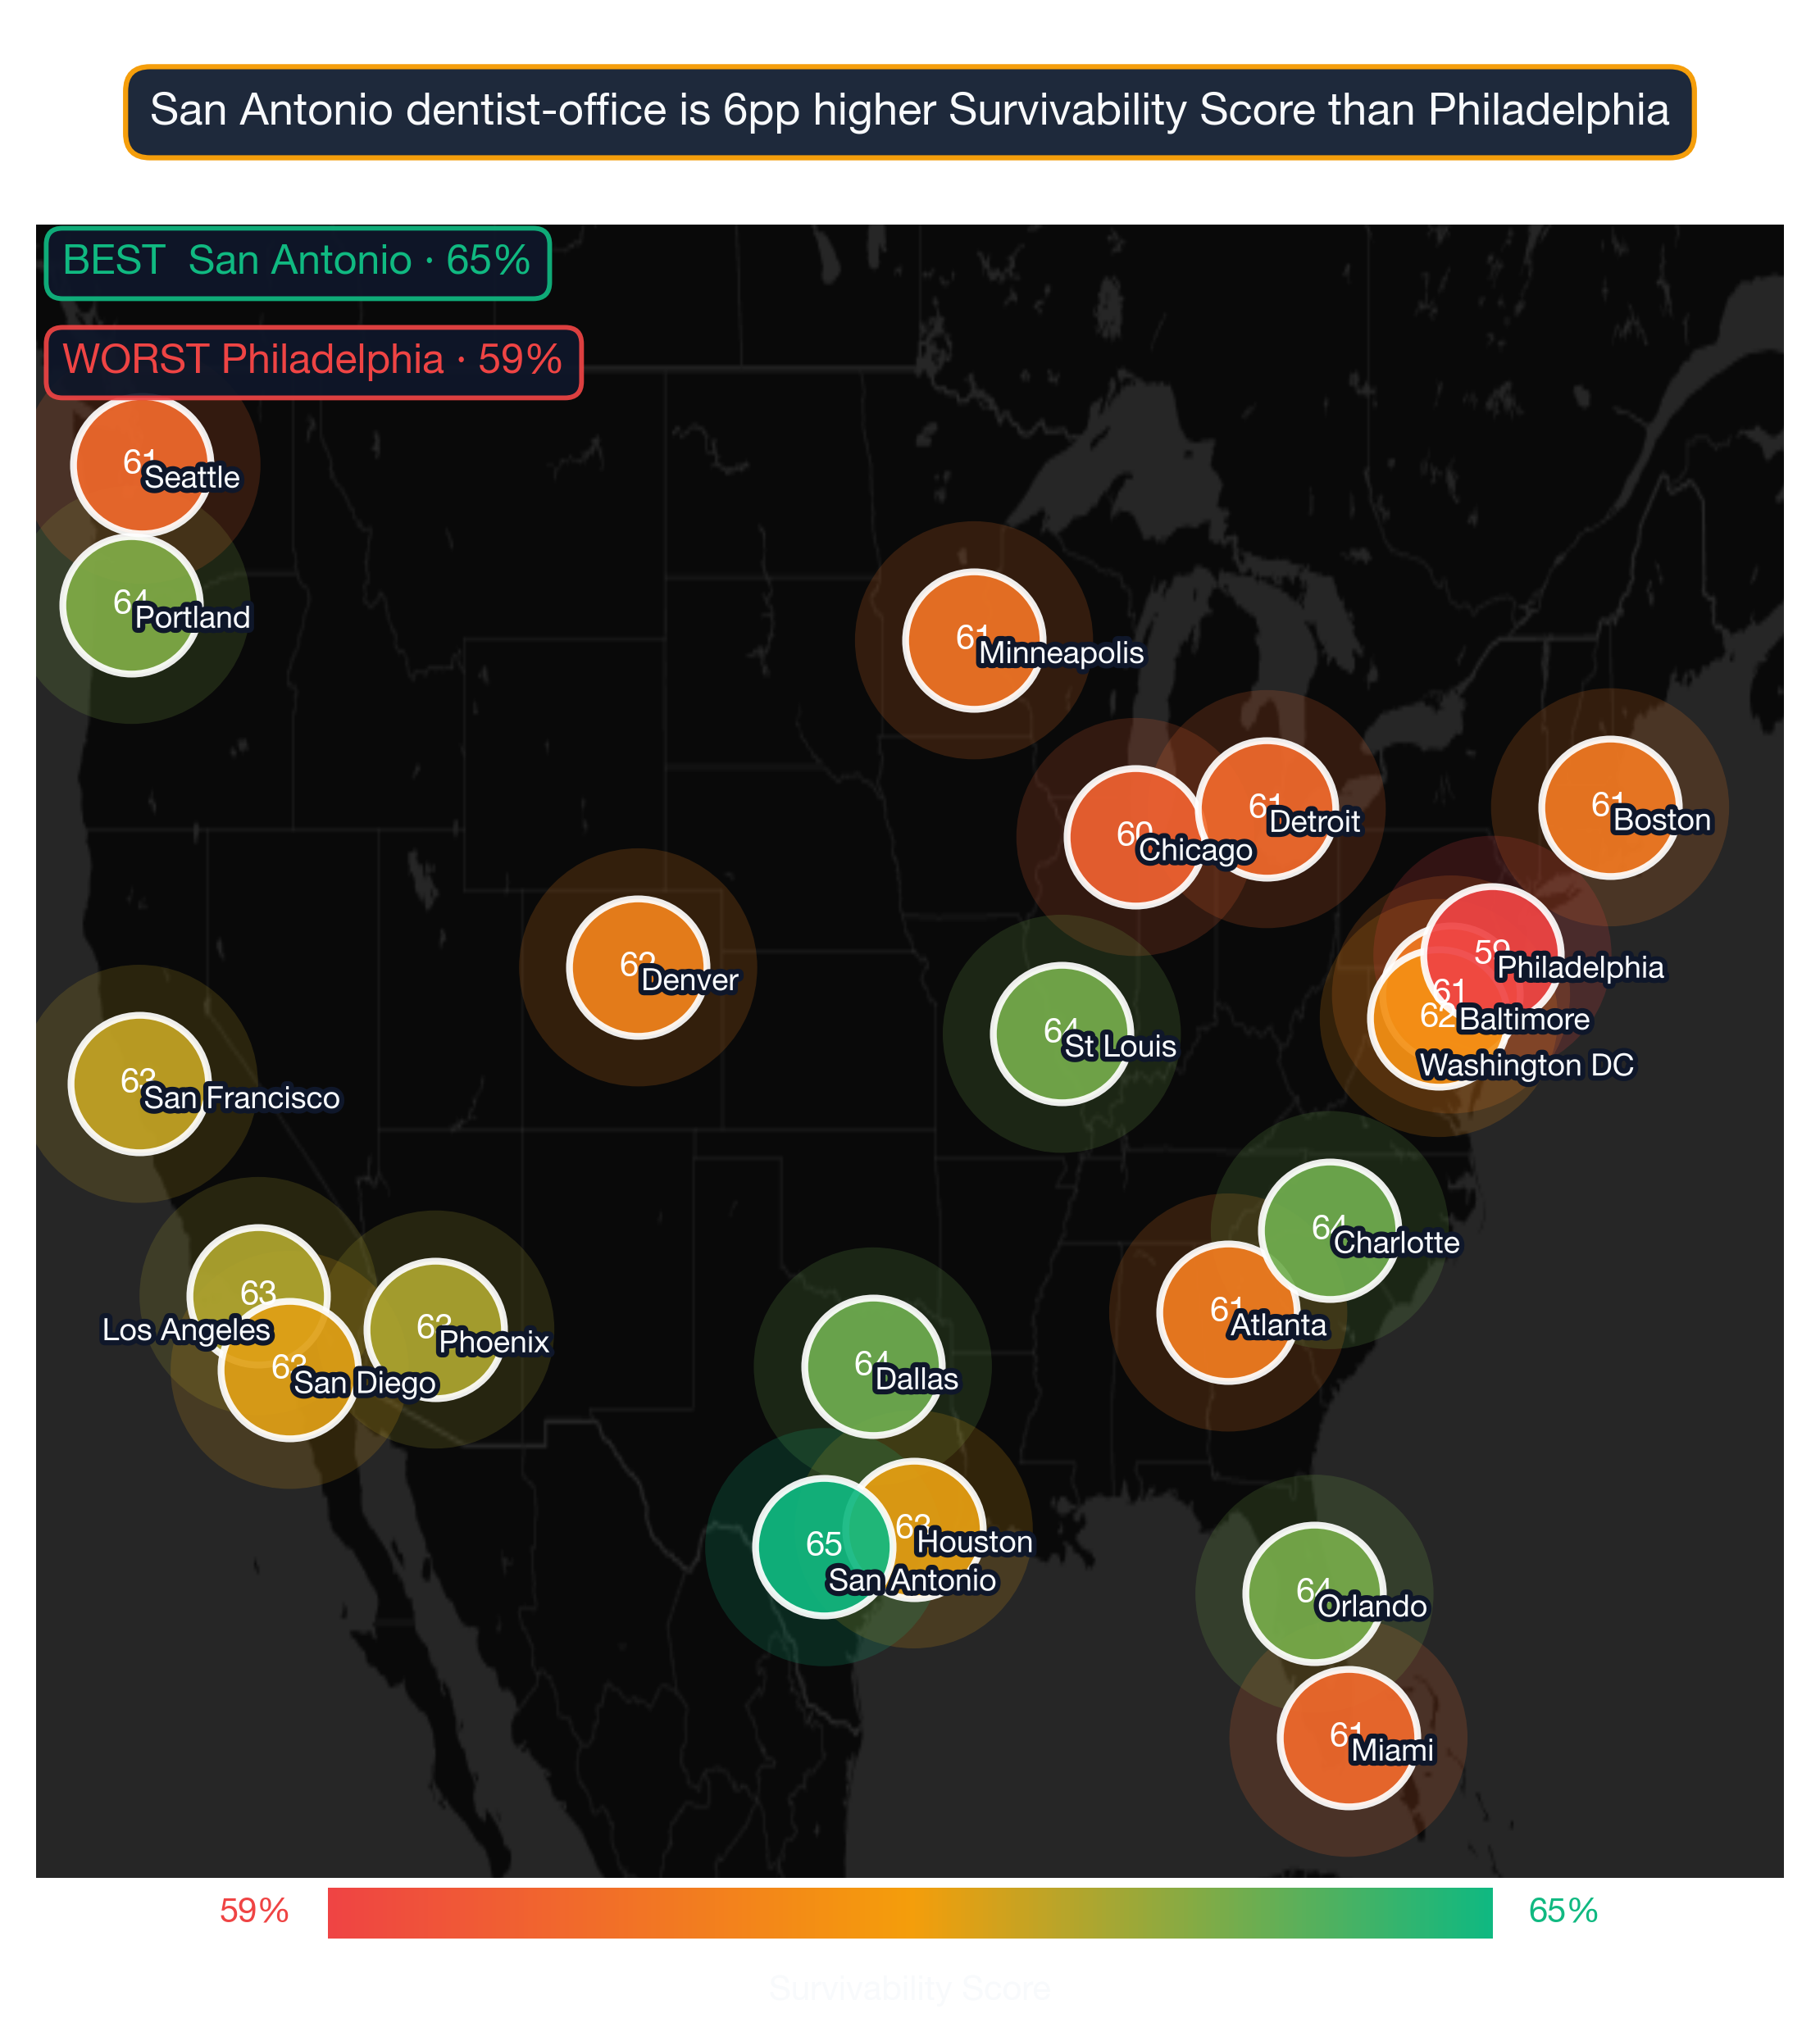
- The lowest-ranked city is Philadelphia at 59%
- National average survivability score for Dentist Office: 62.3%
- Data reflects 2026 StreetSpring survivability analysis across 24 US metro areas · Full methodology →
Table of Contents
- Summary
- Top Cities for Dentist Offices
- Key Insights
- What Makes These Cities Stand Out?
- Related Resources
- How current is this ranking?
- Can a Dentist Office succeed in cities not ranked in the top 10?
- What tools can help me choose the right city for a Dentist Office?
- Which US city has the best survivability for Dentist Offices?
Summary
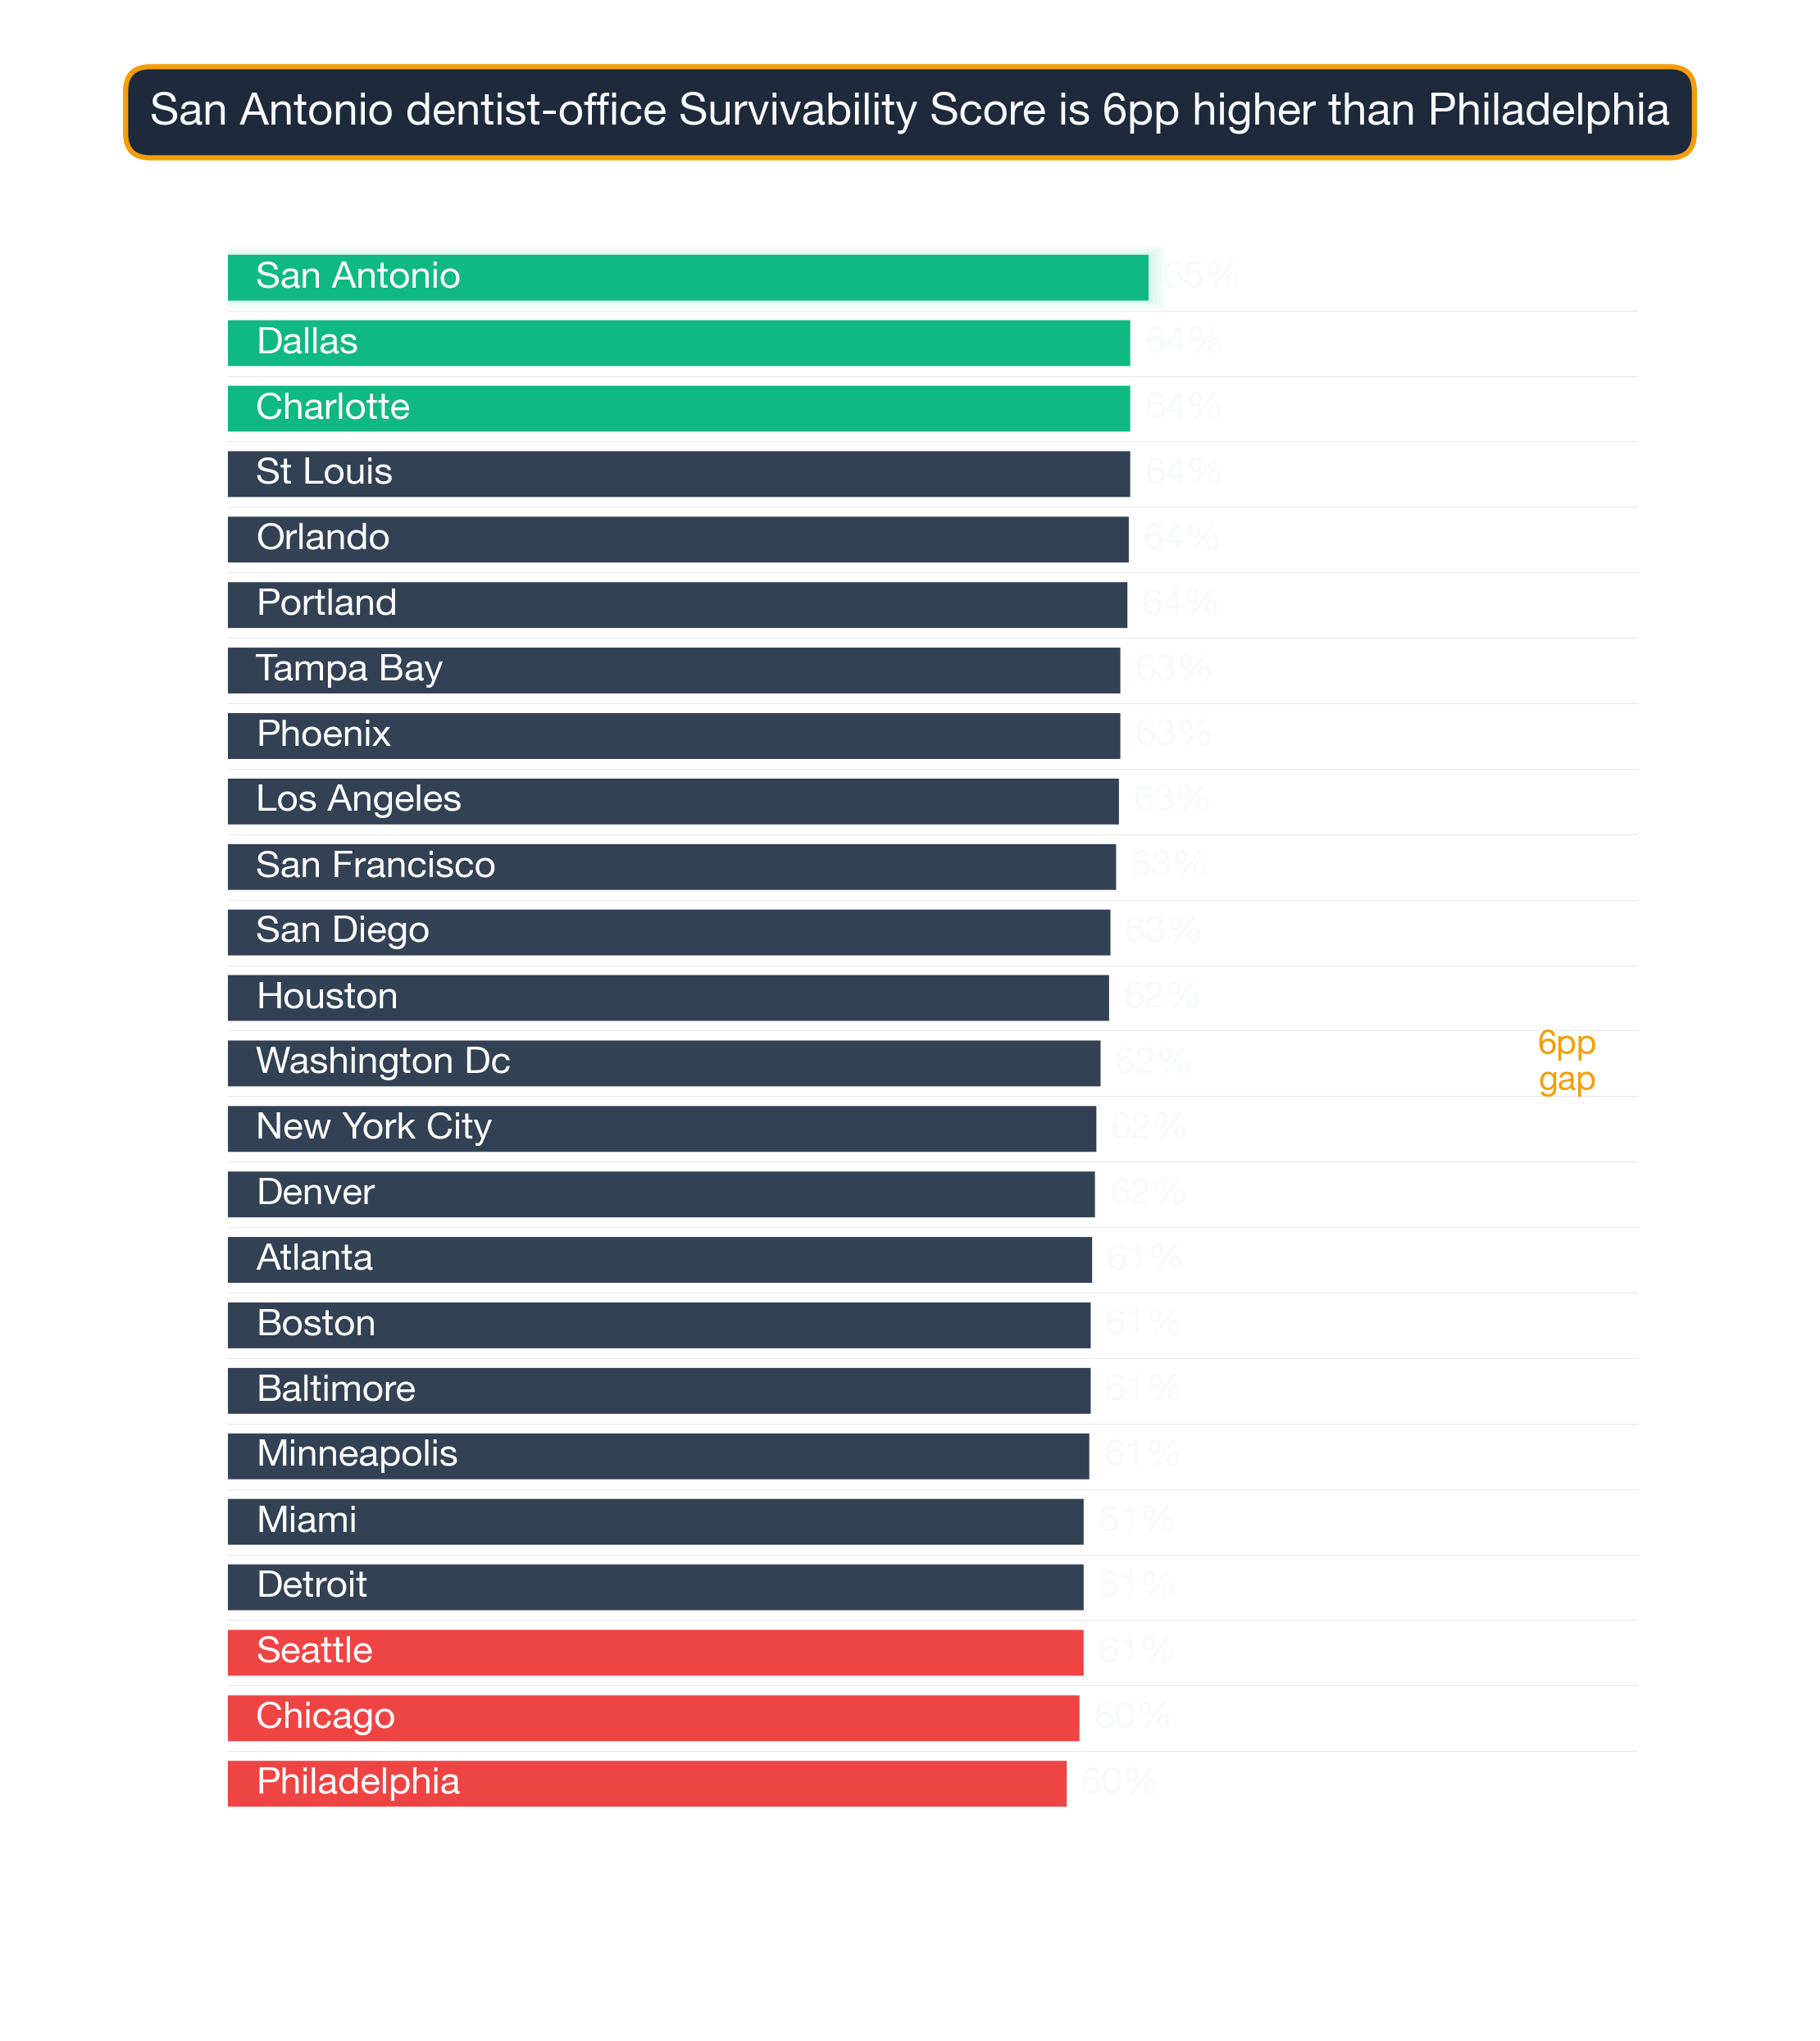
According to StreetSpring's 2026 nationwide analysis, San Antonio ranks as the #1 city for opening a Dentist Office in the United States, with an average 65% chance of surviving more than 2 years. Following close behind are Dallas with 64%, and Charlotte with 64%. The 24-city analysis shows Dentist Offices performing at a 62.3% national average, with strong geographic concentration of top scores in a handful of metros. Keep in mind that results depend heavily on the exact location; strong sites often exist within cities that seem less favorable overall. The best way to use these rankings is as a starting point — layer in your own market research and local knowledge before committing.
Survivability ranges reflect best and worst storefront conditions within each city. See our full methodology →

Dentist Office city survivability rankings — San Antonio leads among 24 US metros at 65% in 2026
The 24-City Survivability Index for Dentist Offices
Based on StreetSpring's analysis of 24 major metropolitan areas, these cities offer the strongest prospects for Dentist Offices:
1. San Antonio Metro: San Antonio-New Braunfels, TX
- Best locations: 71.4% – 79.0%
- Average locations: 62.6% – 66.9%
- Challenging locations: 43.0% – 58.6%
- Explore Dentist Office neighborhoods in San Antonio →
What the score range across cities tells you
2. Dallas Metro: Dallas-Fort Worth-Arlington, TX
- Best locations: 70.3% – 78.0%
- Average locations: 61.4% – 65.7%
- Challenging locations: 42.0% – 57.4%
- Explore Dentist Office neighborhoods in Dallas →
3. Charlotte Metro: Charlotte-Concord-Gastonia, NC-SC
- Best locations: 71.2% – 80.0%
- Average locations: 61.4% – 65.9%
- Challenging locations: 42.0% – 57.4%
- Explore Dentist Office neighborhoods in Charlotte →
4. St Louis
- Best locations: 70.7% – 79.0%
- Average locations: 60.8% – 65.8%
- Challenging locations: 38.0% – 56.2%
- Explore Dentist Office neighborhoods in St Louis →
5. Orlando Metro: Orlando-Kissimmee-Sanford, FL
- Best locations: 70.7% – 79.0%
- Average locations: 60.7% – 65.8%
- Challenging locations: 37.0% – 55.9%
- Explore Dentist Office neighborhoods in Orlando →
6. Portland Metro: Portland-Vancouver-Hillsboro, OR-WA
- Best locations: 70.7% – 79.0%
- Average locations: 61.1% – 65.7%
- Challenging locations: 41.0% – 57.0%
- Explore Dentist Office neighborhoods in Portland →
7. Tampa Bay Metro: Tampa-St. Petersburg-Clearwater, FL
- Best locations: 70.3% – 79.0%
- Average locations: 60.5% – 65.2%
- Challenging locations: 40.0% – 56.3%
- Explore Dentist Office neighborhoods in Tampa Bay →
8. Phoenix Metro: Phoenix-Mesa-Chandler, AZ
- Best locations: 70.8% – 80.0%
- Average locations: 60.6% – 65.3%
- Challenging locations: 41.0% – 56.6%
- Explore Dentist Office neighborhoods in Phoenix →
9. Los Angeles Metro: Los Angeles-Long Beach-Anaheim, CA
- Best locations: 71.7% – 82.0%
- Average locations: 60.2% – 65.5%
- Challenging locations: 38.0% – 55.7%
- Explore Dentist Office neighborhoods in Los Angeles →
10. San Francisco Metro: San Francisco-Oakland-Fremont, CA
- Best locations: 70.2% – 79.0%
- Average locations: 60.2% – 64.9%
- Challenging locations: 40.0% – 56.1%
- Explore Dentist Office neighborhoods in San Francisco →
11. San Diego Metro: San Diego-Chula Vista-Carlsbad, CA
- Best locations: 69.5% – 78.0%
- Average locations: 59.7% – 64.5%
- Challenging locations: 38.0% – 55.2%
- Explore Dentist Office neighborhoods in San Diego →
12. Houston Metro: Houston-Pasadena-The Woodlands, TX
- Best locations: 72.2% – 84.0%
- Average locations: 59.9% – 65.1%
- Challenging locations: 41.0% – 56.1%
- Explore Dentist Office neighborhoods in Houston →
Why the same business does so differently city to city
13. Washington DC Metro: Washington-Arlington-Alexandria, DC-VA-MD-WV
- Best locations: 69.6% – 79.0%
- Average locations: 59.0% – 63.9%
- Challenging locations: 38.0% – 54.7%
- Explore Dentist Office neighborhoods in Washington DC →
14. New York City Metro: New York-Newark-Jersey City, NY-NJ
- Best locations: 70.3% – 81.0%
- Average locations: 58.7% – 63.9%
- Challenging locations: 38.0% – 54.5%
- Explore Dentist Office neighborhoods in New York City →
15. Denver Metro: Denver-Aurora-Centennial, CO
- Best locations: 68.9% – 78.0%
- Average locations: 58.7% – 63.5%
- Challenging locations: 38.0% – 54.5%
- Explore Dentist Office neighborhoods in Denver →
16. Atlanta Metro: Atlanta-Sandy Springs-Roswell, GA
- Best locations: 69.3% – 79.0%
- Average locations: 58.6% – 63.4%
- Challenging locations: 39.0% – 54.6%
- Explore Dentist Office neighborhoods in Atlanta →
17. Boston Metro: Boston-Cambridge-Newton, MA-NH
- Best locations: 71.0% – 83.0%
- Average locations: 58.1% – 63.8%
- Challenging locations: 35.0% – 53.3%
- Explore Dentist Office neighborhoods in Boston →
18. Baltimore Metro: Baltimore-Columbia-Towson, MD
- Best locations: 69.7% – 80.0%
- Average locations: 58.7% – 63.5%
- Challenging locations: 40.0% – 54.8%
- Explore Dentist Office neighborhoods in Baltimore →
19. Minneapolis Metro: Minneapolis-St. Paul-Bloomington, MN-WI
- Best locations: 69.1% – 79.0%
- Average locations: 58.3% – 63.2%
- Challenging locations: 38.0% – 54.1%
- Explore Dentist Office neighborhoods in Minneapolis →
20. Detroit Metro: Detroit-Warren-Dearborn, MI
- Best locations: 68.5% – 78.0%
- Average locations: 58.1% – 62.8%
- Challenging locations: 39.0% – 54.2%
- Explore Dentist Office neighborhoods in Detroit →
21. Miami Metro: Miami-Fort Lauderdale-West Palm Beach, FL
- Best locations: 71.6% – 85.0%
- Average locations: 57.9% – 63.6%
- Challenging locations: 37.0% – 53.6%
- Explore Dentist Office neighborhoods in Miami →
22. Seattle Metro: Seattle-Tacoma-Bellevue, WA
- Best locations: 68.9% – 79.0%
- Average locations: 58.0% – 62.9%
- Challenging locations: 38.0% – 53.9%
- Explore Dentist Office neighborhoods in Seattle →
23. Chicago Metro: Chicago-Naperville-Elgin, IL-IN
- Best locations: 68.3% – 78.0%
- Average locations: 57.9% – 62.5%
- Challenging locations: 39.0% – 54.0%
- Explore Dentist Office neighborhoods in Chicago →
24. Philadelphia Metro: Philadelphia-Camden-Wilmington, PA-NJ-DE-MD
- Best locations: 70.1% – 83.0%
- Average locations: 56.8% – 62.3%
- Challenging locations: 37.0% – 52.7%
- Explore Dentist Office neighborhoods in Philadelphia →
What Stands Out in the Numbers
| Comparison factor | Top-tier city pattern | Bottom-tier city pattern |
|---|---|---|
| Cross-subtype clustering | Cities where the subtype clusters near complementary categories (e.g., coffee shops near coworking + gyms). | Cities where the subtype is dispersed across isolated storefronts without supporting foot-traffic. |
| Income distribution shape | Cities with a broad middle-class income band that supports the subtype's price tier. | Cities with bifurcated income distributions where the subtype's price point falls into the middle gap. |
| Daytime vs residential population mix | Cities with strong daytime employment density near the storefront catchment — CBD-adjacent mixed-use corridors. | Bedroom-community metros where daytime population evaporates by 9am and consumption shifts to 6pm dinner-only windows. |
Wide variation between cities: The difference between the #1 city (San Antonio at 65.3%) and the #24 city (Philadelphia at 59.5%) is 5.8 percentage points. The 1.2-point lead San Antonio holds over Dallas reflects real structural differences in how well each metro supports Dentist Offices — not just random variation.
Three findings worth pulling out of the data
Challenging markets: 1 city falls below 60% survivability, suggesting more difficult market conditions.
National average: Across all 24 analyzed cities, the average survivability for a Dentist Office is 62.3%.
What's Driving the Strongest Markets
The top-ranked cities share several characteristics that favor Dentist Offices:
- Strong survivability signals: San Antonio leads with a 65% average survivability score for Dentist Offices — significantly above the national average for this business category.
- Competition density: The top cities show favorable competitor-to-opportunity ratios for Dentist Offices, meaning lower saturation and higher odds of capturing an underserved customer base.
- Consumer demand signals: StreetSpring's data captures foot traffic patterns, competitor review velocity, and demographic fit — all pointing toward sustained demand for Dentist Offices in these markets.
- Low market saturation: Top cities for Dentist Offices have fewer direct competitors per square mile than lower-ranked metros, leaving meaningful whitespace for well-positioned new entrants.
This analysis leverages machine learning trained on hundreds of thousands of business lifecycle events to produce reliable survivability forecasts. We have been studying the businesses serving more than 180 million+ Americans. StreetSpring uses its own proprietary forecasting tools to make these predictions.
Visual Data
Related Resources
City-specific guides: For detailed neighborhood-level analysis, explore our city guides:
- Survivability Rankings for Dentist Office in San Antonio
- Business Survivability Rankings: San Antonio
- Survivability Rankings for Dentist Office in Dallas
- Business Survivability Rankings: Dallas
- Survivability Rankings for Dentist Office in Charlotte
- Business Survivability Rankings: Charlotte
- Survivability Rankings for Dentist Office in St Louis
- Business Survivability Rankings: St Louis
- Survivability Rankings for Dentist Office in Orlando
- Business Survivability Rankings: Orlando
National guides:
- National Neighborhood Survivability Rankings for Dentist Offices
- Neighborhood Survivability Rankings: San Antonio
How fresh is this city-survivability data?
Rankings are updated quarterly. The current data reflects StreetSpring's 2026 analysis, with the next full dataset refresh scheduled for Q3 2026. As market conditions shift across major metros, individual city scores can move meaningfully between updates — particularly for Dentist Offices, where local competition density and consumer spending patterns respond quickly to new entrants and neighborhood change. For the most current score at any specific address, use StreetSpring's live survivability tool rather than the static ranking above.
Should a Dentist Office avoid cities ranked below the top 10?
Yes — our top 10 ranking reflects cities with the strongest average conditions, but lower-ranked metros can still contain exceptional individual neighborhoods. Many operators successfully open Dentist Offices in cities that don't appear in our top 10. Dentist Offices in particular can find strong performance in secondary markets where the right demographic concentration, household income, and limited direct competition within walking distance align — even outside our highest-ranked cities. StreetSpring's neighborhood-level data surfaces these pockets of opportunity in every city we analyze, regardless of where the city as a whole ranks nationally.
What tools can help me choose the right city for a Dentist Office?
StreetSpring's Survivability Score tool provides address-level predictions for Dentist Offices across all 24 metros we track. For this category specifically, the tool surfaces competition density, consumer spending index for Dentist Offices, and commercial vacancy rates — the factors that most consistently predict whether a Dentist Office will still be operating after two years. You can check any specific address before signing a lease and compare multiple neighborhoods side by side to identify the highest-survivability site within your target city.
Try the Survivability Score tool →
Where in the US do Dentist Offices survive best?
San Antonio ranks as the #1 city in the US for Dentist Offices survivability in StreetSpring's 2026 analysis, with an average score of 65%. This means that across well-selected neighborhoods in San Antonio, a Dentist Office has approximately a 65% chance of still operating after two years — above the national average for this category. Dallas ranks second, followed by Charlotte. The full ranking reflects data across 24 major US metro areas — see the complete list above for all scores and neighborhood-level links.
Last reviewed by Bobby Koons, Founder & CEO, StreetSpring — May 4, 2026
Technical note: Aggregated national survivability rankings across all 24 metros are available in machine-readable format for research and integration purposes.
StreetSpring recalculates survivability using the latest competitive, demographic, and walkability data, so the live score may differ from the static ranges shown here.
Methodology: City rankings aggregate neighborhood-level Survivability Scores (max, average, and min) across all analyzed neighborhoods in each metro area. Rankings reflect average conditions but do not account for variation within cities. Coverage includes 24 major US metropolitan areas: San Antonio, Dallas, Charlotte, St Louis, Orlando, Portland, Tampa Bay, Phoenix, Los Angeles, San Francisco, San Diego, Houston, Washington DC, New York City, Denver, Atlanta, Boston, Baltimore, Minneapolis, Detroit, Miami, Seattle, Chicago, Philadelphia.