Survivability Rankings for Japanese / Sushi Restaurant in Boston
StreetSpring's 2026 analysis ranks the best and worst neighborhoods in Boston to open a Japanese / Sushi Restaurant, from Haverhill (87% survival) to Wi...
By Bobby Koons | Last reviewed: April 24, 2026 | New data weekly | Methodology
Quick Summary
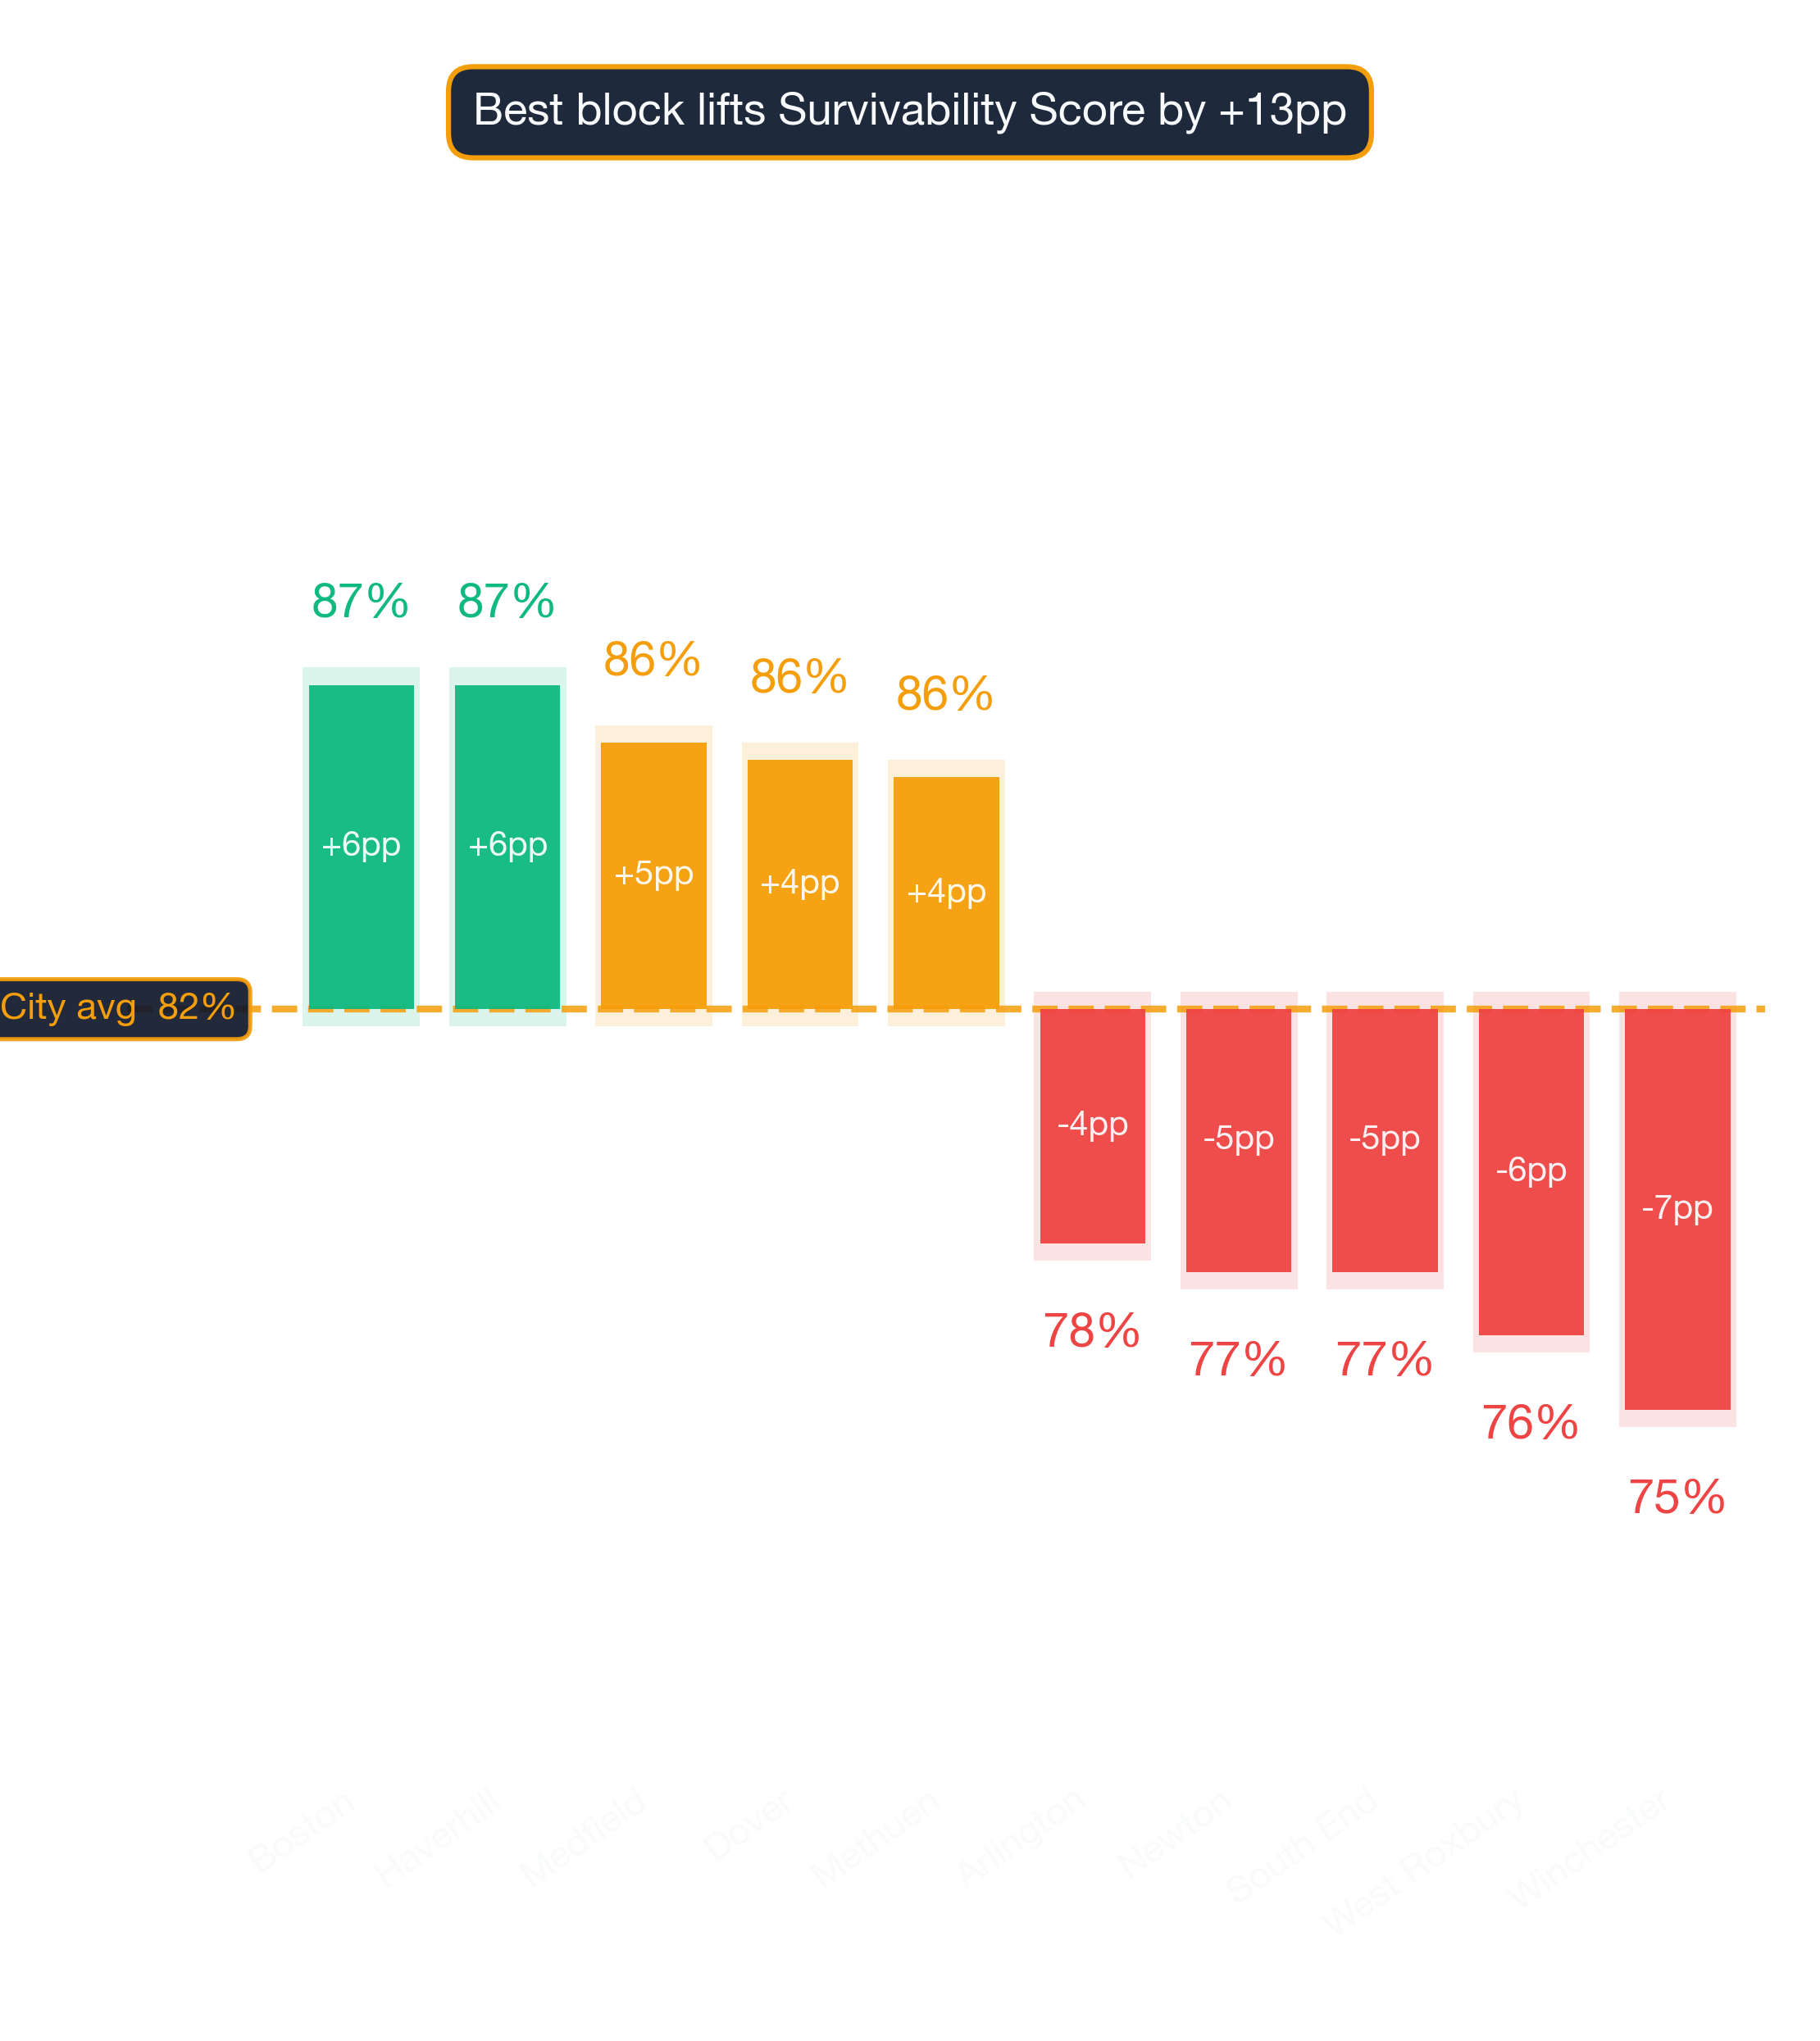
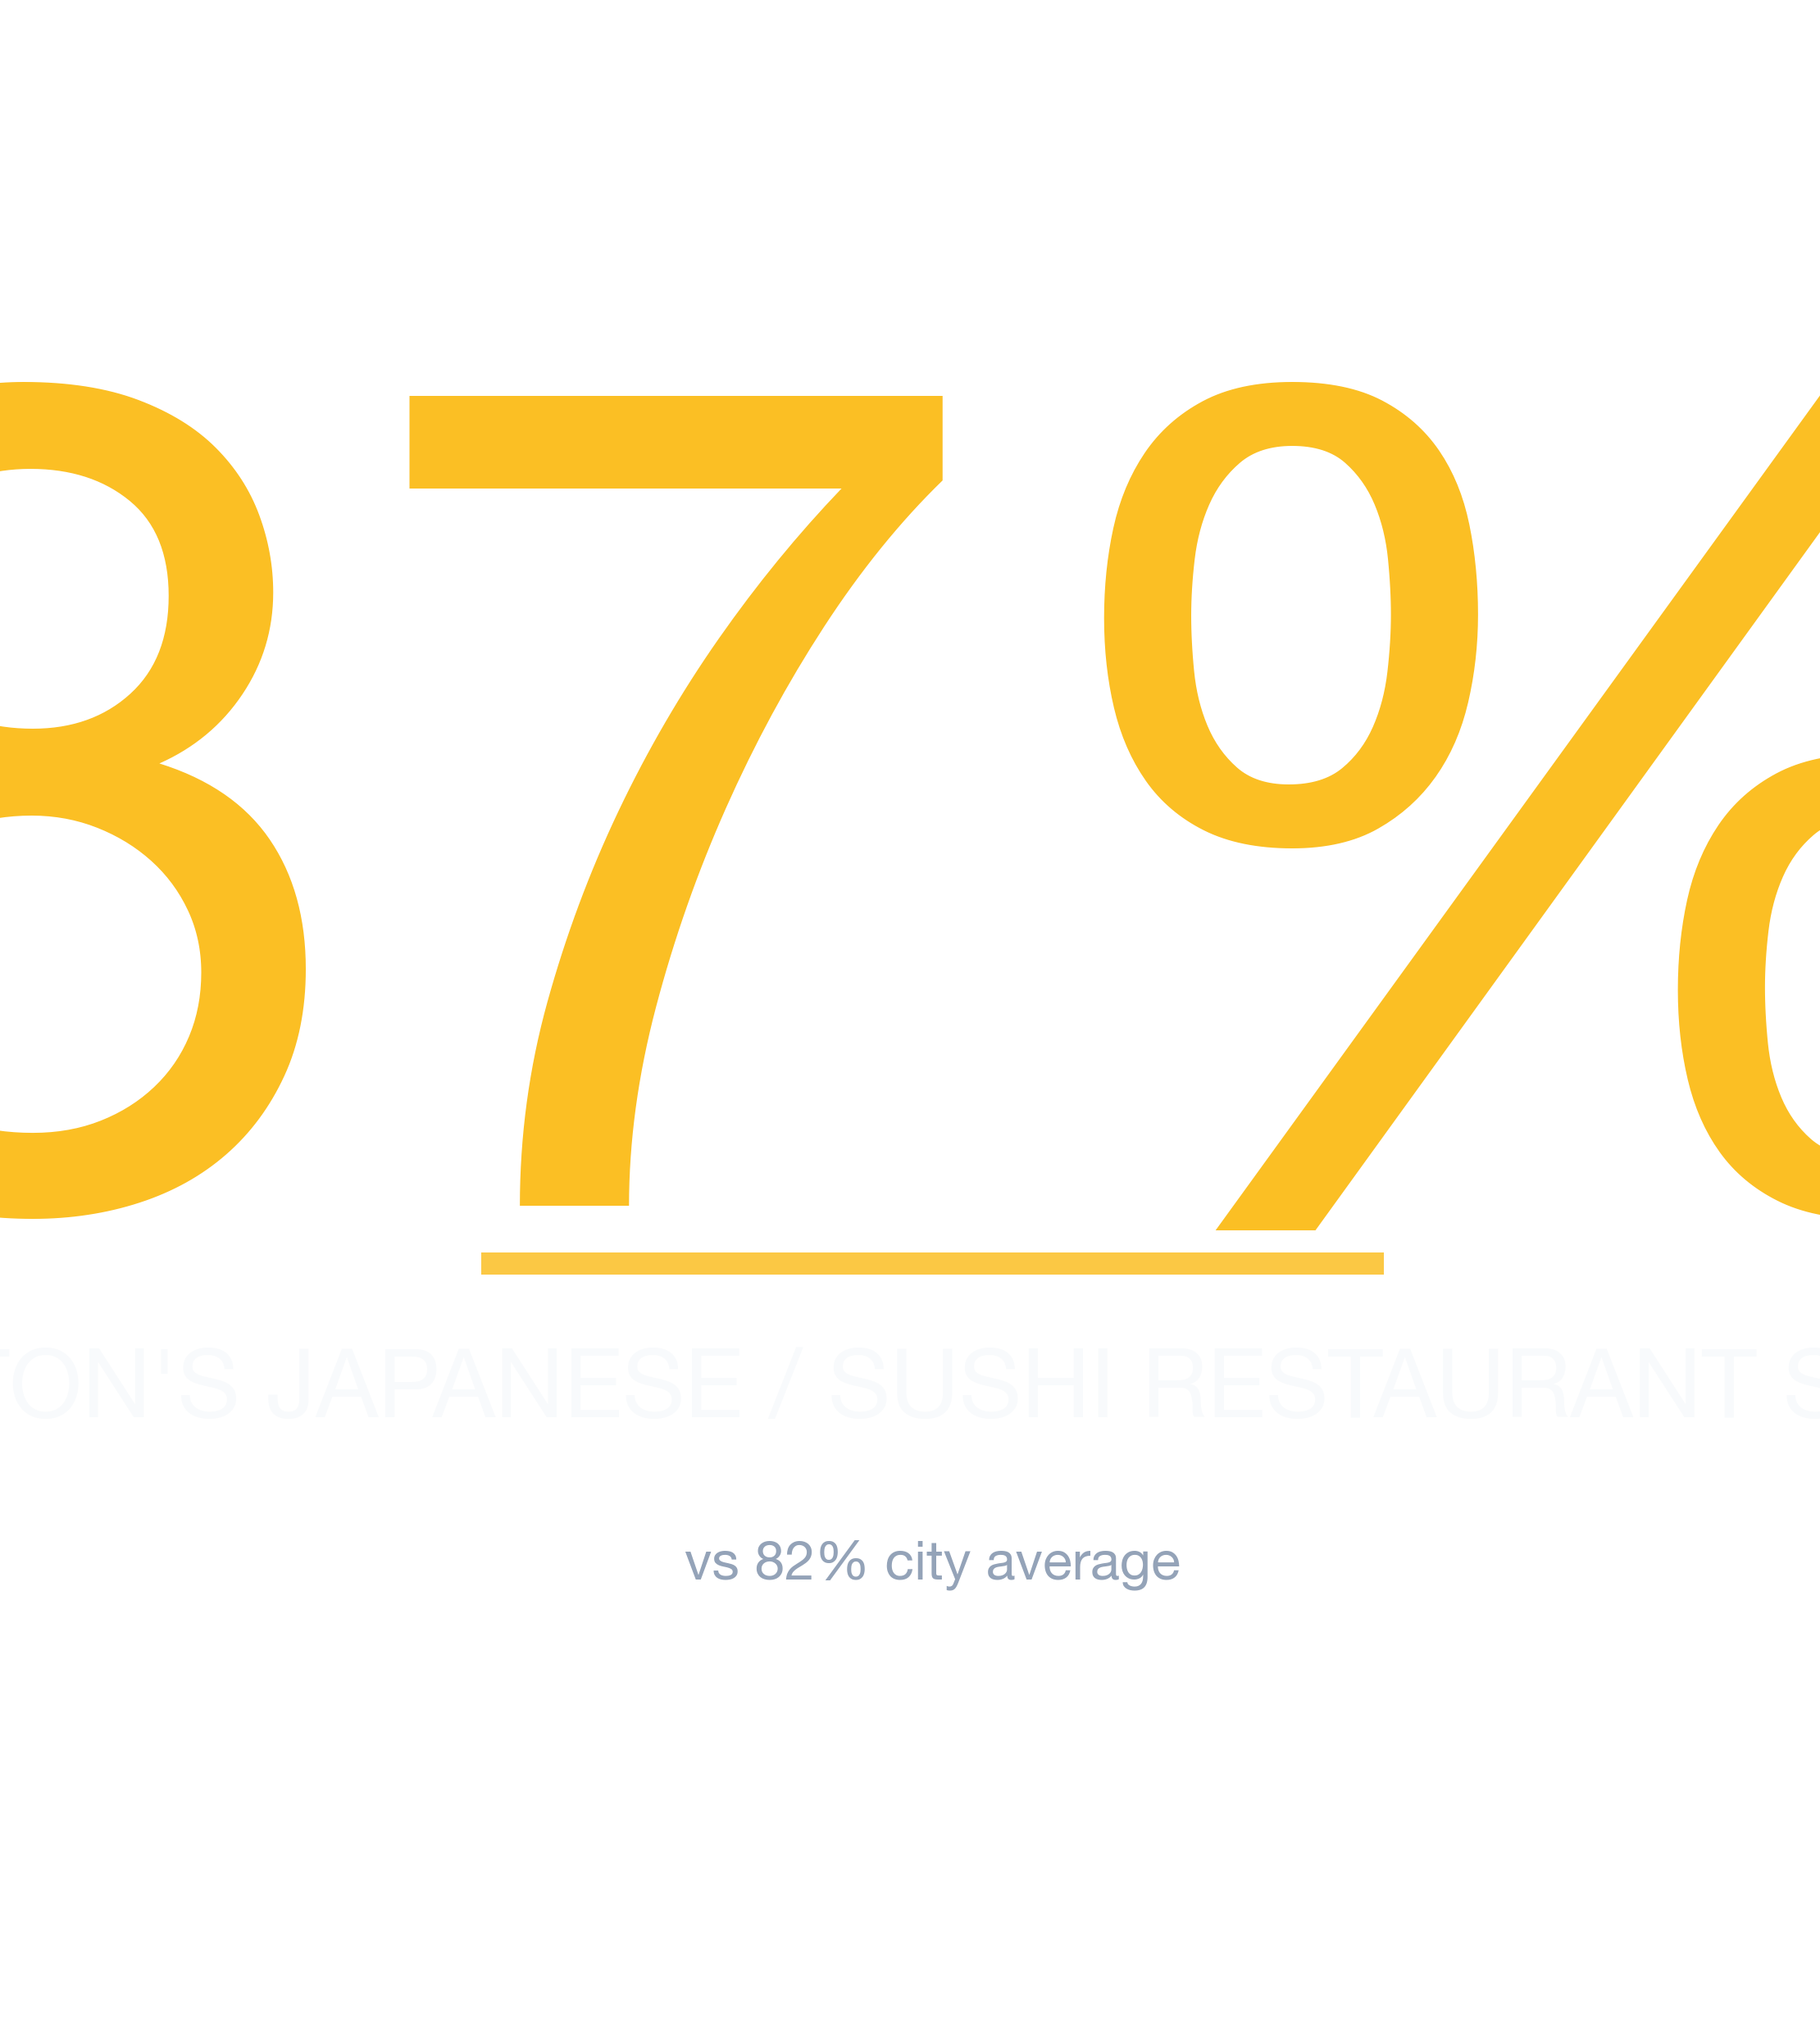
- #1 Neighborhood: Haverhill — 87% average survivability for Japanese / Sushi Restaurant
- Neighborhoods at or above 70%: 88 of 88 analyzed
- City-wide average: 82% for Japanese / Sushi Restaurants
- Most challenging area: Winchester at 75%
- Revenue advantage (top vs. avg location): ~7.0% more expected revenue in Haverhill
- Data freshness: 2026 data · Full methodology →
Table of Contents
- Summary
- 10 Best Neighborhoods
- Where Would a Japanese / Sushi Restaurant Make the Most Money?
- What Should I Consider?
- Where Should I Start?
- FAQ: Best Neighborhoods
- FAQ: Can a Japanese / Sushi Restaurant Succeed in Lower-Ranked Areas?
- FAQ: How Often Are Rankings Updated?
- FAQ: Is a Japanese / Sushi Restaurant a Good Tenant?
- Landlord Survivability Data
- Best Neighborhoods for Any Business
Summary
Haverhill leads Boston's 2026 survivability rankings for Japanese / Sushi Restaurant operators with 87% average chance of surviving more than 2 years, with the best locations offering 97% and the most challenging locations in Haverhill at 64%. The worst neighborhoods include Winchester with 75% average chance. However, individual locations vary widely, and even in lower-scoring neighborhoods there are pockets that perform exceptionally well.
Top-Survivability Boston Neighborhoods for Japanese / Sushi Restaurants
Haverhill ranks #1 of 88 neighborhoods analyzed in and around Boston for Japanese / Sushi Restaurant survivability with a score of 87% as of 2026. The top 10 neighborhoods are:
Where the rankings might surprise you
| Rank | Neighborhood | Best Locations | Average Locations | Challenging Locations |
|---|---|---|---|---|
| 1 | Haverhill | 94.0% – 97.0% | 85.2% – 88.6% | 63.0% – 67.0% |
| 2 | Boston | 90.0% – 94.0% | 85.1% – 88.6% | 73.0% – 77.0% |
| 3 | Medfield | 95.0% – 97.0% | 84.1% – 87.5% | 61.0% – 65.0% |
| 4 | Dover | 94.0% – 97.0% | 83.8% – 87.3% | 65.0% – 69.0% |
| 5 | Methuen | 94.0% – 97.0% | 83.5% – 87.0% | 66.0% – 70.0% |
| 6 | Spring Hill | 85.0% – 89.0% | 83.1% – 86.6% | 81.0% – 85.0% |
| 7 | Magoun Square | 86.0% – 90.0% | 83.0% – 86.5% | 77.0% – 81.0% |
| 8 | Riverside | 86.0% – 90.0% | 82.8% – 86.2% | 79.0% – 83.0% |
| 9 | Needham | 95.0% – 97.0% | 82.7% – 86.1% | 64.0% – 68.0% |
| 10 | Merrymount | 90.0% – 94.0% | 82.6% – 86.1% | 70.0% – 74.0% |
Reading the gap between #1 and #10
Day-to-day movement in the local market is normal, so StreetSpring's live data is the best source for an up-to-the-day score. However, market conditions change daily, and it's best to use StreetSpring's live data to check the Survivability Score for a specific address.
Survivability ranges reflect best and worst storefront conditions within each neighborhood. See our full methodology →
Try StreetSpring to see if this location is still the best and see if there are locations to rent in this area right now.
Boston's Best-Earning Neighborhoods for Japanese / Sushi Restaurants
In Haverhill, the best possible location offers the opportunity of making ~7.0% more than the average location in or around Boston.
On the other hand, in Winchester, the worst possible location could result in making ~8.6% less than the average location in the city.
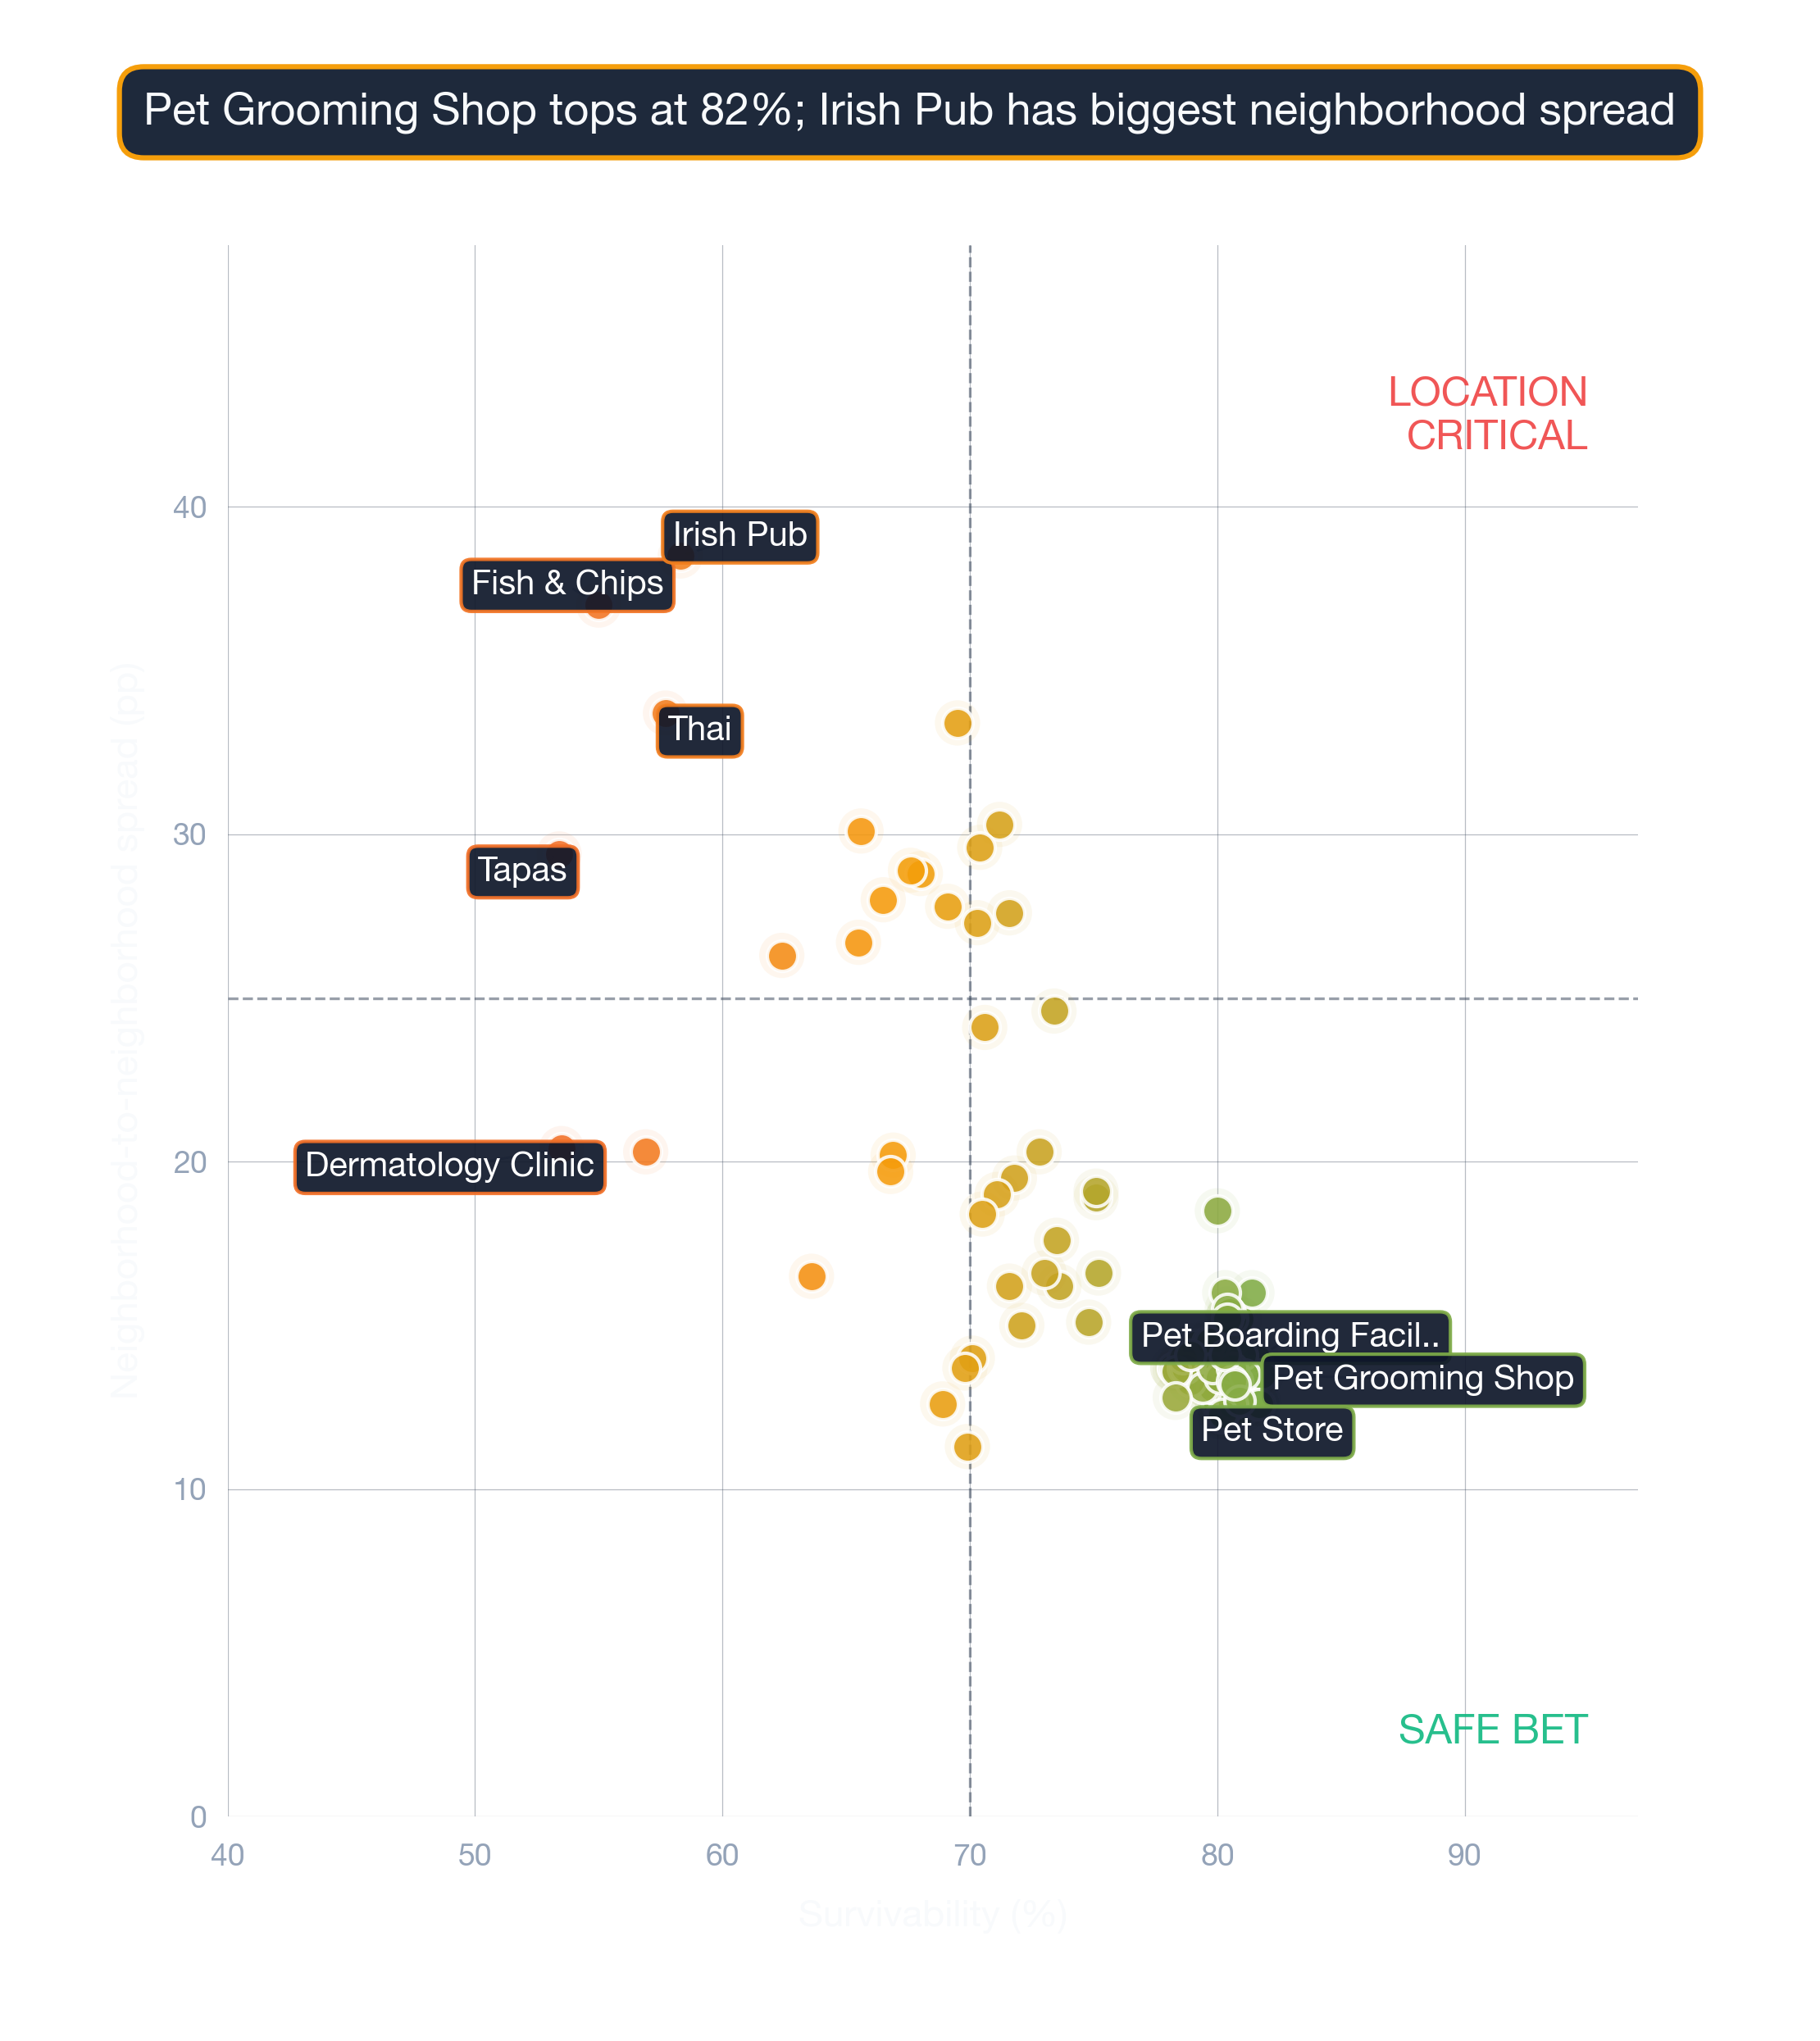
The right location can make a business; the wrong one can break it. Opening a Japanese / Sushi Restaurant in Boston requires careful location choice. Across 88 neighborhoods analyzed, the overall average survival chance for a new Japanese / Sushi Restaurant is 82% for lasting more than 2 years — due to a combination of many factors across competition, consumer spending, and location dynamics. The same location can be excellent for one business type and poor for another.
The Most Important Factors for a Japanese / Sushi Restaurant in Boston
Picking the right location is the single highest-leverage decision in launching this business — Survivability Score is the lens that frames the rest of the decision. No other single metric predicts business longevity as reliably as Revenue Capture Score. StreetSpring computes this by projecting the business's market share, which is based on the quality and quantity of primary, secondary, and tertiary competitors. The analysis behind these rankings spans millions of data points across competition, spending, and mobility. Our data shows that businesses in moderately competitive clusters survive longer than isolated storefronts on average. StreetSpring uses its own proprietary forecasting tools to make these predictions.
| Factor | Where new owners get tripped up | Questions to ask before you sign |
|---|---|---|
| Build-out budget | Underestimating mechanical, electrical, and plumbing — the "hidden" 30-50% of build-out cost. | Get 3 quotes from licensed contractors and pad budget by +20% for surprises. Confirm landlord TI allowance in writing. |
| Parking & visibility | Storefront looks great from the sidewalk but is invisible from the road. | Drive past at 30 mph from both directions. Count street parking + nearest paid lot capacity at peak hours. |
| CAM + hidden costs | Stated rent looks great, then CAM fees, signage charges, and after-hours utilities add 15-30%. | Get the full operating expense breakdown for the past 2 years. Ask which costs are landlord-capped vs. uncapped. |
This can be summarized as:
Revenue Capture Score = Projected Market Share × Forecasted Spend on Specific Business
Related: Survivability Score: How We Calculate It & Why It Matters
StreetSpring recalculates survivability using the latest competitive, demographic, and walkability data. The live platform incorporates the most recent foot traffic, competitor, and spending data for your exact address.
Where in or Around Boston Should I Start a Japanese / Sushi Restaurant?
For this business type, the highest-ranked neighborhoods are Haverhill, Boston, and Medfield, while the most challenging neighborhoods would be Winchester, West Roxbury, and Newton. A low-ranking neighborhood can still contain high-potential storefronts — the address matters most. Neighborhood rankings are useful, but the exact odds for your location can only be seen by running a current survivability check in StreetSpring.
Related Articles:
Where Japanese / Sushi Restaurants Thrive in Boston
Based on StreetSpring's 2026 analysis, the top neighborhood for a Japanese / Sushi Restaurant in Boston is Haverhill with 87% average survivability, followed by Boston and Medfield. 88 of 88 neighborhoods analyzed exceed 70% two-year survival.
Market dynamics shift frequently; validate these insights with real-time data from StreetSpring.
Are Bottom-Tier Boston Neighborhoods a No-Go for Japanese / Sushi Restaurants?
Yes — neighborhood averages mask significant block-by-block variation. Even in neighborhoods ranked outside the top 10, individual storefronts with strong foot traffic, low direct competition, and favorable lease terms can outperform the area average. Our data shows that roughly 15% of top-performing locations sit in neighborhoods ranked below the city median. Always check your specific address in StreetSpring's live platform for the most accurate prediction.
When Does StreetSpring Update Boston Japanese / Sushi Restaurant Rankings?
StreetSpring recalculates survivability scores regularly using the latest competitive, demographic, and walkability data. Rankings are updated quarterly; the live tool always reflects the most current predictions for any address in Boston.
What Makes a Japanese / Sushi Restaurant a Strong (or Weak) Boston Tenant?
In Haverhill, StreetSpring forecasts a 85.2% – 88.6% average chance for a new Japanese / Sushi Restaurant to survive more than 2 years, depending on the exact storefront. Check the current Survivability Score for any address instantly.
Landlord Survivability Data for Japanese / Sushi Restaurant in Boston
For landlords evaluating tenant applications, StreetSpring's data provides a clear comparison across the top neighborhoods. In Haverhill, a Japanese / Sushi Restaurant has a 85.2% – 88.6% average chance of surviving more than 2 years. In Boston, the range shifts to 85.1% – 88.6%, and in Medfield, it is 84.1% – 87.5%. Get a live Survivability Score for your specific storefront at no cost.
StreetSpring provides highly detailed forecasts — revealing how long hundreds of business types are likely to last at a specific address.
Related: How Landlord Representatives Can Reduce Vacancy & Increase Tenant Longevity
What Are the Best Neighborhoods in Boston to Open a Japanese / Sushi Restaurant?
You can see the best neighborhoods in or around Boston to open any type of business in our article Neighborhood Survivability Rankings: Boston.
Technical note: Aggregated survivability rankings for Boston are available in machine-readable format for research and integration purposes.
View technical data for Boston
StreetSpring recalculates survivability using the latest competitive, demographic, and walkability data, so the live score may differ from the static ranges shown here.
Visual Data
Related Resources
Same business type in other cities:
- Survivability Rankings for Japanese / Sushi Restaurant in Atlanta
- City Survivability Rankings for Japanese / Sushi Restaurant
Related:
Related:
Local Context FAQ
More questions answered with neighborhood-specific data from our 2026 corpus.
Where in the US do Japanese / Sushi Restaurants survive best?
Per StreetSpring's 24-metro model, the top three US cities for Japanese / Sushi Restaurants survivability are Portland, San Antonio, St. Louis. Boston ranks #21, averaging 86%.
Which Boston subtypes have comparable survivability to Japanese / Sushi Restaurants?
Per StreetSpring's Boston corpus, peers of Japanese / Sushi Restaurants (within 2 points of the 86% average) include Bagel Shop, Salad Shop, Pizza Restaurant.
How current is the Japanese / Sushi Restaurants data for Boston?
Quarterly. The 2026 corpus shows Japanese / Sushi Restaurants in Boston averaging 86%; quarterly refreshes integrate new competitor entries/exits, updated ACS data, and recalibrated lease rates.
How important is foot traffic / accessibility for a Japanese / Sushi Restaurant in Boston?
Median Boston commute is ~32 minutes. Accessibility-driven foot-traffic variation contributes to the 58-99% survivability range Japanese / Sushi Restaurants see across the metro.