Survivability Rankings for Hot Pot Restaurant in Boston
StreetSpring's 2026 analysis ranks the best and worst neighborhoods in Boston to open a Hot Pot Restaurant, from Davis Square (88% survival) to Winchest...
By Bobby Koons | Last reviewed: May 1, 2026 | New data weekly | Methodology
Quick Summary
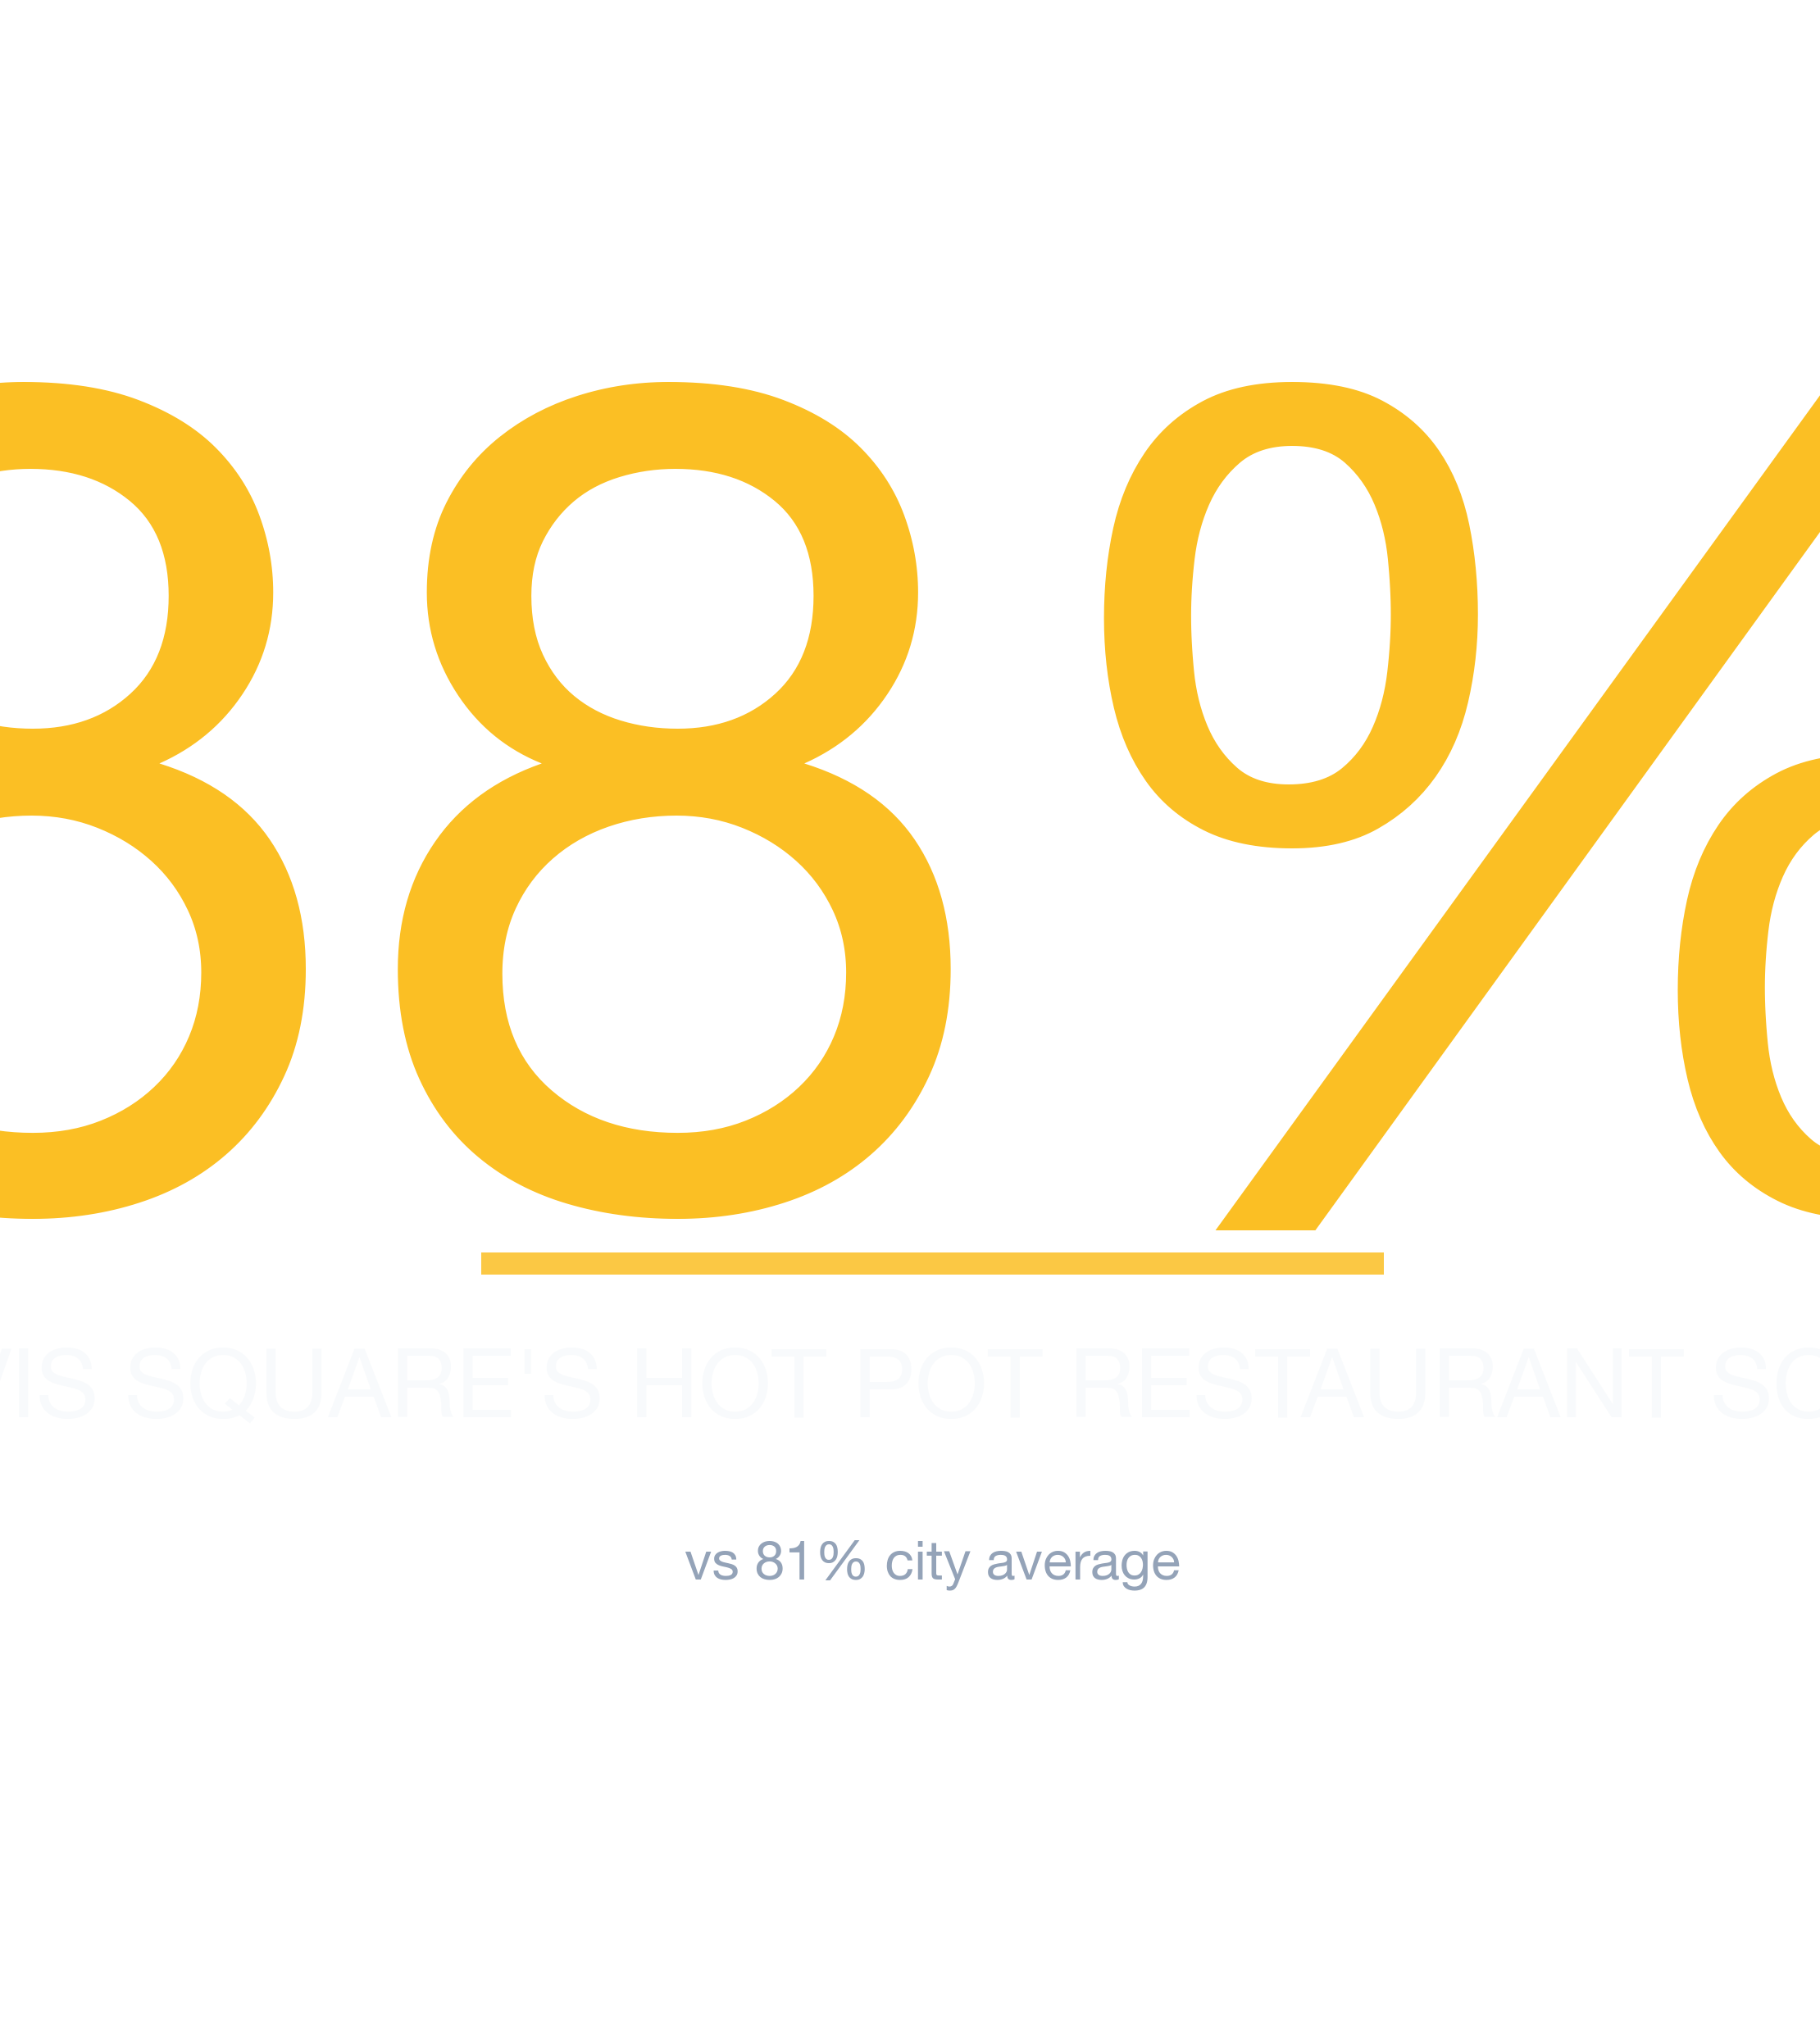
- #1 Neighborhood: Davis Square — 88% average survivability for Hot Pot Restaurant
- Neighborhoods at or above 70%: 88 of 88 analyzed
- City-wide average: 81% for Hot Pot Restaurants
- Most challenging area: Winchester at 75%
- Revenue advantage (top vs. avg location): ~7.9% more expected revenue in Davis Square
- Data freshness: 2026 data · Full methodology →
Table of Contents
- Summary
- 10 Best Neighborhoods
- Where Would a Hot Pot Restaurant Make the Most Money?
- What Should I Consider?
- Where Should I Start?
- FAQ: Best Neighborhoods
- FAQ: Can a Hot Pot Restaurant Succeed in Lower-Ranked Areas?
- FAQ: How Often Are Rankings Updated?
- FAQ: Is a Hot Pot Restaurant a Good Tenant?
- Landlord Survivability Data
- Best Neighborhoods for Any Business
Summary
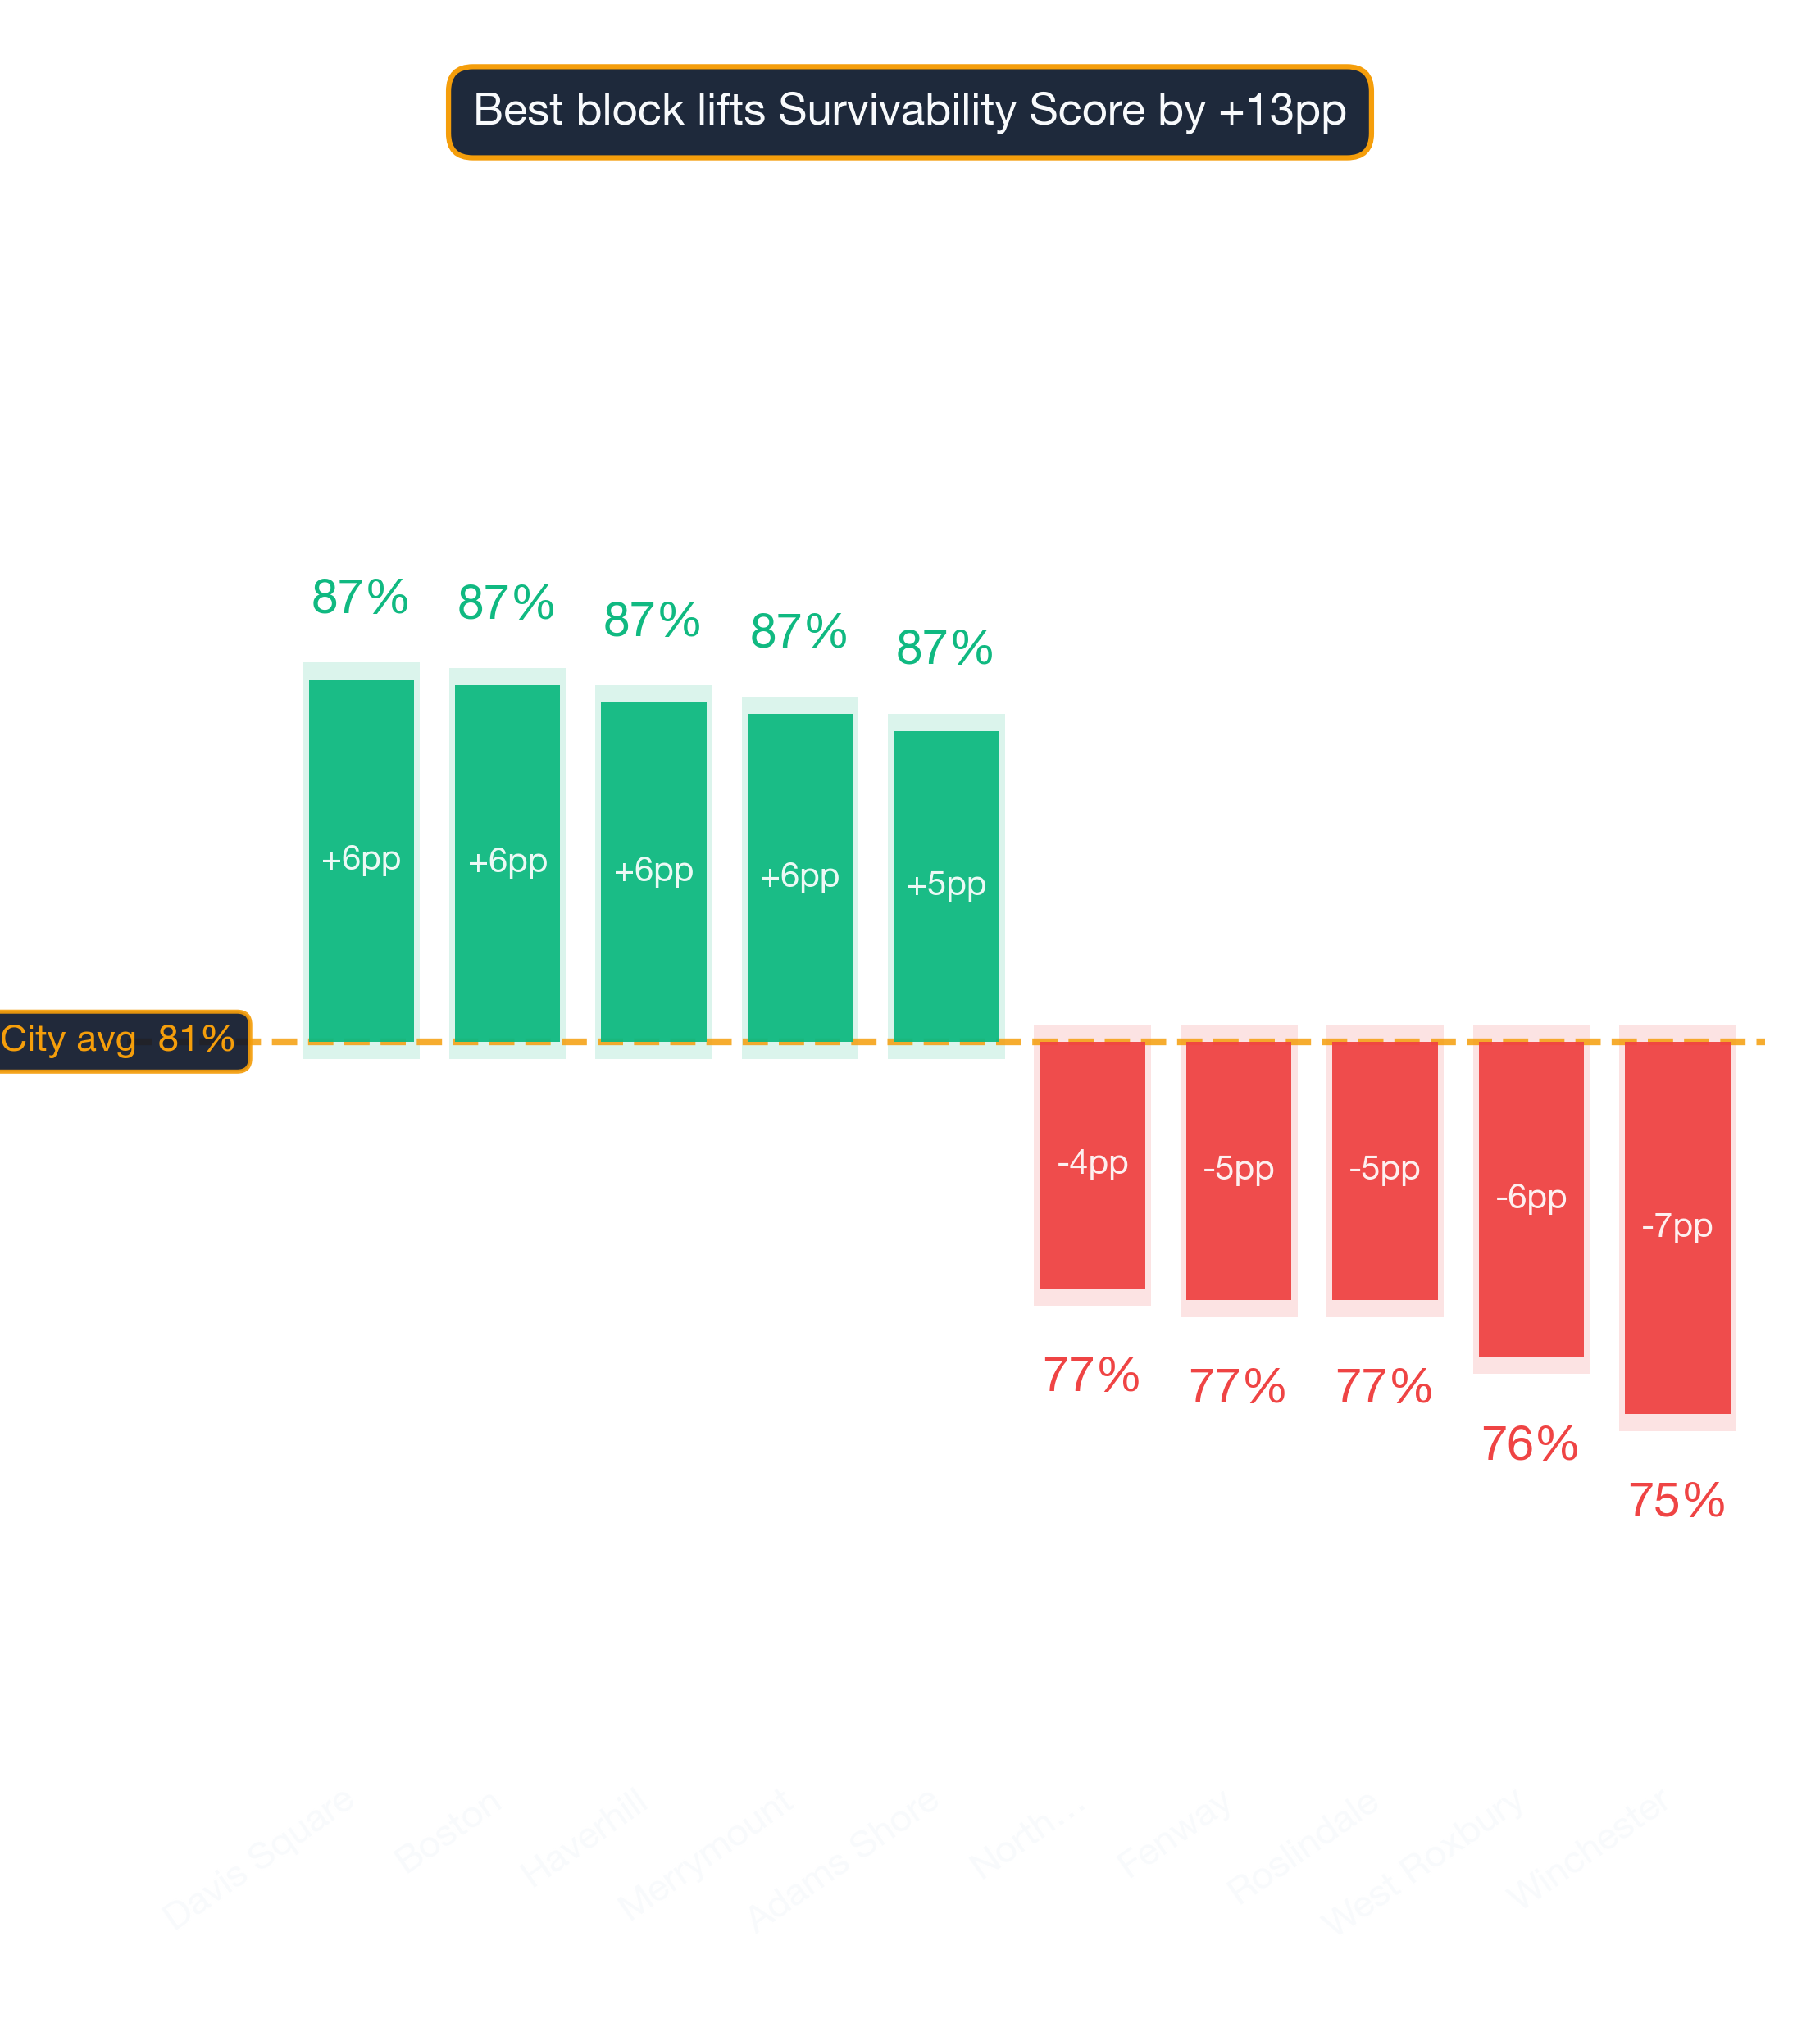
StreetSpring's 2026 analysis shows the best neighborhood in and around Boston to open a Hot Pot Restaurant is Davis Square with 88% average chance of surviving more than 2 years, with the best locations offering 91% and the most challenging locations in Davis Square at 83%. The worst neighborhoods include Winchester with 75% average chance. StreetSpring's Survivability Scores are updated regularly, so the most accurate prediction for your exact storefront is always available in the live tool.
What Are the Best Neighborhoods in Boston to Open a Hot Pot Restaurant?
Davis Square ranks #1 of 88 neighborhoods analyzed in and around Boston for Hot Pot Restaurant survivability with a score of 88% as of 2026. The top 10 neighborhoods are:
Why these rankings reflect real survival outcomes
| Rank | Neighborhood | Best Locations | Average Locations | Challenging Locations |
|---|---|---|---|---|
| 1 | Davis Square | 88.0% – 92.0% | 85.4% – 89.2% | 82.0% – 86.0% |
| 2 | Boston | 90.0% – 94.0% | 85.3% – 89.1% | 71.0% – 75.0% |
| 3 | Haverhill | 93.0% – 97.0% | 85.0% – 88.8% | 63.0% – 67.0% |
| 4 | Merrymount | 90.0% – 94.0% | 84.8% – 88.6% | 73.0% – 77.0% |
| 5 | Adams Shore | 91.0% – 95.0% | 84.5% – 88.3% | 72.0% – 76.0% |
| 6 | Medfield | 94.0% – 97.0% | 83.9% – 87.8% | 62.0% – 66.0% |
| 7 | Dover | 93.0% – 97.0% | 83.6% – 87.5% | 66.0% – 70.0% |
| 8 | Methuen | 93.0% – 97.0% | 83.3% – 87.2% | 65.0% – 69.0% |
| 9 | Aggasiz - Harvard North | 84.0% – 88.0% | 83.3% – 87.1% | 81.0% – 85.0% |
| 10 | Spring Hill | 87.0% – 91.0% | 82.5% – 86.4% | 80.0% – 84.0% |
Notable runners-up worth a second look
Location-level factors like visibility and adjacent tenants can override neighborhood-level trends. New competitor openings and closures happen weekly — the live tool ensures you see the latest picture.
Survivability ranges reflect best and worst storefront conditions within each neighborhood. See our full methodology →
Try StreetSpring to see if this location is still the best and see if there are locations to rent in this area right now.
The Top Revenue Neighborhoods for Hot Pot Restaurants in Boston
In Davis Square, the best possible location offers the opportunity of making ~7.9% more than the average location in or around Boston.
On the other hand, in Winchester, the worst possible location could result in making ~8.1% less than the average location in the city.
Choosing the right address is the highest-leverage decision for any brick-and-mortar entrepreneur. Opening a Hot Pot Restaurant in Boston requires careful location choice. Across 88 neighborhoods analyzed, the overall average survival chance for a new Hot Pot Restaurant is 81% for lasting more than 2 years — due to a combination of many factors across competition, consumer spending, and location dynamics. A high-traffic corner that works well for a coffee shop may be entirely wrong for a specialty retailer.
The Most Important Factors for a Hot Pot Restaurant in Boston
Selecting a high-survivability address is the single most cost-effective risk reduction available before signing a lease. Everything downstream depends on it. When evaluating a potential location, Revenue Capture Score should be the first number you look at. StreetSpring computes this by projecting the business's market share, which is based on the quality and quantity of primary, secondary, and tertiary competitors. Our platform incorporates data from thousands of neighborhoods nationwide. Some of the best-performing locations are surrounded by complementary competitors that drive foot traffic. Our forecasting system combines proprietary data with machine learning models unavailable anywhere else.
| Consideration | Common pitfall | What to verify before signing |
|---|---|---|
| Permits & licensing | Assuming a 30-day permit timeline, hitting 90+ days, paying rent on a non-operating storefront. | Call the local zoning office before signing. Confirm your use is already permitted; if not, factor a 2-3 month variance timeline. |
| Permitted hours | Late-night or early-morning ops blocked by zoning, neighborhood association, or shared-wall restrictions. | Confirm the permitted hours-of-operation are in your lease AND in the local code. Pull recent variances or complaints from the zoning portal. |
| Workforce availability | Hiring radius is smaller than you think — many neighborhoods can't staff a full team at standard wages. | Pull BLS wage data for your industry in this metro. Walk through your staffing plan with a local restaurant/retail operator before signing. |
This can be summarized as:
Revenue Capture Score = Projected Market Share × Forecasted Spend on Specific Business
Related: Survivability Score: How We Calculate It & Why It Matters
StreetSpring recalculates survivability using the latest competitive, demographic, and walkability data. Real-time data from StreetSpring accounts for recent openings, closures, and seasonal shifts that static rankings cannot.
Which Boston Block Is Right for a Hot Pot Restaurant?
Based on our analysis, the leading neighborhoods are Davis Square, Boston, and Haverhill, while the most challenging neighborhoods would be Winchester, West Roxbury, and Roslindale. Location-level factors like visibility and adjacent tenants can override neighborhood-level trends. Real-time data from StreetSpring accounts for recent openings, closures, and seasonal shifts that static rankings cannot.
Related Articles:
Where in Boston Should You Open a Hot Pot Restaurant?
Based on StreetSpring's 2026 analysis, the top neighborhood for a Hot Pot Restaurant in Boston is Davis Square with 88% average survivability, followed by Boston and Haverhill. 88 of 88 neighborhoods analyzed exceed 70% two-year survival.
Static rankings provide a useful baseline, but the live tool captures changes that have occurred since publication.
Are Bottom-Tier Boston Neighborhoods a No-Go for Hot Pot Restaurants?
Yes — neighborhood averages mask significant block-by-block variation. Even in neighborhoods ranked outside the top 10, individual storefronts with strong foot traffic, low direct competition, and favorable lease terms can outperform the area average. These averages are directional, not definitive; the best decision comes from analyzing your specific storefront. Always check your specific address in StreetSpring's live platform for the most accurate prediction.
Refresh Cadence for Boston Hot Pot Restaurant Survivability Rankings
StreetSpring recalculates survivability scores regularly using the latest competitive, demographic, and walkability data. Rankings are updated quarterly; the live tool always reflects the most current predictions for any address in Boston.
Should You Rent Your Boston Storefront to a Hot Pot Restaurant?
In Davis Square, StreetSpring forecasts a 85.4% – 89.2% average chance for a new Hot Pot Restaurant to survive more than 2 years, depending on the exact storefront. Check the current Survivability Score for any address instantly.
Landlord Survivability Data for Hot Pot Restaurant in Boston
Should you rent your storefront to a Hot Pot Restaurant? The answer depends heavily on your neighborhood. Davis Square offers the strongest outlook at 85.4% – 89.2% average survivability, followed by Boston at 85.3% – 89.1%, and Haverhill at 85.0% – 88.8%. You can see the Survivability Score for your location for any business right now.
StreetSpring delivers pinpoint accuracy down to the exact storefront location.
Related: How Landlord Representatives Can Reduce Vacancy & Increase Tenant Longevity
Which Boston Neighborhoods Are Strongest for Hot Pot Restaurants?
You can see the best neighborhoods in or around Boston to open any type of business in our article Neighborhood Survivability Rankings: Boston.
Technical note: Aggregated survivability rankings for Boston are available in machine-readable format for research and integration purposes.
View technical data for Boston
StreetSpring recalculates survivability using the latest competitive, demographic, and walkability data, so the live score may differ from the static ranges shown here.
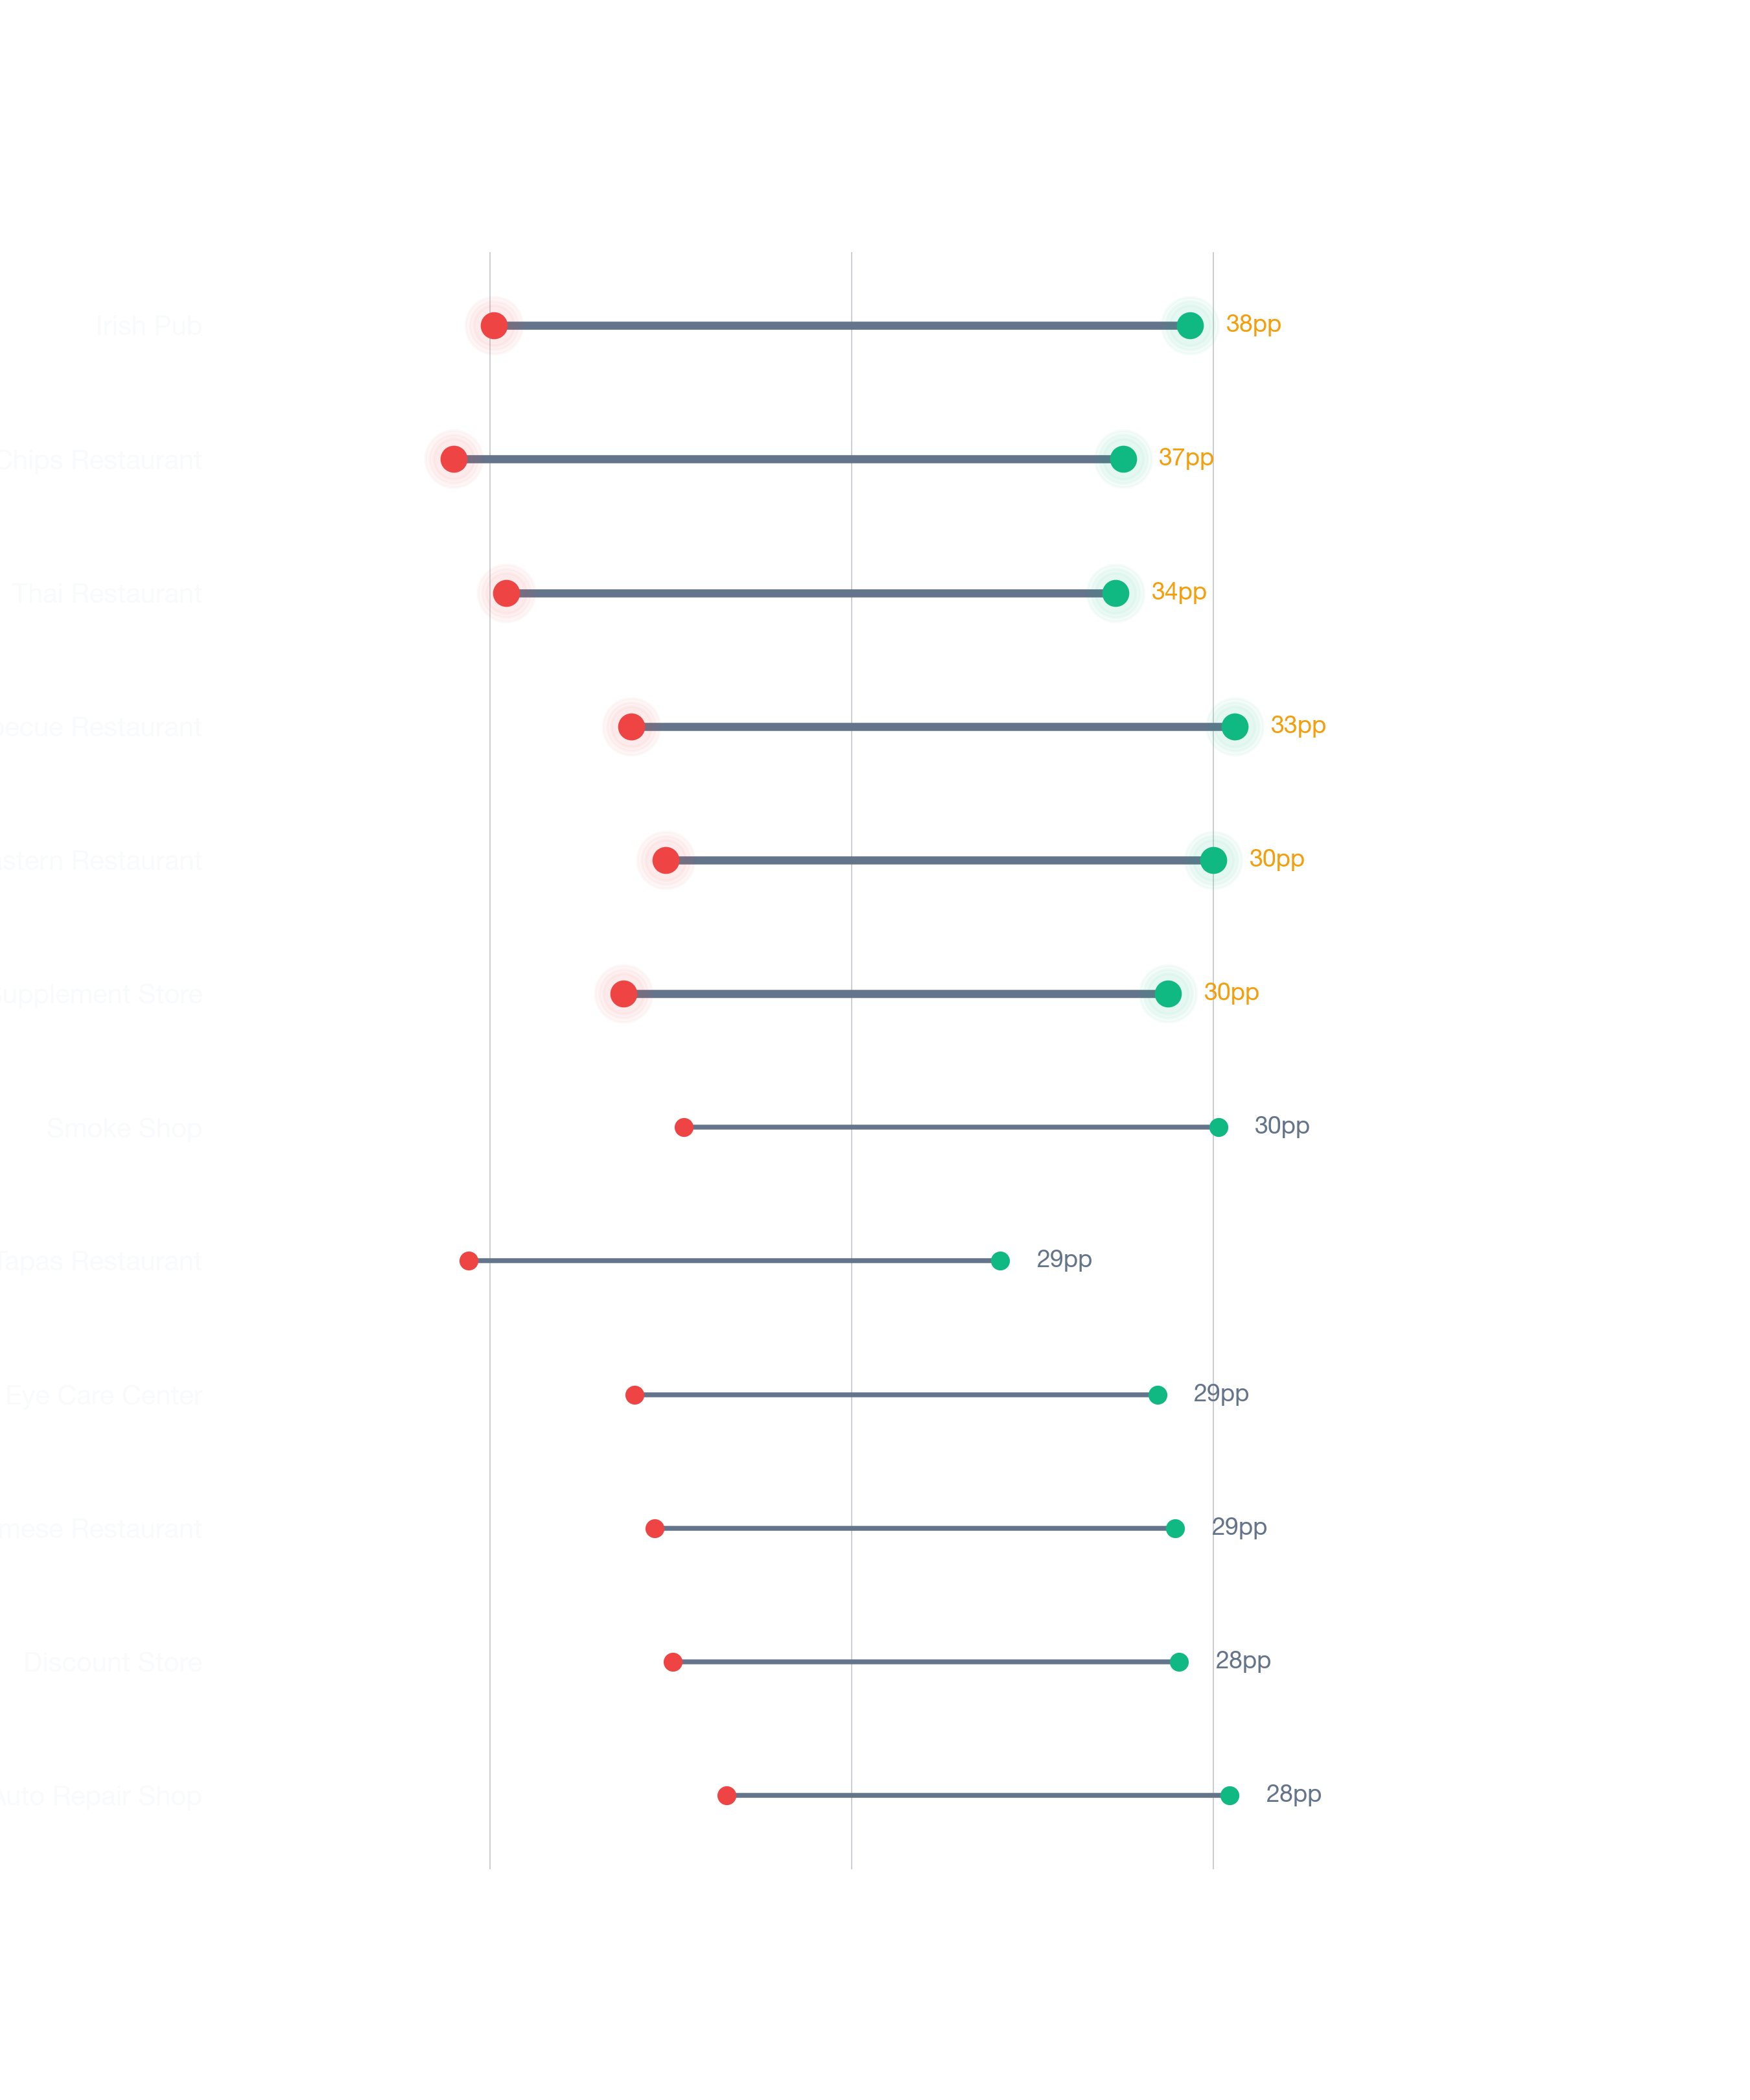
Visual Data
Related Resources
Same business type in other cities:
- Survivability Rankings for Hot Pot Restaurant in Atlanta
- City Survivability Rankings for Hot Pot Restaurant
Related:
Related:
Beyond the Numbers: Local Context
More questions answered with neighborhood-specific data from our 2026 corpus.
What are the key demographic factors for Hot Pot Restaurants in Boston?
ACS data puts Boston's metro median household income at ~$135K and median age at 41. StreetSpring's survivability model factors these alongside ~100 other location signals; the average score for Hot Pot Restaurants in Boston is 85%.
What goes into a StreetSpring survivability score for Hot Pot Restaurants?
Each Hot Pot Restaurants survivability score in Boston (averaging 85%) reflects ~100 factors per address: competitor counts at multiple radii, demographics, accessibility, rent, and historical outcomes. The model is recalibrated quarterly against 500K+ business outcomes nationally.
When does StreetSpring update Boston Hot Pot Restaurants rankings?
Quarterly. The 2026 corpus shows Hot Pot Restaurants in Boston averaging 85%; quarterly refreshes integrate new competitor entries/exits, updated ACS data, and recalibrated lease rates.