Survivability Rankings for Hair Salon in Boston
StreetSpring's 2026 analysis ranks the best and worst neighborhoods in Boston to open a Hair Salon, from Fenway (80% survival) to Wellesley (56%).
By Bobby Koons | Last reviewed by Bobby Koons on April 28, 2026 | Methodology
Quick Summary
- #1 Neighborhood: Fenway — 80% average survivability for Hair Salon
- Neighborhoods at or above 70%: 60 of 88 analyzed
- City-wide average: 71% for Hair Salons
- Most challenging area: Wellesley at 56%
- Revenue advantage (top vs. avg location): ~12.9% more expected revenue in Fenway
- Data freshness: 2026 data · Full methodology →
Table of Contents
- Summary
- 10 Best Neighborhoods
- Where Would a Hair Salon Make the Most Money?
- What Should I Consider?
- Where Should I Start?
- FAQ: Best Neighborhoods
- FAQ: Can a Hair Salon Succeed in Lower-Ranked Areas?
- FAQ: How Often Are Rankings Updated?
- FAQ: Is a Hair Salon a Good Tenant?
- Landlord Survivability Data
- Best Neighborhoods for Any Business
Summary
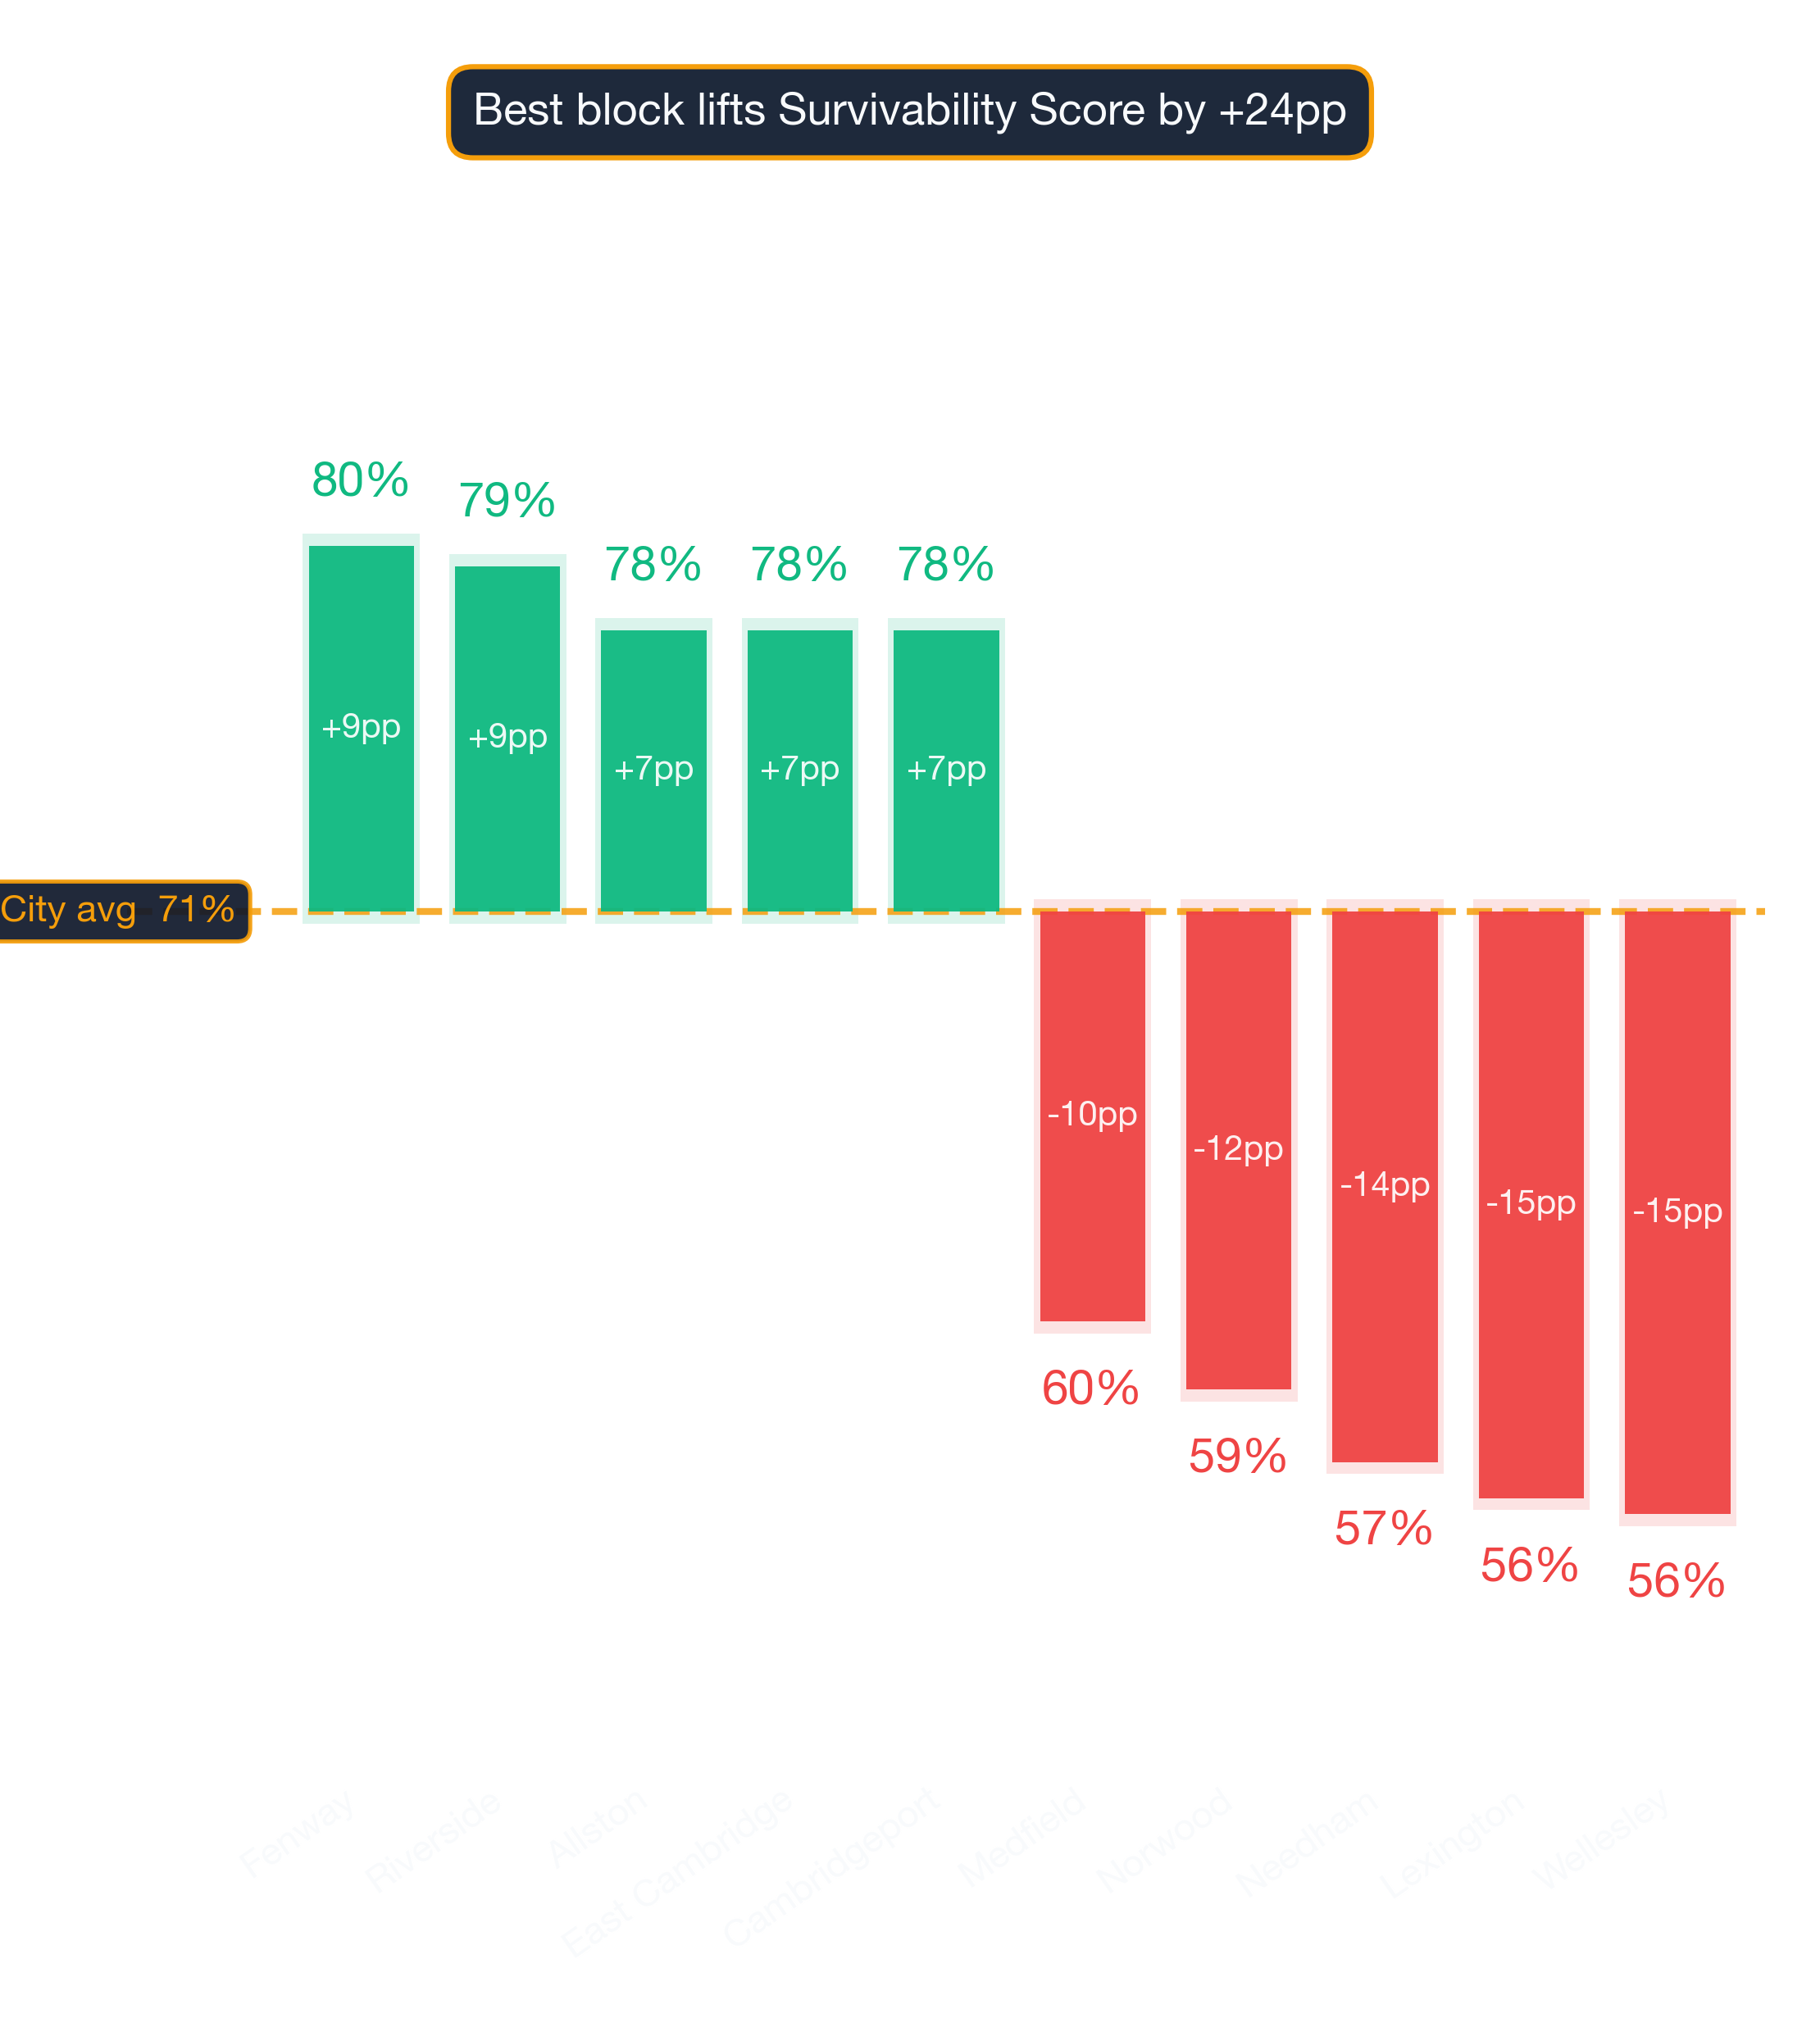
Of all the neighborhoods in and around Boston, Fenway ranks #1 for opening a Hair Salon with 80% average chance of surviving more than 2 years, with the best locations offering 85% and the most challenging locations in Fenway at 74%. The worst neighborhoods include Wellesley with 56% average chance. A low-ranking neighborhood can still contain high-potential storefronts — the address matters most.
Where in Boston Should You Open a Hair Salon?
Fenway ranks #1 of 88 neighborhoods analyzed in and around Boston for Hair Salon survivability with a score of 80% as of 2026. The top 10 neighborhoods are:
Why these rankings reflect real survival outcomes
| Rank | Neighborhood | Best Locations | Average Locations | Challenging Locations |
|---|---|---|---|---|
| 1 | Fenway | 82.0% – 86.0% | 77.0% – 81.6% | 73.0% – 77.0% |
| 2 | Riverside | 81.0% – 85.0% | 76.5% – 81.2% | 73.0% – 77.0% |
| 3 | Allston | 81.0% – 85.0% | 74.9% – 79.5% | 68.0% – 72.0% |
| 4 | Cambridgeport | 81.0% – 85.0% | 74.8% – 79.5% | 70.0% – 74.0% |
| 5 | East Cambridge | 81.0% – 85.0% | 74.8% – 79.5% | 70.0% – 74.0% |
| 6 | Cambridge | 78.0% – 82.0% | 74.7% – 79.4% | 72.0% – 76.0% |
| 7 | Haymarket | 79.0% – 83.0% | 74.5% – 79.2% | 72.0% – 76.0% |
| 8 | Government Center | 78.0% – 82.0% | 74.5% – 79.2% | 71.0% – 75.0% |
| 9 | Brighton | 83.0% – 87.0% | 74.4% – 79.0% | 64.0% – 68.0% |
| 10 | Kenmore | 80.0% – 84.0% | 74.2% – 78.8% | 69.0% – 73.0% |
Reading the gap between #1 and #10
Neighborhood averages mask significant block-by-block variation — always check your specific address. Our live tool reflects the latest competitive landscape — these static rankings may already be slightly out of date.
Survivability ranges reflect best and worst storefront conditions within each neighborhood. See our full methodology →
Try StreetSpring to see if this location is still the best and see if there are locations to rent in this area right now.
The Top Revenue Neighborhoods for Hair Salons in Boston
In Fenway, the best possible location offers the opportunity of making ~12.9% more than the average location in or around Boston.
On the other hand, in Wellesley, the worst possible location could result in making ~21.2% less than the average location in the city.
The right location can make a business; the wrong one can break it. Opening a Hair Salon in Boston requires careful location choice. Across 88 neighborhoods analyzed, the overall average survival chance for a new Hair Salon is 71% for lasting more than 2 years — due to a combination of many factors across competition, consumer spending, and location dynamics. Two businesses on the same block can have very different survivability scores depending on their category.
What Should I Consider When Opening a Hair Salon in or Around Boston?
The address you sign for is the most consequential decision in launching this business. A high Survivability Score is a non-negotiable starting point. Our models show that Revenue Capture Score explains more outcome variance than any other individual metric. StreetSpring computes this by projecting the business's market share, which is based on the quality and quantity of primary, secondary, and tertiary competitors. StreetSpring's training dataset includes millions of transactions and business lifecycle events. Our data shows that businesses in moderately competitive clusters survive longer than isolated storefronts on average. StreetSpring uses its own proprietary forecasting tools to make these predictions.
| Area to check | What can go wrong | How to de-risk it |
|---|---|---|
| Outdoor seating / sidewalk use | Signing assuming you can add patio seating, then learning the city requires a separate sidewalk-cafe permit with long lead times. | Check the city's sidewalk-cafe permit process up front. Confirm landlord allows outdoor build-out in the lease language. |
| Workforce availability | Hiring radius is smaller than you think — many neighborhoods can't staff a full team at standard wages. | Pull BLS wage data for your industry in this metro. Walk through your staffing plan with a local restaurant/retail operator before signing. |
| Parking & visibility | Storefront looks great from the sidewalk but is invisible from the road. | Drive past at 30 mph from both directions. Count street parking + nearest paid lot capacity at peak hours. |
This can be summarized as:
Revenue Capture Score = Projected Market Share × Forecasted Spend on Specific Business
Related: Survivability Score: How We Calculate It & Why It Matters
StreetSpring recalculates survivability using the latest competitive, demographic, and walkability data. Real-time data from StreetSpring accounts for recent openings, closures, and seasonal shifts that static rankings cannot.
Pinpointing the Right Neighborhood for a Hair Salon in Boston
Based on our analysis, the leading neighborhoods are Fenway, Riverside, and Allston, while the most challenging neighborhoods would be Wellesley, Lexington, and Needham. Location-level factors like visibility and adjacent tenants can override neighborhood-level trends. New competitor openings and closures happen weekly — the live tool ensures you see the latest picture.
Related Articles:
Which Boston Neighborhoods Are Strongest for Hair Salons?
Based on StreetSpring's 2026 analysis, the top neighborhood for a Hair Salon in Boston is Fenway with 80% average survivability, followed by Riverside and Allston. 60 of 88 neighborhoods analyzed exceed 70% two-year survival.
Because local conditions evolve weekly, the live survivability tool offers a more current snapshot than any published ranking.
Should You Consider Lower-Survivability Areas of Boston for a Hair Salon?
Yes — neighborhood averages mask significant block-by-block variation. Even in neighborhoods ranked outside the top 10, individual storefronts with strong foot traffic, low direct competition, and favorable lease terms can outperform the area average. Remember that a neighborhood average smooths over wide variation — your exact block could significantly outperform. Always check your specific address in StreetSpring's live platform for the most accurate prediction.
How Fresh Is Our Boston Hair Salon Ranking Data?
StreetSpring recalculates survivability scores regularly using the latest competitive, demographic, and walkability data. Rankings are updated quarterly; the live tool always reflects the most current predictions for any address in Boston.
What Makes a Hair Salon a Strong (or Weak) Boston Tenant?
In Fenway, StreetSpring forecasts a 77.0% – 81.6% average chance for a new Hair Salon to survive more than 2 years, depending on the exact storefront. Check the current Survivability Score for any address instantly.
Landlord Survivability Data for Hair Salon in Boston
From a risk-assessment perspective, a Hair Salon tenant in Fenway carries the lowest risk with average survivability of 77.0% – 81.6%. Riverside presents moderate risk (76.5% – 81.2%), and Allston carries comparatively higher risk at 74.9% – 79.5%. Our tool shows the survivability outlook for any business type at your exact address, updated weekly.
StreetSpring's predictions are granular enough to distinguish between two storefronts on the same block.
Related: How Landlord Representatives Can Reduce Vacancy & Increase Tenant Longevity
Top-Survivability Boston Neighborhoods for Hair Salons
You can see the best neighborhoods in or around Boston to open any type of business in our article Neighborhood Survivability Rankings: Boston.
Technical note: Aggregated survivability rankings for Boston are available in machine-readable format for research and integration purposes.
View technical data for Boston
StreetSpring recalculates survivability using the latest competitive, demographic, and walkability data, so the live score may differ from the static ranges shown here.
Visual Data

Related Resources
Same business type in other cities:
Related:
Related:
Local Context FAQ
More questions answered with neighborhood-specific data from our 2026 corpus.
Is Boston a strong economic environment for opening a Hair Salon?
Broader metro: ~96% employment rate, ~$135K median income per ACS. Hair Salons survivability in Boston averages 68%, with the model layering business-specific and site-specific factors on top.
What other business types score similarly to Hair Salons in Boston?
Boston subtypes scoring within 2 points of Hair Salons's 68% average include Clothing Store, Laundromat, Children's Clothing & Toys Store. Survivability convergence at the metro level usually reflects shared local factors like saturation density or demographic fit.
How does Boston compare to other US metros for Hair Salons?
Across 24 US metros, Boston sits at rank #14 for Hair Salons, averaging 68% on StreetSpring's survivability scale. National range: 66-69%.
What are the top metros nationally for opening a Hair Salon?
Per StreetSpring's 24-metro model, the top three US cities for Hair Salons survivability are Dallas, Orlando, San Antonio. Boston ranks #14, averaging 68%.