Survivability Rankings for Gym in Boston
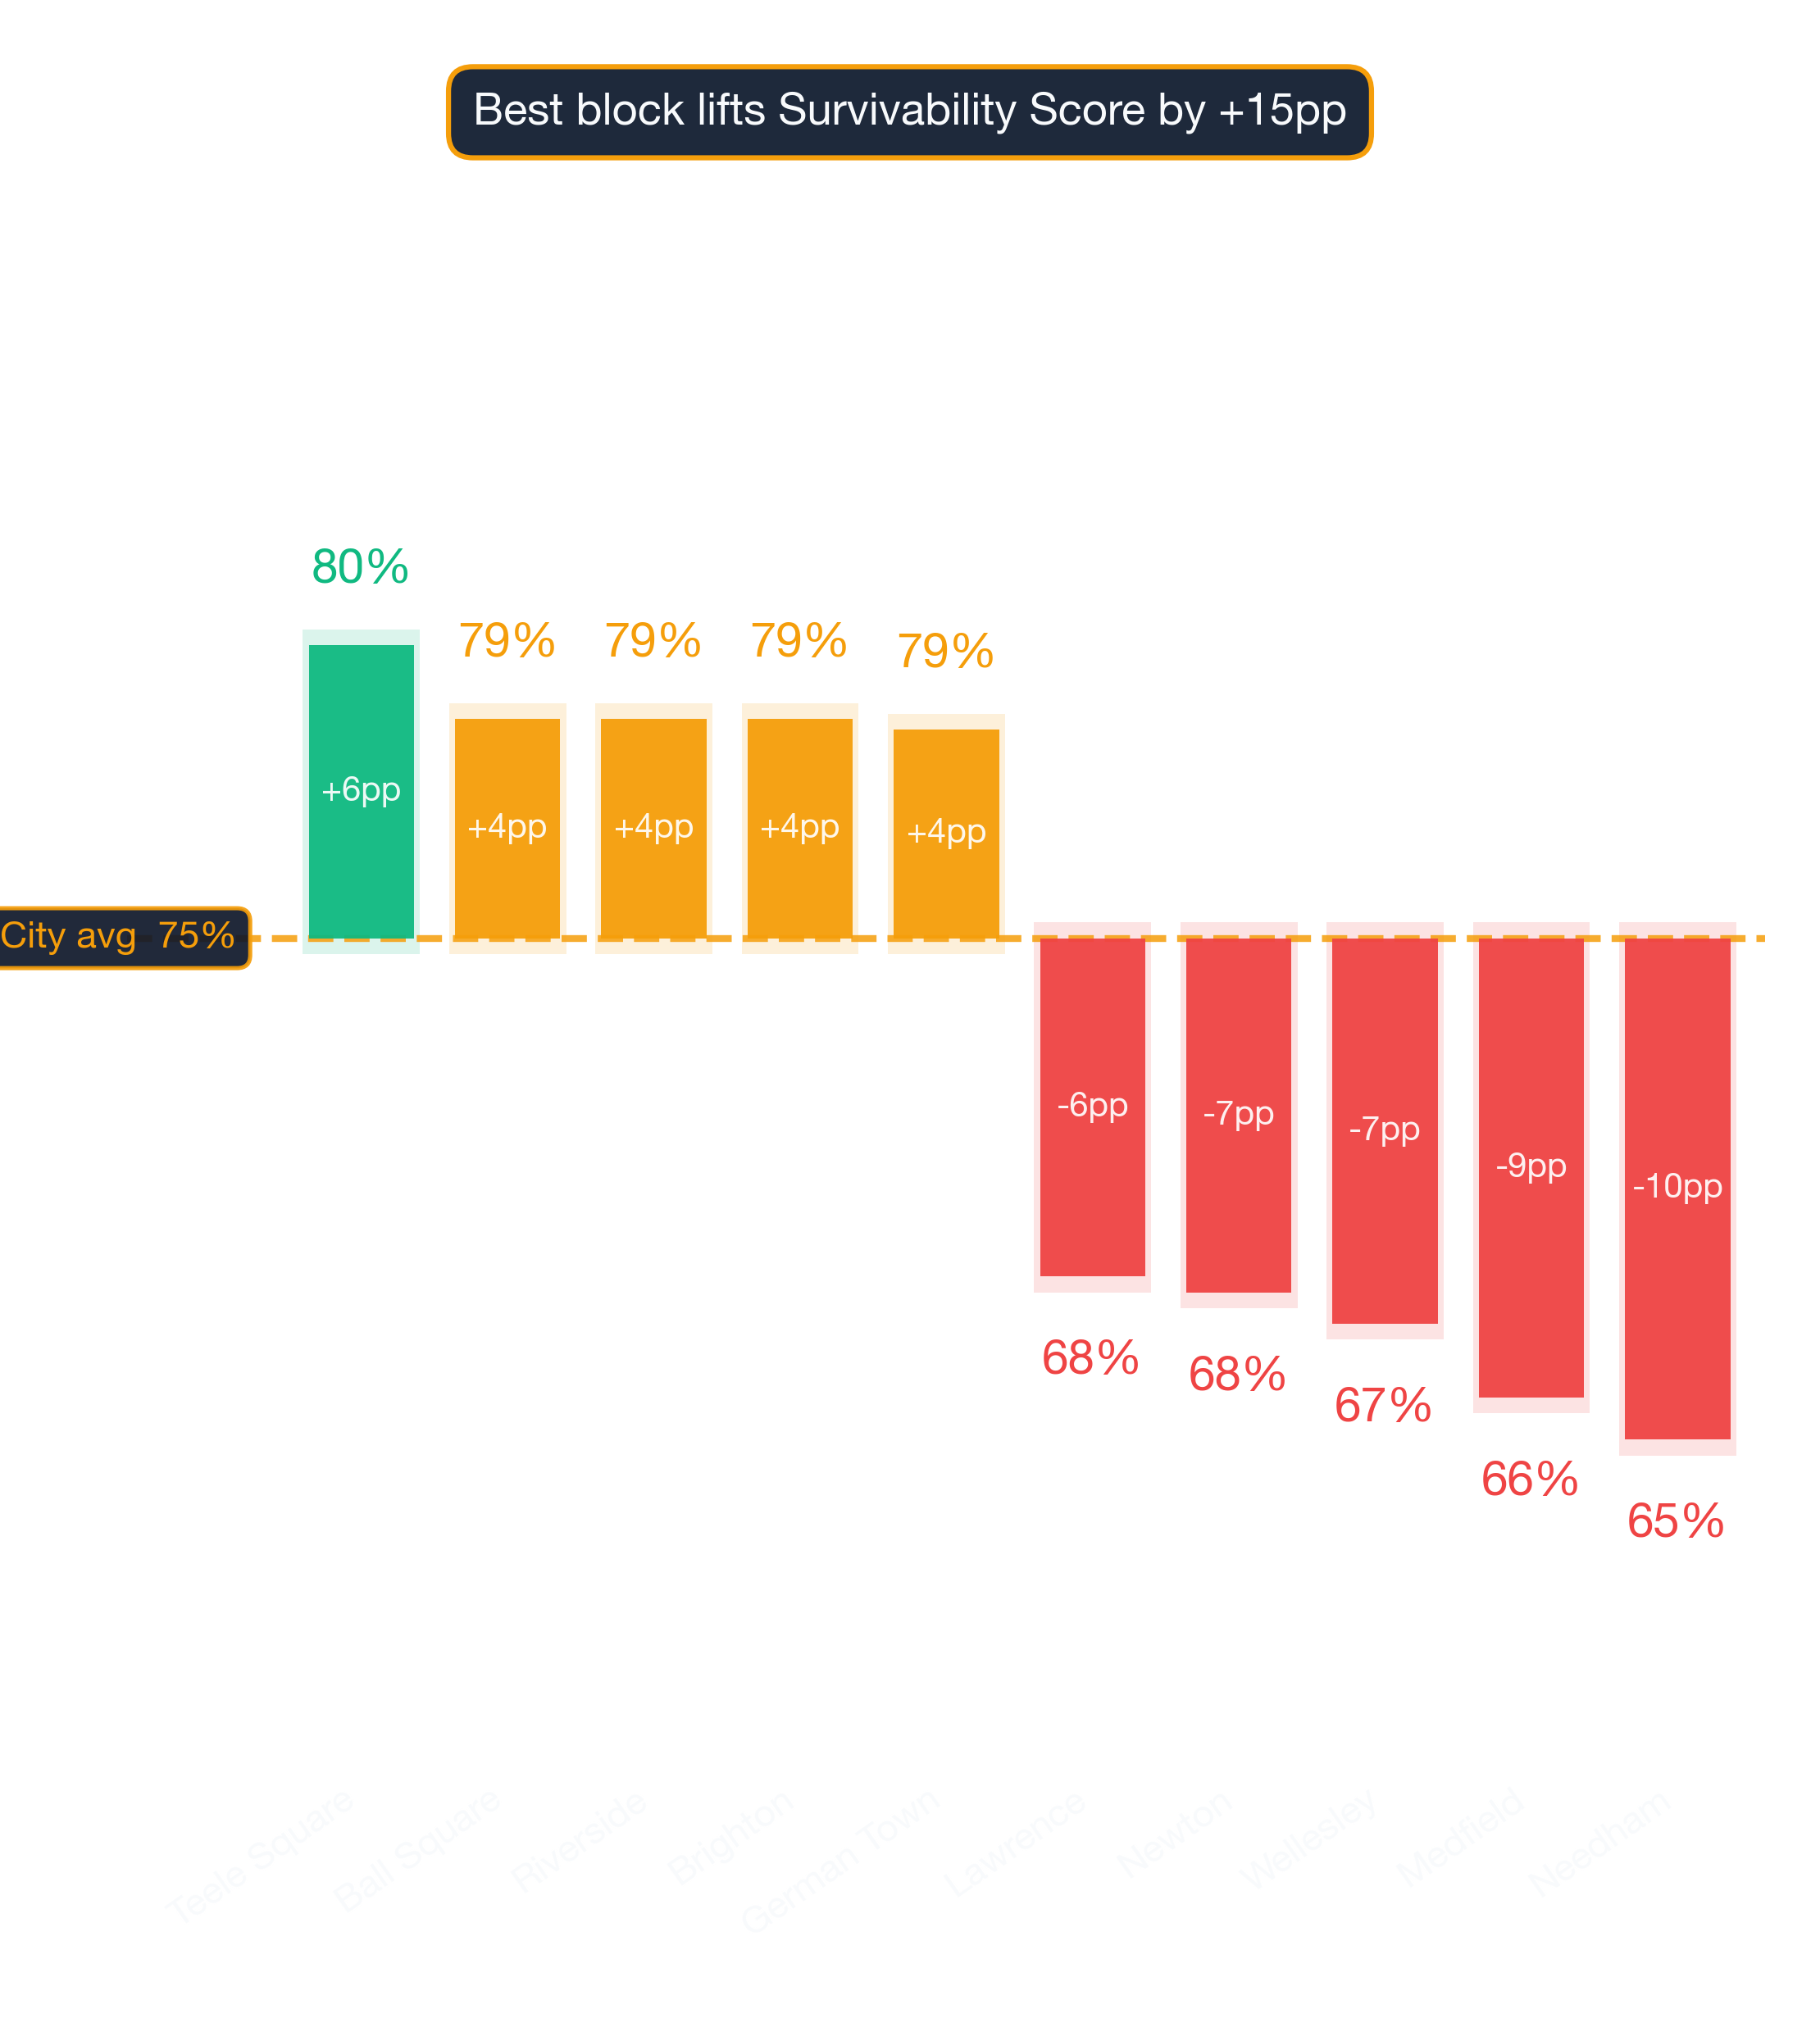
StreetSpring's 2026 analysis ranks the best and worst neighborhoods in Boston to open a Gym, from Teele Square (80% survival) to Needham (65%).
By Bobby Koons | Last reviewed: May 3, 2026 | Updated weekly | Methodology
Quick Summary
- #1 Neighborhood: Teele Square — 80% average survivability for Gym
- Neighborhoods at or above 70%: 77 of 88 analyzed
- City-wide average: 75% for Gyms
- Most challenging area: Needham at 65%
- Revenue advantage (top vs. avg location): ~7.4% more expected revenue in Teele Square
- Data freshness: 2026 data · Full methodology →
Table of Contents
- Summary
- 10 Best Neighborhoods
- Where Would a Gym Make the Most Money?
- What Should I Consider?
- Where Should I Start?
- FAQ: Best Neighborhoods
- FAQ: Can a Gym Succeed in Lower-Ranked Areas?
- FAQ: How Often Are Rankings Updated?
- FAQ: Is a Gym a Good Tenant?
- Landlord Survivability Data
- Best Neighborhoods for Any Business
Summary
Teele Square leads Boston's 2026 survivability rankings for Gym operators with 80% average chance of surviving more than 2 years, with the best locations offering 86% and the most challenging locations in Teele Square at 73%. The worst neighborhoods include Needham with 65% average chance. A low-ranking neighborhood can still contain high-potential storefronts — the address matters most.
Where Gyms Thrive in Boston
Teele Square ranks #1 of 88 neighborhoods analyzed in and around Boston for Gym survivability with a score of 80% as of 2026. The top 10 neighborhoods are:
What separates the top neighborhoods from the rest
| Rank | Neighborhood | Best Locations | Average Locations | Challenging Locations |
|---|---|---|---|---|
| 1 | Teele Square | 83.0% – 87.0% | 78.0% – 82.1% | 72.0% – 76.0% |
| 2 | Ball Square | 82.0% – 86.0% | 76.7% – 80.8% | 71.0% – 75.0% |
| 3 | Brighton | 83.0% – 87.0% | 76.7% – 80.8% | 66.0% – 70.0% |
| 4 | Riverside | 80.0% – 84.0% | 76.6% – 80.7% | 72.0% – 76.0% |
| 5 | German Town | 85.0% – 89.0% | 76.4% – 80.5% | 68.0% – 72.0% |
| 6 | Cambridgeport | 80.0% – 84.0% | 76.4% – 80.5% | 72.0% – 76.0% |
| 7 | East Cambridge | 82.0% – 86.0% | 76.3% – 80.4% | 72.0% – 76.0% |
| 8 | Cambridge | 80.0% – 84.0% | 76.0% – 80.1% | 70.0% – 74.0% |
| 9 | Malden | 83.0% – 87.0% | 75.8% – 79.9% | 69.0% – 73.0% |
| 10 | Ten Hills | 83.0% – 87.0% | 75.8% – 79.9% | 71.0% – 75.0% |
Where the rankings might surprise you
These rankings are based on the latest available data; check StreetSpring for real-time updates. Because local conditions evolve weekly, the live survivability tool offers a more current snapshot than any published ranking.
Survivability ranges reflect best and worst storefront conditions within each neighborhood. See our full methodology →
Try StreetSpring to see if this location is still the best and see if there are locations to rent in this area right now.
Where Gyms Earn the Most in Boston
In Teele Square, the best possible location offers the opportunity of making ~7.4% more than the average location in or around Boston.
On the other hand, in Needham, the worst possible location could result in making ~12.8% less than the average location in the city.
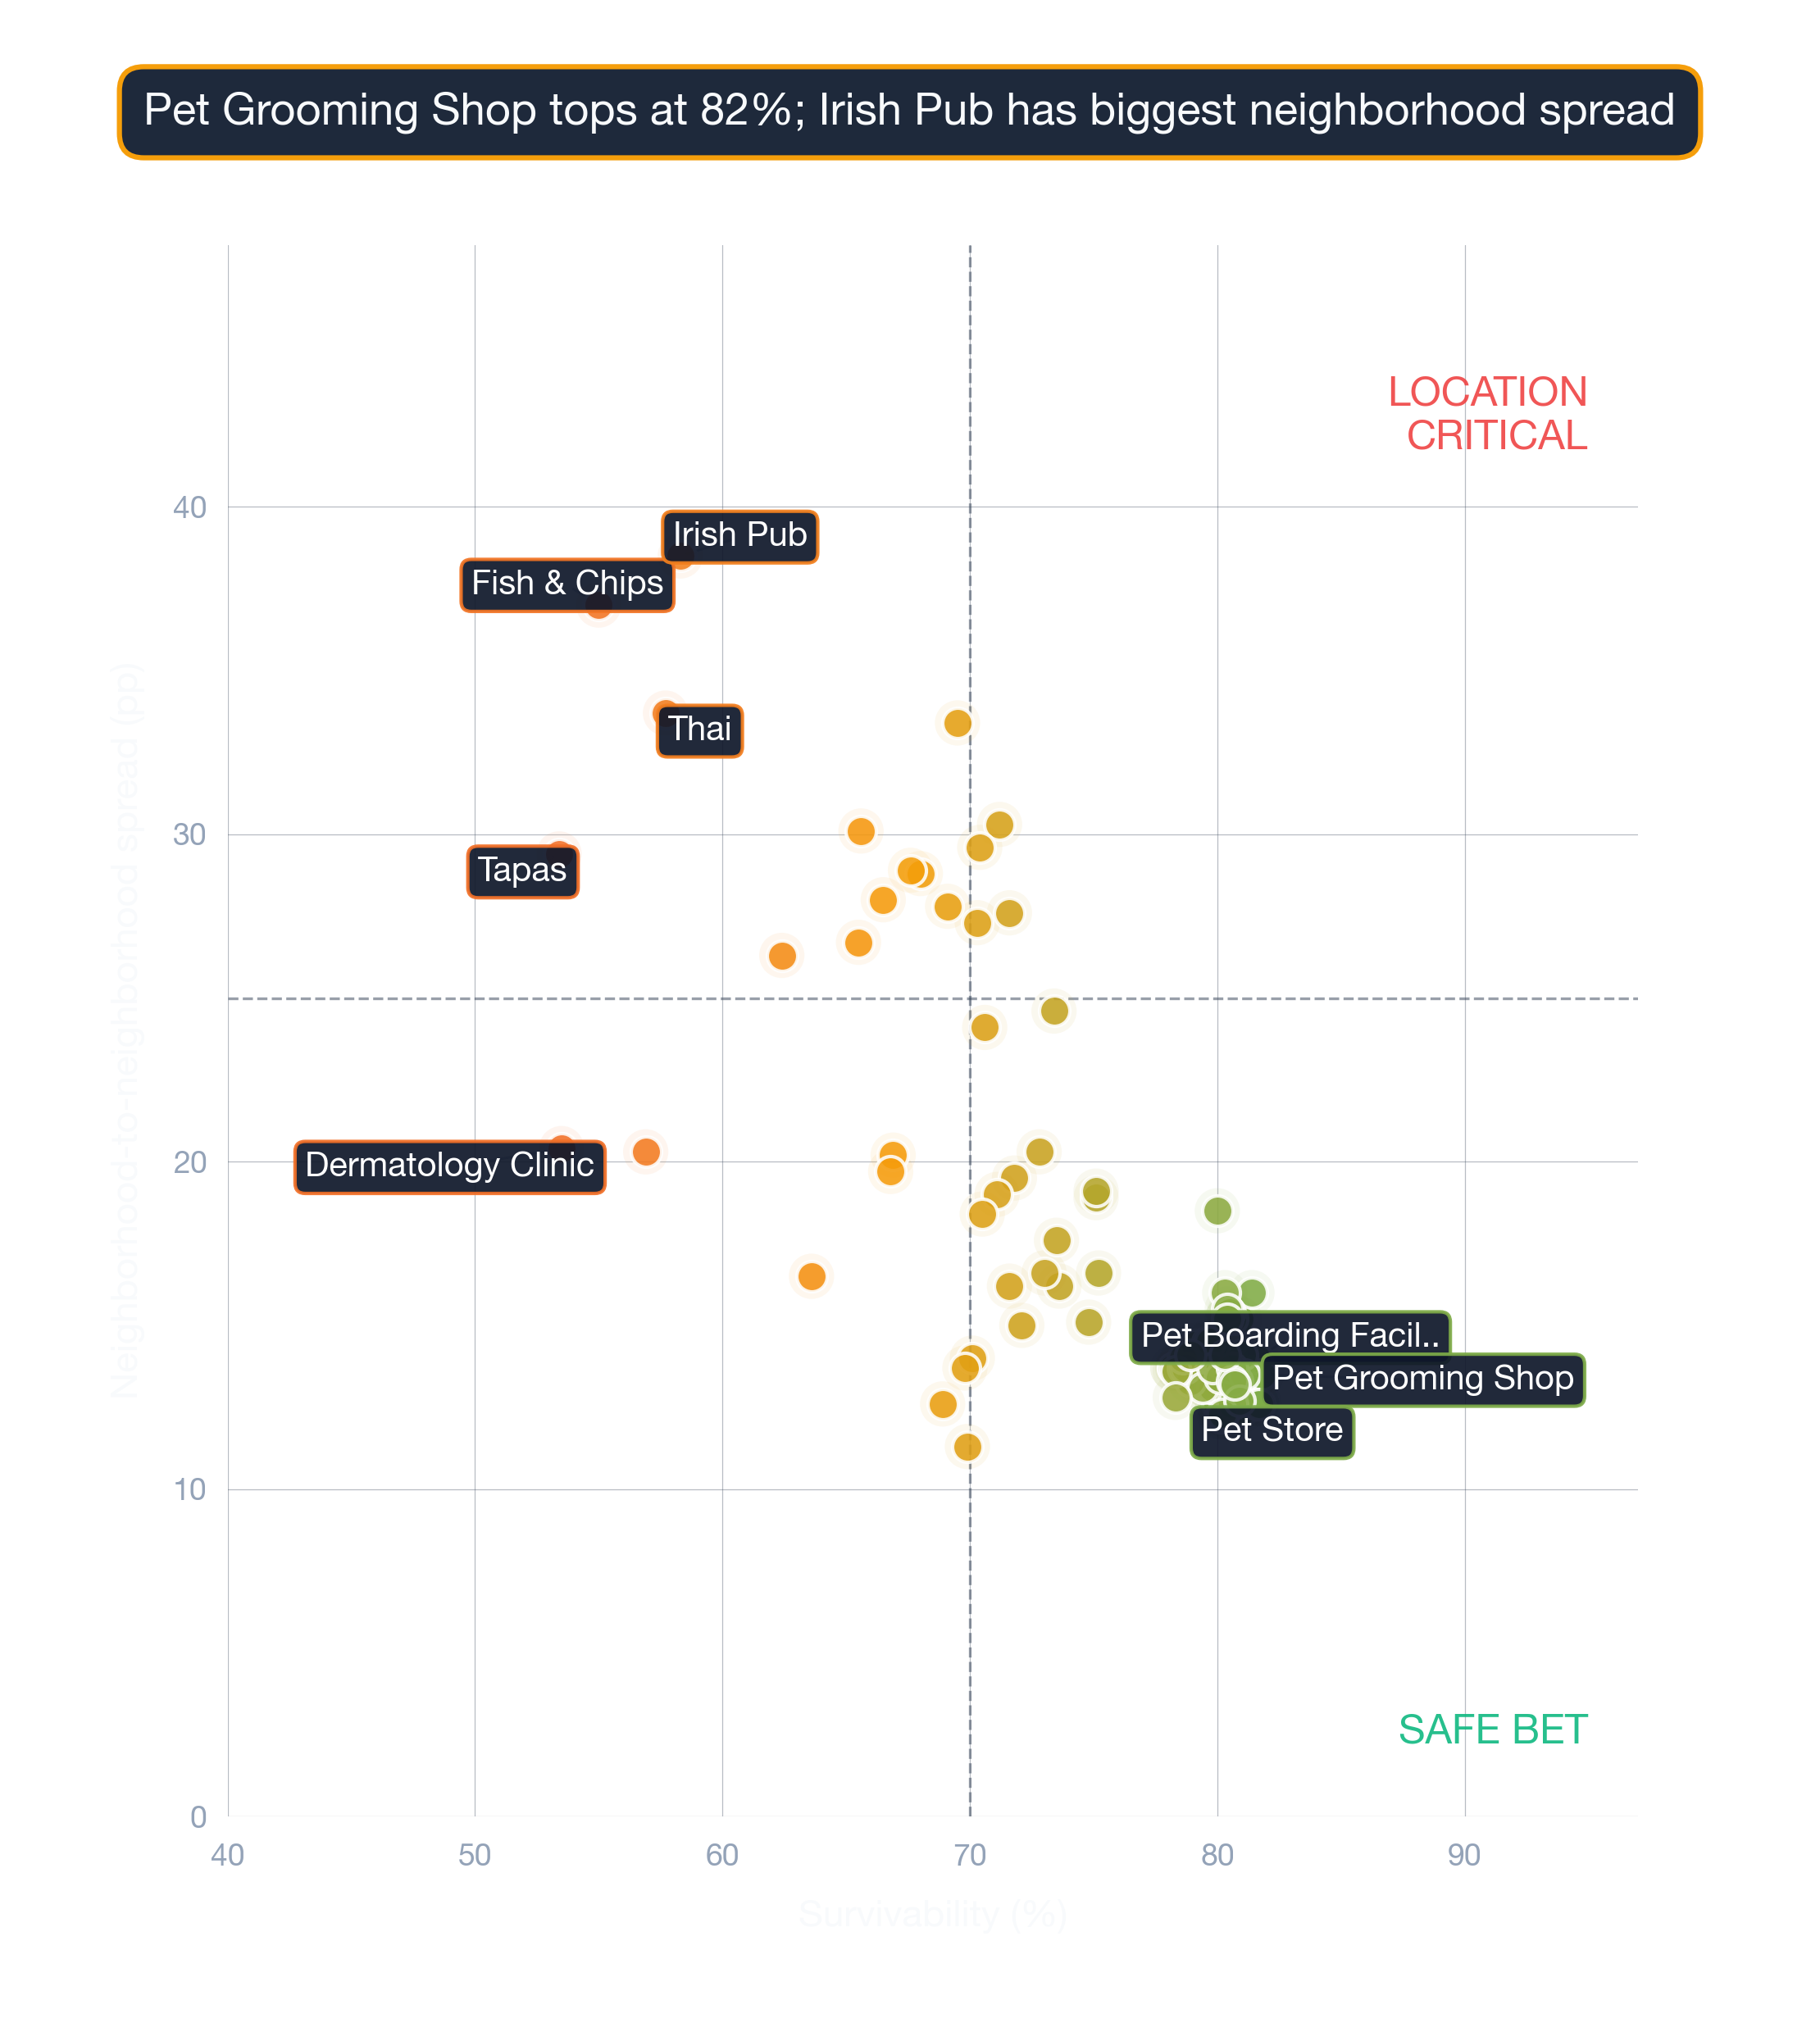
A great concept in the wrong location will almost always underperform a good concept in the right one. Opening a Gym in Boston requires careful location choice. Across 88 neighborhoods analyzed, the overall average survival chance for a new Gym is 75% for lasting more than 2 years — due to a combination of many factors across competition, consumer spending, and location dynamics. A high-traffic corner that works well for a coffee shop may be entirely wrong for a specialty retailer.
What Matters Most When Opening a Gym in Boston
The address you sign for is the most consequential decision in launching this business. A high Survivability Score is a non-negotiable starting point. When evaluating a potential location, Revenue Capture Score should be the first number you look at. StreetSpring computes this by projecting the business's market share, which is based on the quality and quantity of primary, secondary, and tertiary competitors. We have been studying the businesses serving more than 180 million+ Americans. Competition density is not inherently negative — it often signals an established customer base. Our proprietary models incorporate data sources not available through any public platform.
| Consideration | Common pitfall | What to verify before signing |
|---|---|---|
| CAM + hidden costs | Stated rent looks great, then CAM fees, signage charges, and after-hours utilities add 15-30%. | Get the full operating expense breakdown for the past 2 years. Ask which costs are landlord-capped vs. uncapped. |
| Competitor density | Counting only direct competitors and missing adjacent-category overlap (e.g. coffee shop near a bakery). | Map all businesses serving overlapping customer needs within a 5-min walk. Use StreetSpring's competitor view as a starting point. |
| Foot traffic seasonality | Looking at a peak-summer Tuesday and assuming year-round volume. | Walk the block at 3 different times across 2 different weeks. Ask neighboring tenants for their slow-season % drop. |
This can be summarized as:
Revenue Capture Score = Projected Market Share × Forecasted Spend on Specific Business
Related: Survivability Score: How We Calculate It & Why It Matters
Survivability scores are updated as new competitive, demographic, and walkability data lands. Static rankings can drift between updates; the live StreetSpring tool always reflects the most current address-level score.
Where to Launch a Gym in or Around Boston
For this business type, the highest-ranked neighborhoods are Teele Square, Ball Square, and Brighton, while the most challenging neighborhoods would be Needham, Medfield, and Wellesley. Even neighborhoods with modest average scores can harbor exceptional individual locations. Neighborhood rankings are useful, but the exact odds for your location can only be seen by running a current survivability check in StreetSpring.
Related Articles:
What Are the Best Neighborhoods in Boston to Open a Gym?
Based on StreetSpring's 2026 analysis, the top neighborhood for a Gym in Boston is Teele Square with 80% average survivability, followed by Ball Square and Brighton. 77 of 88 neighborhoods analyzed exceed 70% two-year survival.
Neighborhood rankings are useful, but the exact odds for your location can only be seen by running a current survivability check in StreetSpring.
Do Lower-Ranked Boston Neighborhoods Still Work for Gyms?
Yes — neighborhood averages mask significant block-by-block variation. Even in neighborhoods ranked outside the top 10, individual storefronts with strong foot traffic, low direct competition, and favorable lease terms can outperform the area average. Remember that a neighborhood average smooths over wide variation — your exact block could significantly outperform. Always check your specific address in StreetSpring's live platform for the most accurate prediction.
The Update Schedule for Boston Gyms Data
StreetSpring recalculates survivability scores regularly using the latest competitive, demographic, and walkability data. Rankings are updated quarterly; the live tool always reflects the most current predictions for any address in Boston.
What Makes a Gym a Strong (or Weak) Boston Tenant?
In Teele Square, StreetSpring forecasts a 78.0% – 82.1% average chance for a new Gym to survive more than 2 years, depending on the exact storefront. Check the current Survivability Score for any address instantly.
Landlord Survivability Data for Gym in Boston
For landlords evaluating tenant applications, StreetSpring's data provides a clear comparison across the top neighborhoods. In Teele Square, a Gym has a 78.0% – 82.1% average chance of surviving more than 2 years. In Ball Square, the range shifts to 76.7% – 80.8%, and in Brighton, it is 76.7% – 80.8%. Check the current Survivability Score for any address instantly.
StreetSpring generates location-specific predictions tailored to your exact site.
Related: How Landlord Representatives Can Reduce Vacancy & Increase Tenant Longevity
Where in Boston Should You Open a Gym?
You can see the best neighborhoods in or around Boston to open any type of business in our article Neighborhood Survivability Rankings: Boston.
Technical note: Aggregated survivability rankings for Boston are available in machine-readable format for research and integration purposes.
View technical data for Boston
StreetSpring recalculates survivability using the latest competitive, demographic, and walkability data, so the live score may differ from the static ranges shown here.
Visual Data

Related Resources
Same business type in other cities:
Related:
Related:
Neighborhood-Specific Questions
Beyond the general FAQ — data-anchored answers for this specific location.
Do Gyms need walkable locations in Boston?
ACS data shows Boston's median commute at ~32 minutes — accessibility patterns vary widely by neighborhood. Gyms survivability in Boston ranges 42-90% across locations, with accessibility one of the bigger contributing factors.
What's the broader economic environment in Boston?
Broader metro: ~96% employment rate, ~$135K median income per ACS. Gyms survivability in Boston averages 72%, with the model layering business-specific and site-specific factors on top.
How does Boston compare to other US metros for Gyms?
For Gyms, Boston ranks #5 out of 24 metros with an average survivability score of 72%. The strongest metro tops out at 73%; the weakest at 70%.