Survivability Rankings for Georgian Restaurant in Boston
StreetSpring's 2026 analysis ranks the best and worst neighborhoods in Boston to open a Georgian Restaurant, from Haverhill (87% survival) to Winchester...
By Bobby Koons | Last reviewed: May 8, 2026 | Updated weekly | Methodology
Quick Summary
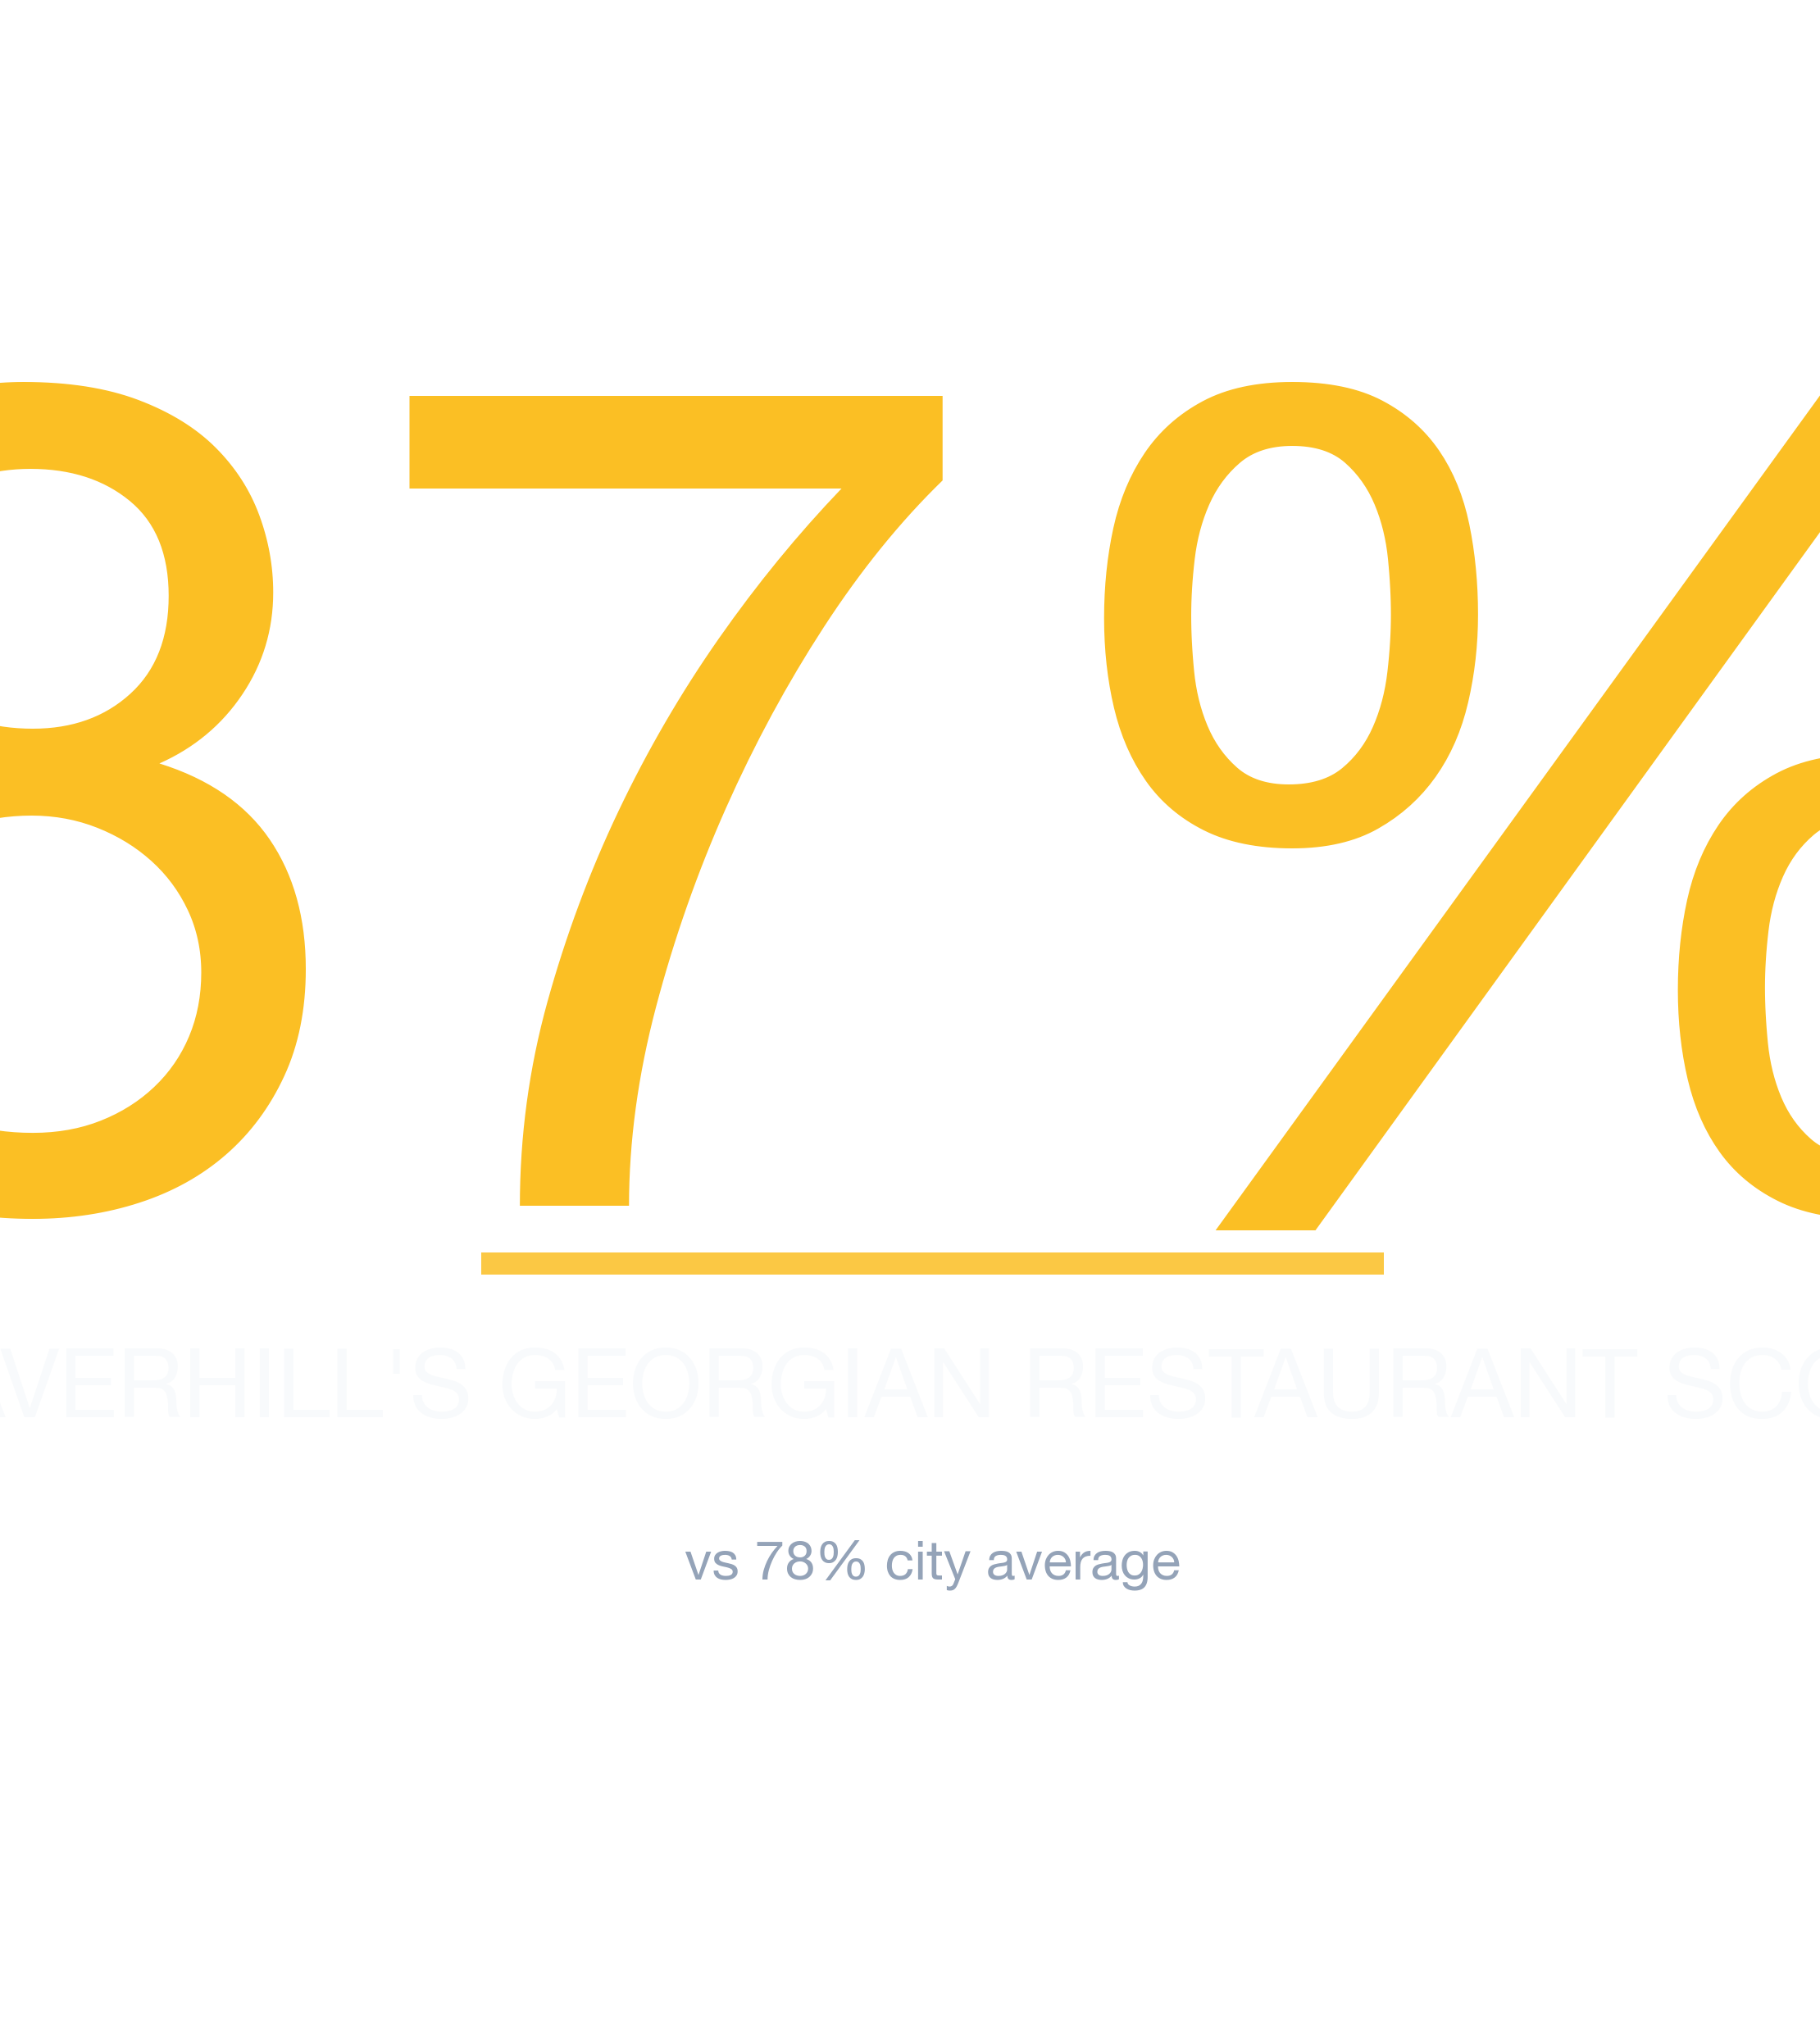
- #1 Neighborhood: Haverhill — 87% average survivability for Georgian Restaurant
- Neighborhoods at or above 70%: 88 of 88 analyzed
- City-wide average: 78% for Georgian Restaurants
- Most challenging area: Winchester at 73%
- Revenue advantage (top vs. avg location): ~10.9% more expected revenue in Haverhill
- Data freshness: 2026 data · Full methodology →
Table of Contents
- Summary
- 10 Best Neighborhoods
- Where Would a Georgian Restaurant Make the Most Money?
- What Should I Consider?
- Where Should I Start?
- FAQ: Best Neighborhoods
- FAQ: Can a Georgian Restaurant Succeed in Lower-Ranked Areas?
- FAQ: How Often Are Rankings Updated?
- FAQ: Is a Georgian Restaurant a Good Tenant?
- Landlord Survivability Data
- Best Neighborhoods for Any Business
Summary
Opening a Georgian Restaurant in Boston? Our 2026 analysis identifies Haverhill as the top location with 87% average chance of surviving more than 2 years, with the best locations offering 96% and the most challenging locations in Haverhill at 63%. The worst neighborhoods include Winchester with 73% average chance. These averages are directional, not definitive; the best decision comes from analyzing your specific storefront.
Which Boston Neighborhoods Are Strongest for Georgian Restaurants?
Haverhill ranks #1 of 88 neighborhoods analyzed in and around Boston for Georgian Restaurant survivability with a score of 87% as of 2026. The top 10 neighborhoods are:
What the score spread tells you about risk
| Rank | Neighborhood | Best Locations | Average Locations | Challenging Locations |
|---|---|---|---|---|
| 1 | Haverhill | 93.0% – 97.0% | 85.4% – 88.8% | 62.0% – 66.0% |
| 2 | Boston | 90.0% – 94.0% | 85.2% – 88.6% | 67.0% – 71.0% |
| 3 | Medfield | 94.0% – 97.0% | 84.4% – 87.7% | 60.0% – 64.0% |
| 4 | Dover | 93.0% – 97.0% | 84.0% – 87.4% | 66.0% – 70.0% |
| 5 | Methuen | 93.0% – 97.0% | 83.7% – 87.1% | 65.0% – 69.0% |
| 6 | Needham | 94.0% – 97.0% | 82.7% – 86.1% | 62.0% – 66.0% |
| 7 | Lowell | 94.0% – 97.0% | 82.4% – 85.8% | 64.0% – 68.0% |
| 8 | Merrymount | 90.0% – 94.0% | 82.2% – 85.6% | 67.0% – 71.0% |
| 9 | Brockton | 92.0% – 96.0% | 80.7% – 84.1% | 63.0% – 67.0% |
| 10 | Adams Shore | 90.0% – 94.0% | 80.7% – 84.1% | 65.0% – 69.0% |
What separates the top neighborhoods from the rest
For the most current predictions, visit StreetSpring to analyze your specific location in real-time. However, market conditions change daily, and it's best to use StreetSpring's live data to check the Survivability Score for a specific address.
Survivability ranges reflect best and worst storefront conditions within each neighborhood. See our full methodology →
Try StreetSpring to see if this location is still the best and see if there are locations to rent in this area right now.
Where Georgian Restaurants Earn the Most in Boston
In Haverhill, the best possible location offers the opportunity of making ~10.9% more than the average location in or around Boston.
On the other hand, in Winchester, the worst possible location could result in making ~6.6% less than the average location in the city.
Your choice of location outweighs almost every other business decision combined. Opening a Georgian Restaurant in Boston requires careful location choice. Across 88 neighborhoods analyzed, the overall average survival chance for a new Georgian Restaurant is 78% for lasting more than 2 years — due to a combination of many factors across competition, consumer spending, and location dynamics. The interplay between location characteristics and business type produces unique survivability scores for every combination.
The Most Important Factors for a Georgian Restaurant in Boston
Among all the variables you control, location quality has the biggest downstream impact. A strong Survivability Score is the foundation everything else builds on. Among all factors in our model, Revenue Capture Score carries the most weight in determining long-term survivability. StreetSpring computes this by projecting the business's market share, which is based on the quality and quantity of primary, secondary, and tertiary competitors. StreetSpring has analyzed hundreds of thousands of business outcomes across major US metros. Clustering works when it draws more customers to the area than any single business could alone. Our proprietary models incorporate data sources not available through any public platform.
| Consideration | Common pitfall | What to verify before signing |
|---|---|---|
| Competitor density | Counting only direct competitors and missing adjacent-category overlap (e.g. coffee shop near a bakery). | Map all businesses serving overlapping customer needs within a 5-min walk. Use StreetSpring's competitor view as a starting point. |
| CAM + hidden costs | Stated rent looks great, then CAM fees, signage charges, and after-hours utilities add 15-30%. | Get the full operating expense breakdown for the past 2 years. Ask which costs are landlord-capped vs. uncapped. |
| Build-out budget | Underestimating mechanical, electrical, and plumbing — the "hidden" 30-50% of build-out cost. | Get 3 quotes from licensed contractors and pad budget by +20% for surprises. Confirm landlord TI allowance in writing. |
This can be summarized as:
Revenue Capture Score = Projected Market Share × Forecasted Spend on Specific Business
Related: Survivability Score: How We Calculate It & Why It Matters
StreetSpring recalculates survivability using the latest competitive, demographic, and walkability data. Because local conditions evolve weekly, the live survivability tool offers a more current snapshot than any published ranking.
Which Boston Block Is Right for a Georgian Restaurant?
Our data ranks the top-performing neighborhoods as Haverhill, Boston, and Medfield, while the most challenging neighborhoods would be Winchester, Roslindale, and West Roxbury. Neighborhood averages mask significant block-by-block variation — always check your specific address. Static rankings provide a useful baseline, but the live tool captures changes that have occurred since publication.
Related Articles:
Top-Survivability Boston Neighborhoods for Georgian Restaurants
Based on StreetSpring's 2026 analysis, the top neighborhood for a Georgian Restaurant in Boston is Haverhill with 87% average survivability, followed by Boston and Medfield. 88 of 88 neighborhoods analyzed exceed 70% two-year survival.
Static rankings provide a useful baseline, but the live tool captures changes that have occurred since publication.
Are Bottom-Tier Boston Neighborhoods a No-Go for Georgian Restaurants?
Yes — neighborhood averages mask significant block-by-block variation. Even in neighborhoods ranked outside the top 10, individual storefronts with strong foot traffic, low direct competition, and favorable lease terms can outperform the area average. Location-level factors like visibility and adjacent tenants can override neighborhood-level trends. Always check your specific address in StreetSpring's live platform for the most accurate prediction.
Refresh Cadence for Boston Georgian Restaurant Survivability Rankings
StreetSpring recalculates survivability scores regularly using the latest competitive, demographic, and walkability data. Rankings are updated quarterly; the live tool always reflects the most current predictions for any address in Boston.
Should You Rent Your Boston Storefront to a Georgian Restaurant?
In Haverhill, StreetSpring forecasts a 85.4% – 88.8% average chance for a new Georgian Restaurant to survive more than 2 years, depending on the exact storefront. Check the current Survivability Score for any address instantly.
Landlord Survivability Data for Georgian Restaurant in Boston
Should you rent your storefront to a Georgian Restaurant? The answer depends heavily on your neighborhood. Haverhill offers the strongest outlook at 85.4% – 88.8% average survivability, followed by Boston at 85.2% – 88.6%, and Medfield at 84.4% – 87.7%. Check the current Survivability Score for any address instantly.
StreetSpring's predictions are granular enough to distinguish between two storefronts on the same block.
Related: How Landlord Representatives Can Reduce Vacancy & Increase Tenant Longevity
Where Georgian Restaurants Thrive in Boston
You can see the best neighborhoods in or around Boston to open any type of business in our article Neighborhood Survivability Rankings: Boston.
Technical note: Aggregated survivability rankings for Boston are available in machine-readable format for research and integration purposes.
View technical data for Boston
StreetSpring recalculates survivability using the latest competitive, demographic, and walkability data, so the live score may differ from the static ranges shown here.
Visual Data
Related Resources
Same business type in other cities:
- City Survivability Rankings for Georgian Restaurant
- Survivability Rankings for Georgian Restaurant in Atlanta
Related:
Related:
Beyond the Numbers: Local Context
Further questions, with answers anchored on this neighborhood's actual data.
What 5-year survival rate does the federal government track for Georgian Restaurants?
Per BLS Business Employment Dynamics (March 2025 release), Georgian Restaurants have a 50% 5-year survival rate nationally. StreetSpring's Boston model averages 85% across tracked locations — above the national baseline by 35 percentage points.
What's the gap between the best and worst Boston locations for a Georgian Restaurant?
In Boston, Georgian Restaurants score between 60% and 99% on StreetSpring's survivability scale — a 39-point gap between worst and best locations for the same business type.
How healthy is the Boston economy for new Georgian Restaurants?
ACS data puts Boston's employment rate at ~96% and median household income at ~$135K. StreetSpring's Georgian Restaurants model averages 85% across the metro, weighting both macro and site-specific factors.
Does accessibility drive Georgian Restaurants survivability in Boston?
Boston's metro median commute is 32 minutes. Accessibility is one of ~100 factors in the survivability model — Georgian Restaurants in Boston score 85% on average, with the spread (60-99%) driven heavily by per-location accessibility differences.