Survivability Rankings for Ethiopian Restaurant in Boston
StreetSpring's 2026 analysis ranks the best and worst neighborhoods in Boston to open an Ethiopian Restaurant, from Boston (87% survival) to Winchester ...
By Bobby Koons | Last updated: April 29, 2026 | Weekly methodology review | Methodology
Quick Summary
- #1 Neighborhood: Boston — 87% average survivability for Ethiopian Restaurant
- Neighborhoods at or above 70%: 88 of 88 analyzed
- City-wide average: 80% for Ethiopian Restaurants
- Most challenging area: Winchester at 75%
- Revenue advantage (top vs. avg location): ~8.5% more expected revenue in Boston
- Data freshness: 2026 data · Full methodology →
Table of Contents
- Summary
- 10 Best Neighborhoods
- Where Would an Ethiopian Restaurant Make the Most Money?
- What Should I Consider?
- Where Should I Start?
- FAQ: Best Neighborhoods
- FAQ: Can an Ethiopian Restaurant Succeed in Lower-Ranked Areas?
- FAQ: How Often Are Rankings Updated?
- FAQ: Is an Ethiopian Restaurant a Good Tenant?
- Landlord Survivability Data
- Best Neighborhoods for Any Business
Summary
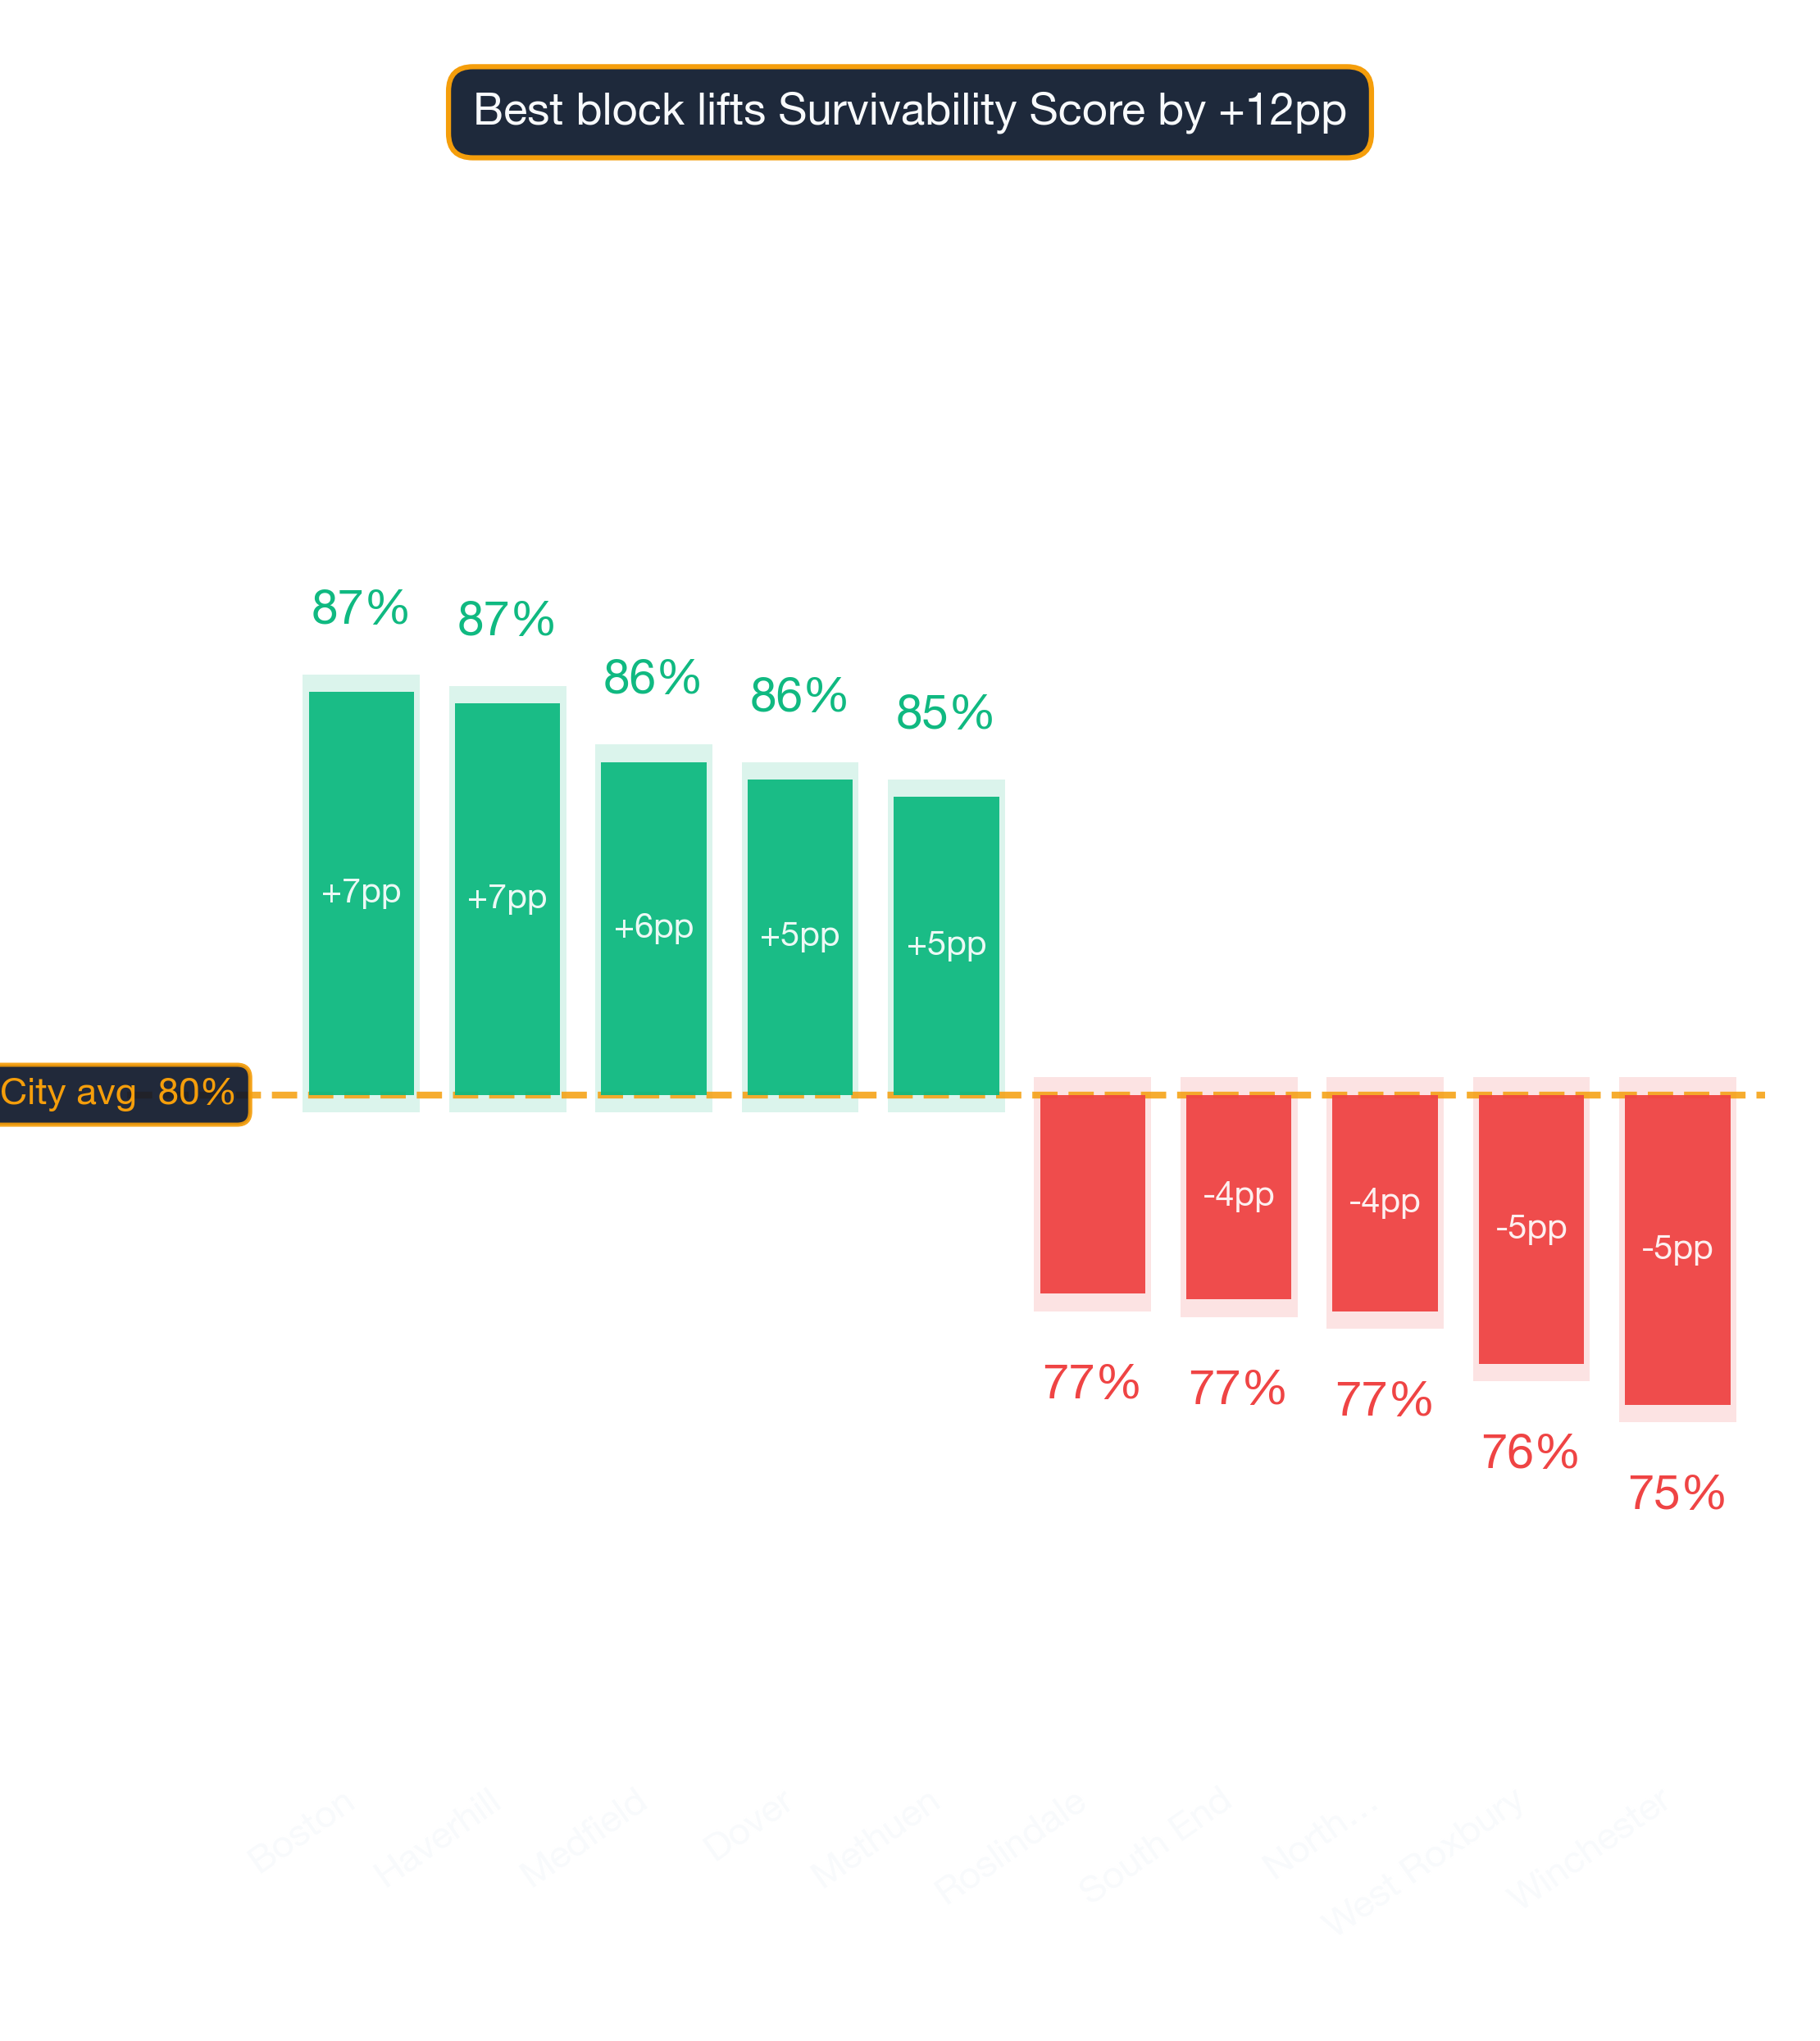
Boston leads Boston's 2026 survivability rankings for Ethiopian Restaurant operators with 87% average chance of surviving more than 2 years, with the best locations offering 93% and the most challenging locations in Boston at 73%. The worst neighborhoods include Winchester with 75% average chance. Neighborhood averages mask significant block-by-block variation — always check your specific address.
Which Boston Neighborhoods Are Strongest for Ethiopian Restaurants?
Boston ranks #1 of 88 neighborhoods analyzed in and around Boston for Ethiopian Restaurant survivability with a score of 87% as of 2026. The top 10 neighborhoods are:
Where the rankings might surprise you
| Rank | Neighborhood | Best Locations | Average Locations | Challenging Locations |
|---|---|---|---|---|
| 1 | Boston | 90.0% – 94.0% | 85.7% – 88.8% | 72.0% – 76.0% |
| 2 | Haverhill | 94.0% – 97.0% | 85.6% – 88.6% | 63.0% – 67.0% |
| 3 | Medfield | 95.0% – 97.0% | 84.6% – 87.6% | 61.0% – 65.0% |
| 4 | Dover | 94.0% – 97.0% | 84.2% – 87.3% | 64.0% – 68.0% |
| 5 | Methuen | 94.0% – 97.0% | 84.0% – 87.0% | 66.0% – 70.0% |
| 6 | Needham | 95.0% – 97.0% | 83.1% – 86.2% | 64.0% – 68.0% |
| 7 | Lowell | 94.0% – 97.0% | 82.9% – 85.9% | 65.0% – 69.0% |
| 8 | Merrymount | 90.0% – 94.0% | 82.8% – 85.8% | 70.0% – 74.0% |
| 9 | Adams Shore | 92.0% – 96.0% | 81.9% – 84.9% | 68.0% – 72.0% |
| 10 | Davis Square | 82.0% – 86.0% | 81.4% – 84.4% | 76.0% – 80.0% |
Why these rankings reflect real survival outcomes
A low-ranking neighborhood can still contain high-potential storefronts — the address matters most. Neighborhood rankings are useful, but the exact odds for your location can only be seen by running a current survivability check in StreetSpring.
Survivability ranges reflect best and worst storefront conditions within each neighborhood. See our full methodology →
Try StreetSpring to see if this location is still the best and see if there are locations to rent in this area right now.
The Top Revenue Neighborhoods for Ethiopian Restaurants in Boston
In Boston, the best possible location offers the opportunity of making ~8.5% more than the average location in or around Boston.
On the other hand, in Winchester, the worst possible location could result in making ~6.6% less than the average location in the city.
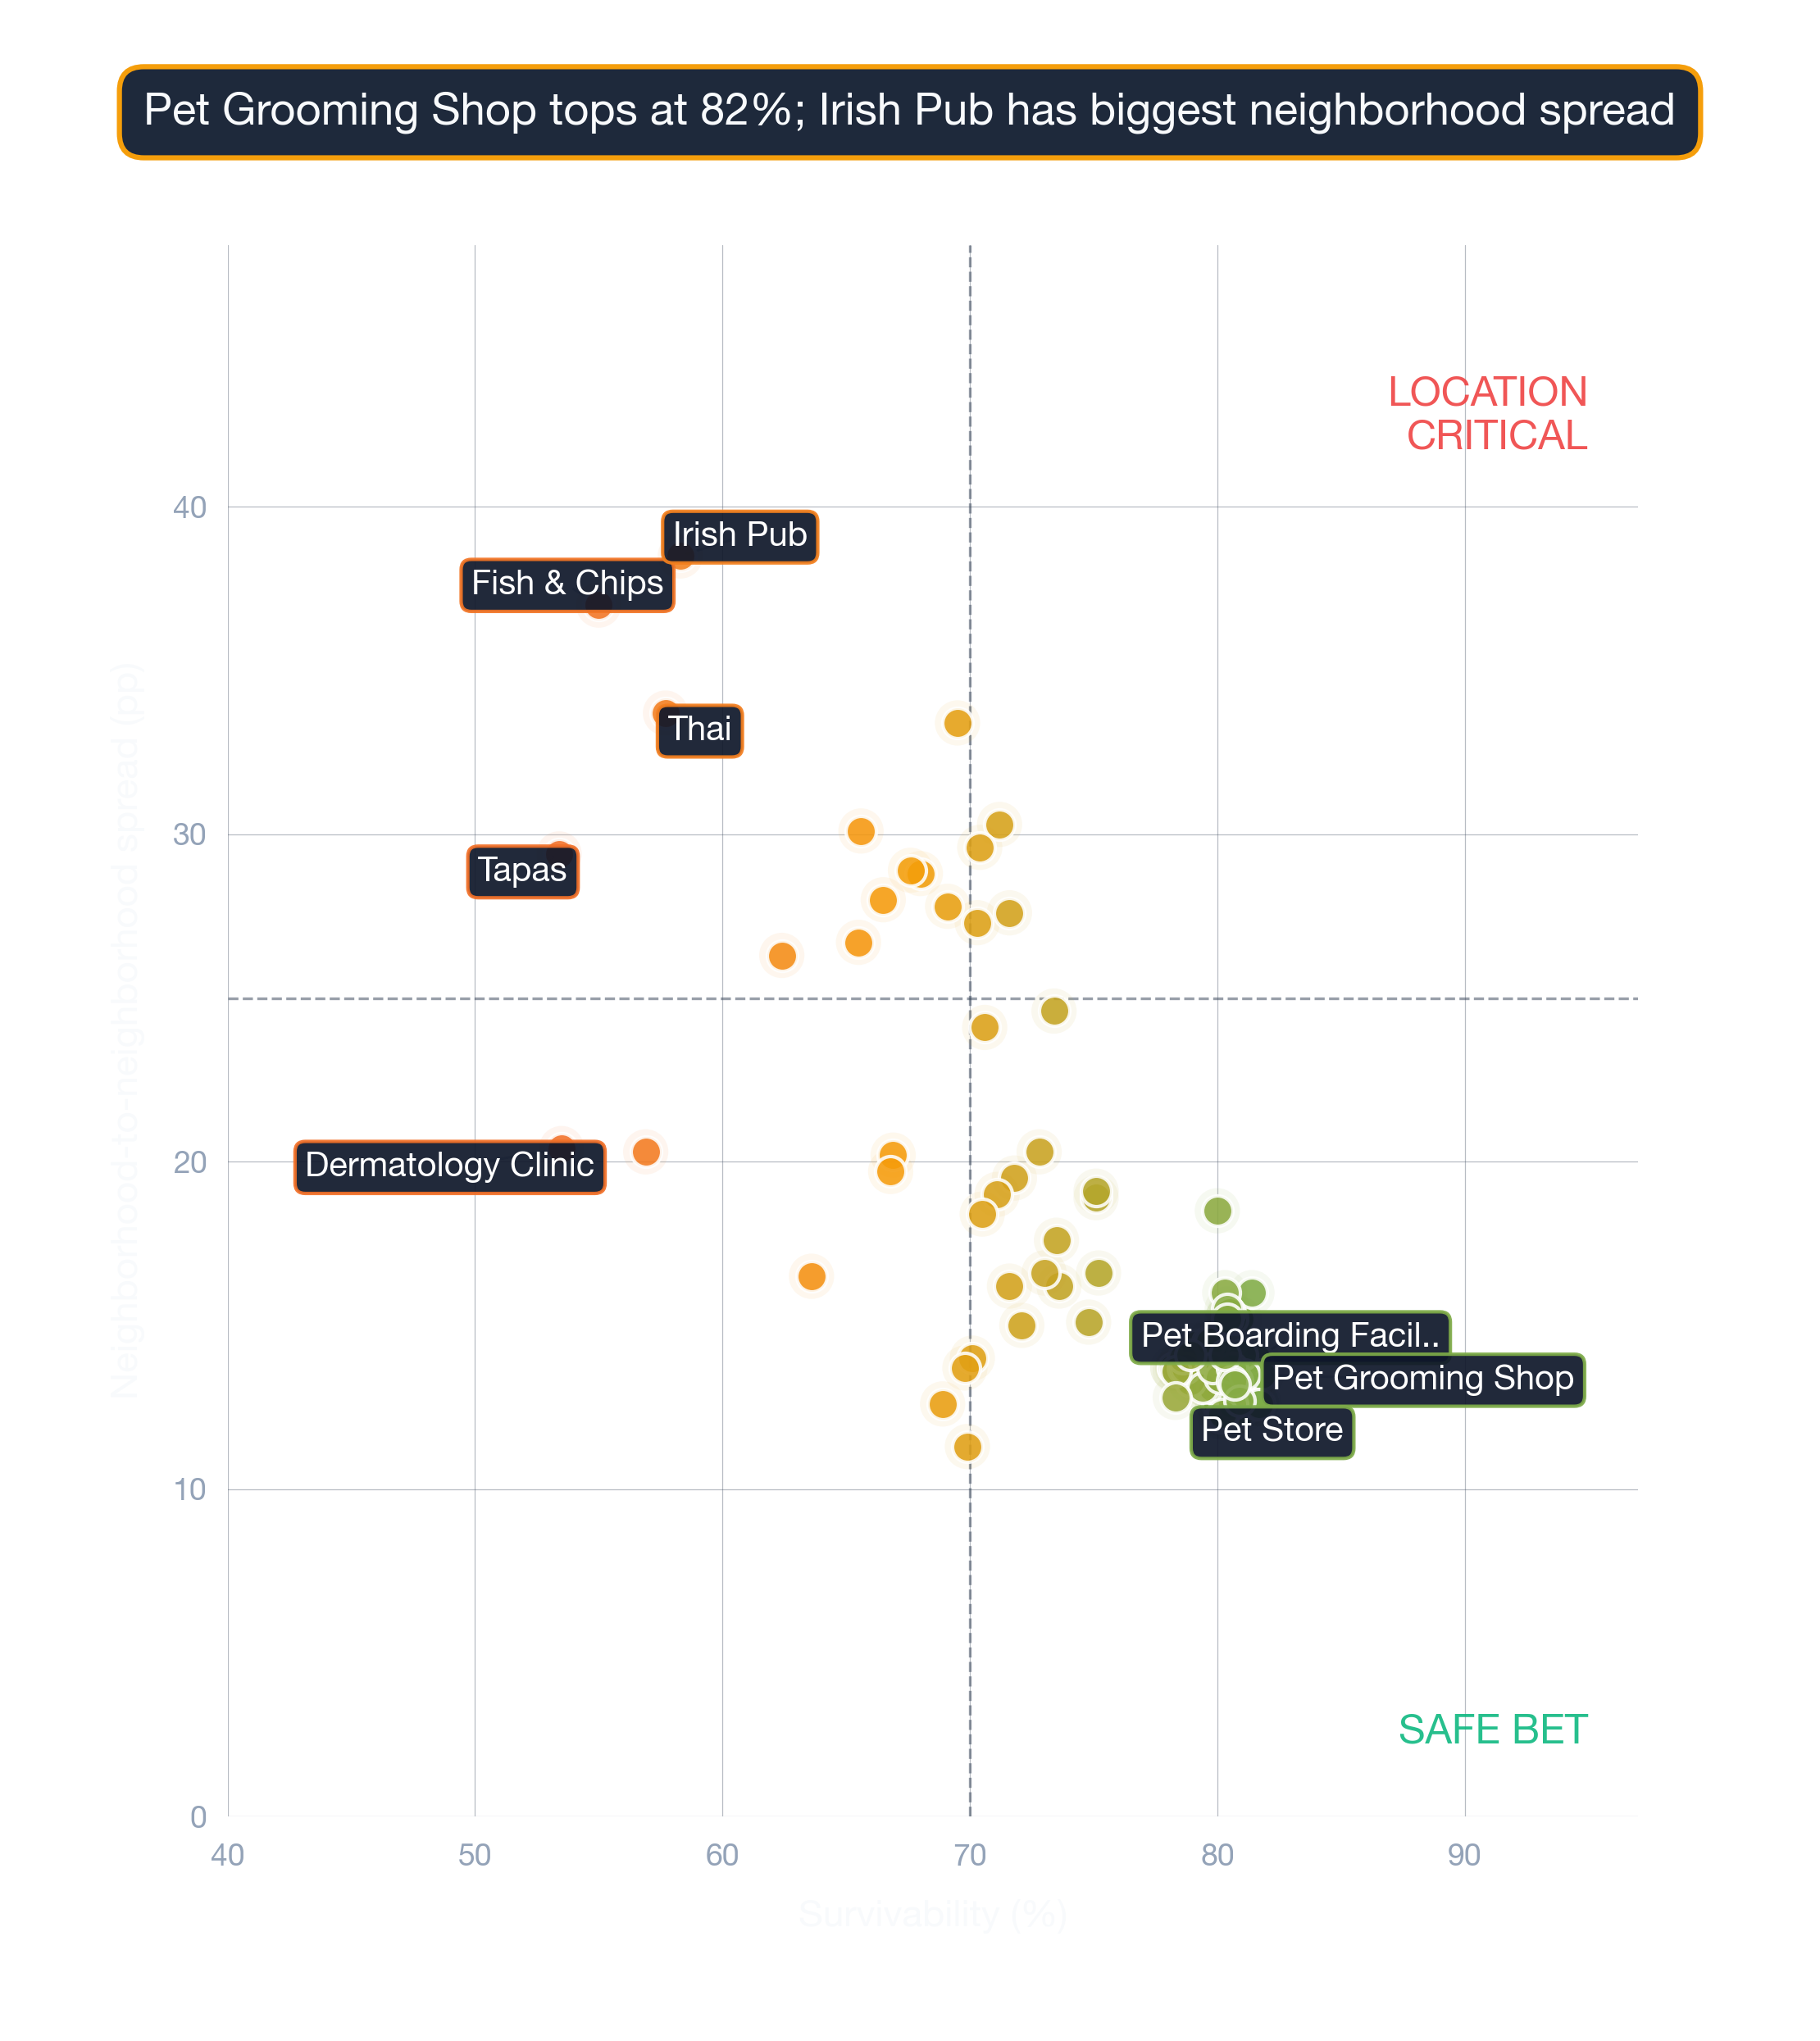
The difference between success and failure often comes down to where you sign the lease. Opening an Ethiopian Restaurant in Boston requires careful location choice. Across 88 neighborhoods analyzed, the overall average survival chance for a new Ethiopian Restaurant is 80% for lasting more than 2 years — due to a combination of many factors across competition, consumer spending, and location dynamics. Two businesses on the same block can have very different survivability scores depending on their category.
The Most Important Factors for an Ethiopian Restaurant in Boston
The address you sign for is the most consequential decision in launching this business. A high Survivability Score is a non-negotiable starting point. The most important factor for a business's success is the Revenue Capture Score for the business at the location it selects. StreetSpring computes this by projecting the business's market share, which is based on the quality and quantity of primary, secondary, and tertiary competitors. StreetSpring's training dataset includes millions of transactions and business lifecycle events. Competition density is not inherently negative — it often signals an established customer base. These insights come from StreetSpring's exclusive, in-house forecasting models.
| Area to check | What can go wrong | How to de-risk it |
|---|---|---|
| Workforce availability | Hiring radius is smaller than you think — many neighborhoods can't staff a full team at standard wages. | Pull BLS wage data for your industry in this metro. Walk through your staffing plan with a local restaurant/retail operator before signing. |
| Competitor density | Counting only direct competitors and missing adjacent-category overlap (e.g. coffee shop near a bakery). | Map all businesses serving overlapping customer needs within a 5-min walk. Use StreetSpring's competitor view as a starting point. |
| Lease term | Locking into 7-10 years without break clauses, then needing to relocate after year 2. | Negotiate a relocation or termination clause. Confirm assignment + sublease rights are in writing. |
This can be summarized as:
Revenue Capture Score = Projected Market Share × Forecasted Spend on Specific Business
Related: Survivability Score: How We Calculate It & Why It Matters
The survivability engine pulls fresh competitive, demographic, and walkability inputs on a regular cycle. Because storefront conditions shift daily, the live StreetSpring tool is the canonical source for an address-level score.
The Best Place to Start an Ethiopian Restaurant in Boston
The strongest survivability scores belong to Boston, Haverhill, and Medfield, while the most challenging neighborhoods would be Winchester, West Roxbury, and North Dorchester. Our data shows that roughly 15% of top-performing locations sit in neighborhoods ranked below the city median. Market dynamics shift frequently; validate these insights with real-time data from StreetSpring.
Related Articles:
- Business Survivability Rankings: Boston
- Neighborhood Survivability Rankings: Boston
- National City Survivability: Ethiopian Restaurant
Top-Survivability Boston Neighborhoods for Ethiopian Restaurants
Based on StreetSpring's 2026 analysis, the top neighborhood for an Ethiopian Restaurant in Boston is Boston with 87% average survivability, followed by Haverhill and Medfield. 88 of 88 neighborhoods analyzed exceed 70% two-year survival.
For the most accurate predictions, always check your specific address in StreetSpring's live platform.
When Lower-Scoring Neighborhoods Can Still Work for Ethiopian Restaurants
Yes — neighborhood averages mask significant block-by-block variation. Even in neighborhoods ranked outside the top 10, individual storefronts with strong foot traffic, low direct competition, and favorable lease terms can outperform the area average. Our data shows that roughly 15% of top-performing locations sit in neighborhoods ranked below the city median. Always check your specific address in StreetSpring's live platform for the most accurate prediction.
How Fresh Is Our Boston Ethiopian Restaurant Ranking Data?
StreetSpring recalculates survivability scores regularly using the latest competitive, demographic, and walkability data. Rankings are updated quarterly; the live tool always reflects the most current predictions for any address in Boston.
Is an Ethiopian Restaurant a Good Tenant for Boston Landlords?
In Boston, StreetSpring forecasts a 85.7% – 88.8% average chance for a new Ethiopian Restaurant to survive more than 2 years, depending on the exact storefront. Check the current Survivability Score for any address instantly.
Landlord Survivability Data for Ethiopian Restaurant in Boston
If you own commercial property in Boston and are considering an Ethiopian Restaurant tenant, here is what the data shows: Boston properties offer the best survivability outlook (85.7% – 88.8%), Haverhill is strong but slightly lower (85.6% – 88.6%), and Medfield rounds out the top 3 (84.6% – 87.6%). You can see the Survivability Score for your location for any business right now.
StreetSpring provides address-specific survivability predictions for over 700 business types.
Related: How Landlord Representatives Can Reduce Vacancy & Increase Tenant Longevity
Where Ethiopian Restaurants Thrive in Boston
You can see the best neighborhoods in or around Boston to open any type of business in our article Neighborhood Survivability Rankings: Boston.
Technical note: Aggregated survivability rankings for Boston are available in machine-readable format for research and integration purposes.
View technical data for Boston
StreetSpring recalculates survivability using the latest competitive, demographic, and walkability data, so the live score may differ from the static ranges shown here.
Visual Data
Related Resources
Same business type in other cities:
- City Survivability Rankings for Ethiopian Restaurant
- Survivability Rankings for Ethiopian Restaurant in Atlanta
Related:
Related:
Beyond the Numbers: Local Context
Local-context questions, answered with neighborhood-specific numbers.
What factors drive the Boston Ethiopian Restaurants score?
The Boston survivability score for Ethiopian Restaurants (84% average) combines ~100 location factors: competitive density, demographic fit, accessibility, visibility, lease economics, and historical business outcomes. The score is calibrated against 500K+ historical business outcomes and refreshed quarterly.
Does Boston's population profile support Ethiopian Restaurants?
Boston has a metro median household income of ~$135K and a median age of 41 (ACS data). These two factors enter the survivability model alongside competition density, lease economics, and accessibility — the model's average score for Ethiopian Restaurants in Boston is 84%.
Which US cities have the highest survivability for Ethiopian Restaurants?
Across 24 US metros, Portland, San Antonio, St. Louis top the rankings for Ethiopian Restaurants. Boston comes in at #22 with an average score of 84%.
How does Boston Ethiopian Restaurant survivability compare to the national BLS baseline?
Per BLS Business Employment Dynamics (March 2025 release), Ethiopian Restaurants have a 50% 5-year survival rate nationally. StreetSpring's Boston model averages 84% across tracked locations — above the national baseline by 34 percentage points.