Survivability Rankings for Dessert Shop in Boston
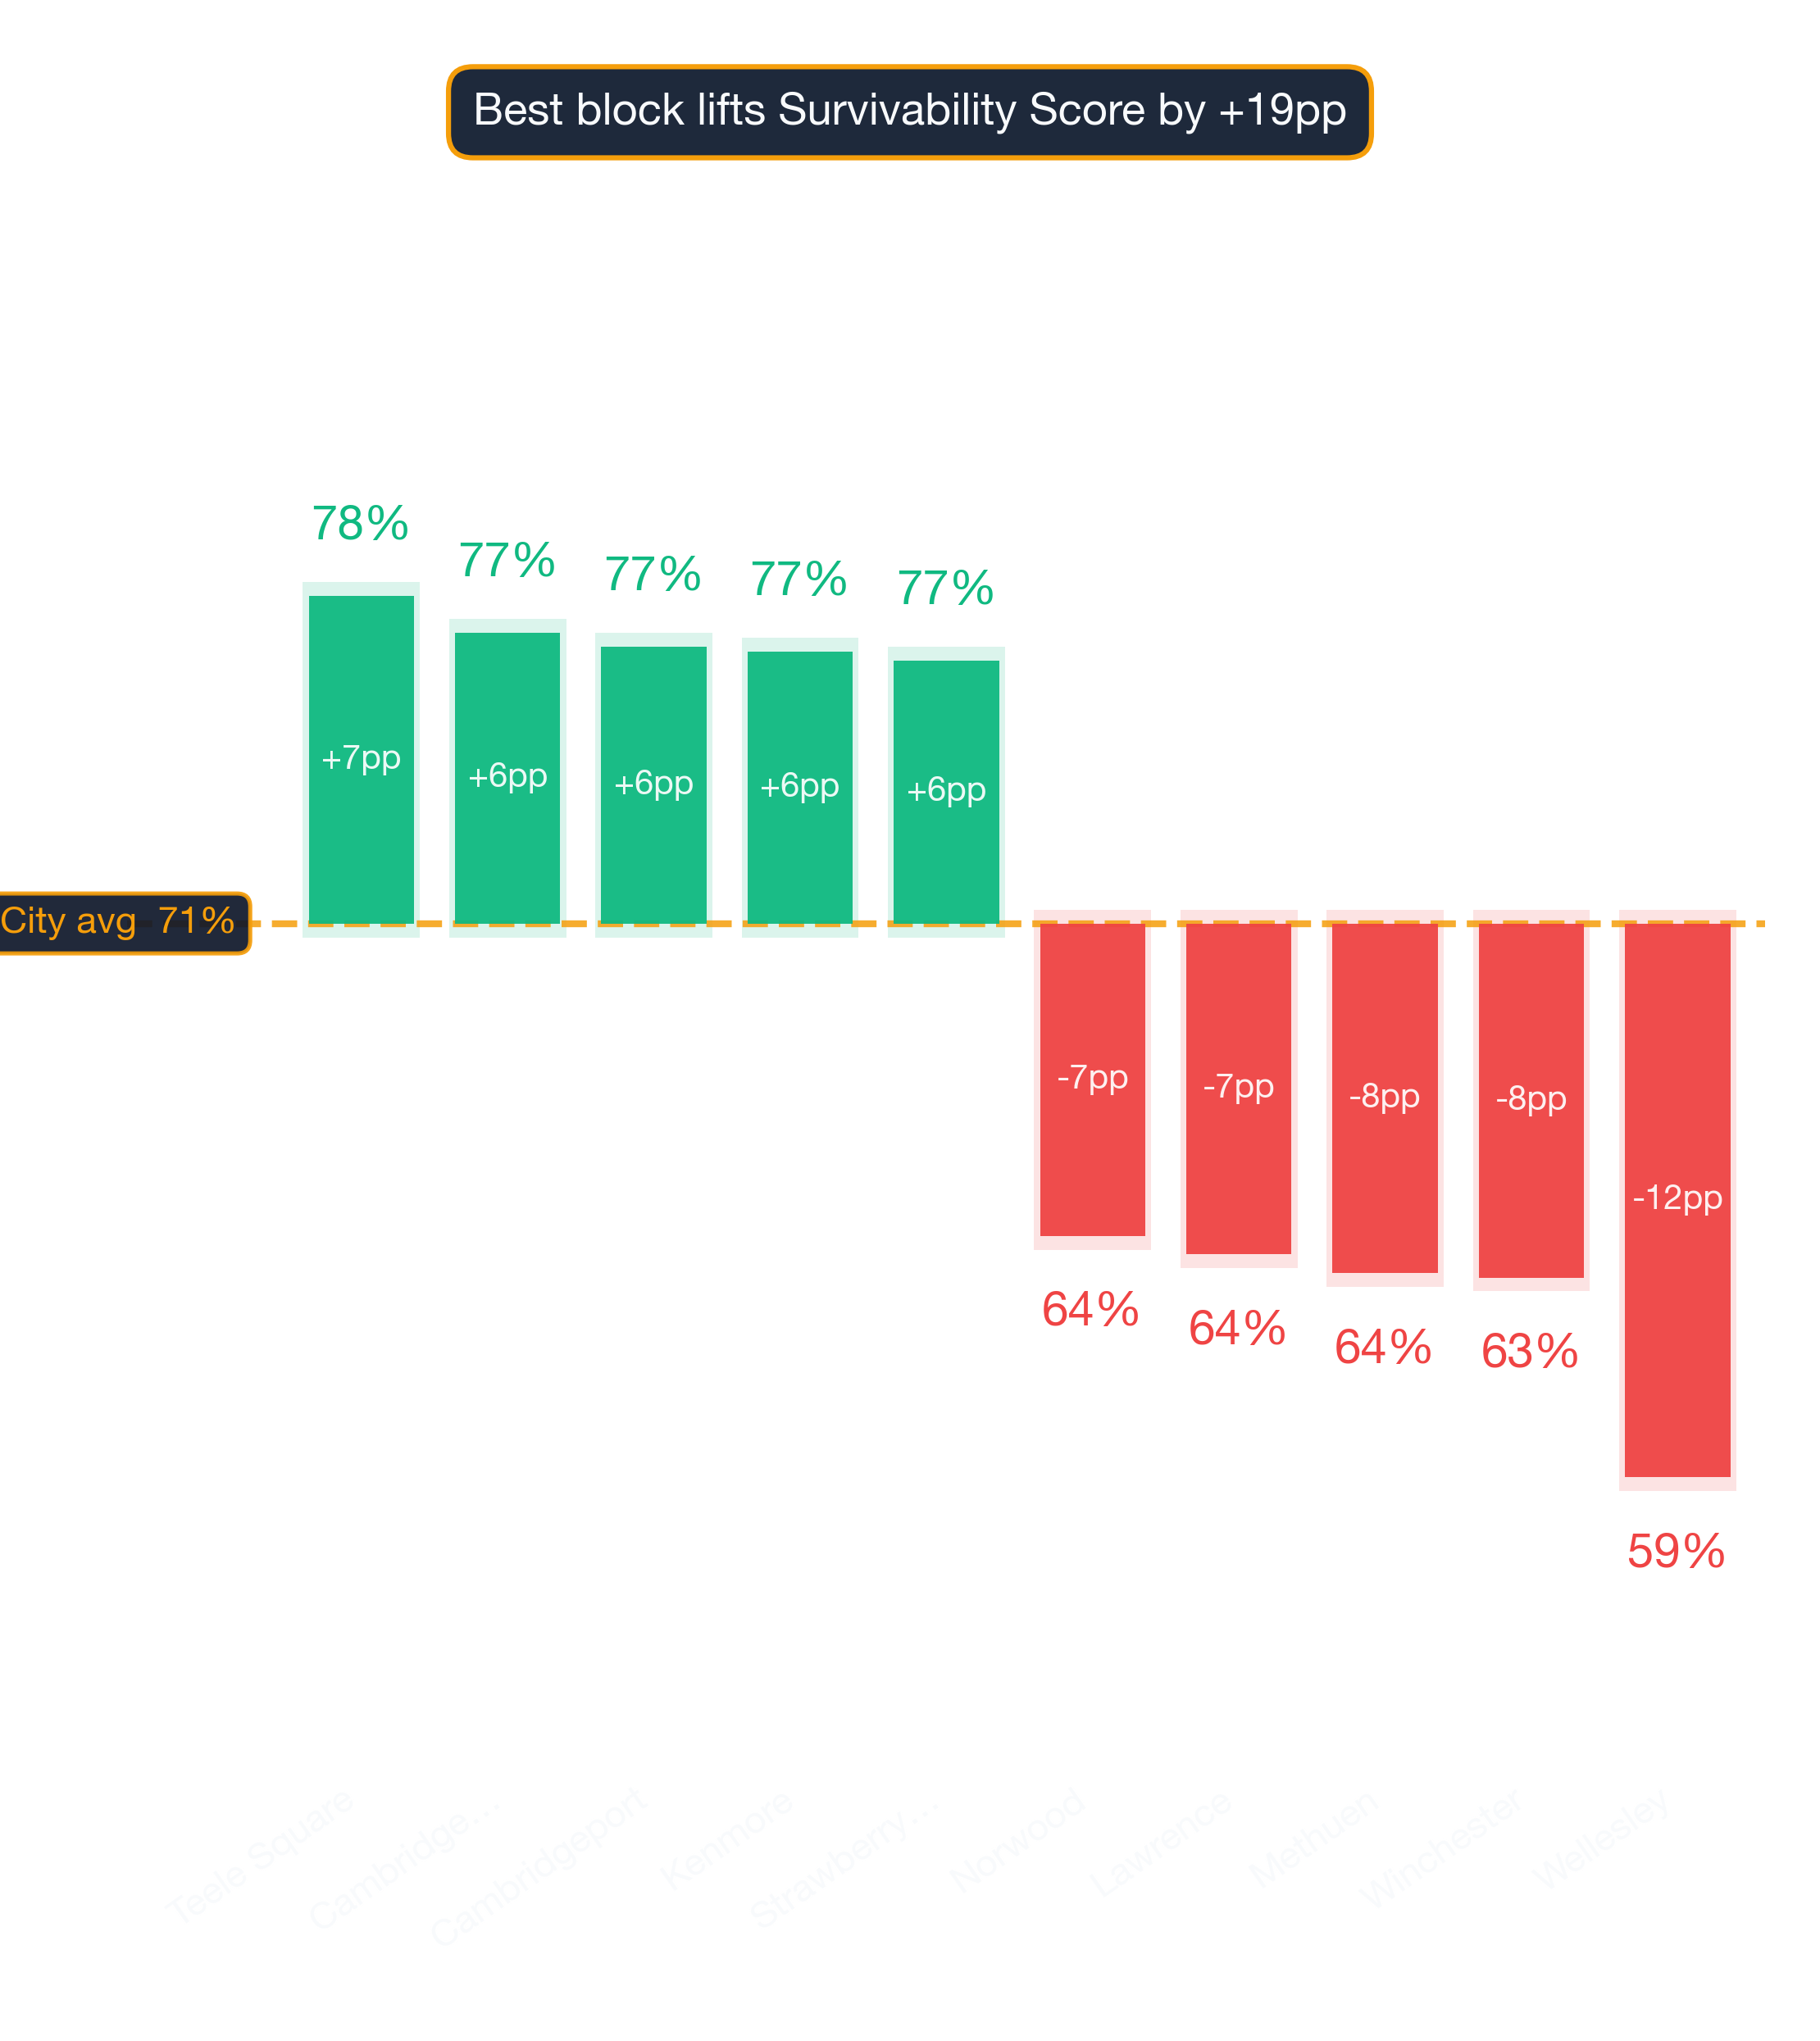
StreetSpring's 2026 analysis ranks the best and worst neighborhoods in Boston to open a Dessert Shop, from Teele Square (78% survival) to Wellesley (59%).
By Bobby Koons | Last updated: April 26, 2026 | Weekly methodology review | Methodology
Quick Summary
- #1 Neighborhood: Teele Square — 78% average survivability for Dessert Shop
- Neighborhoods at or above 70%: 62 of 88 analyzed
- City-wide average: 71% for Dessert Shops
- Most challenging area: Wellesley at 59%
- Revenue advantage (top vs. avg location): ~9.9% more expected revenue in Teele Square
- Data freshness: 2026 data · Full methodology →
Table of Contents
- Summary
- 10 Best Neighborhoods
- Where Would a Dessert Shop Make the Most Money?
- What Should I Consider?
- Where Should I Start?
- FAQ: Best Neighborhoods
- FAQ: Can a Dessert Shop Succeed in Lower-Ranked Areas?
- FAQ: How Often Are Rankings Updated?
- FAQ: Is a Dessert Shop a Good Tenant?
- Landlord Survivability Data
- Best Neighborhoods for Any Business
Summary
Of all the neighborhoods in and around Boston, Teele Square ranks #1 for opening a Dessert Shop with 78% average chance of surviving more than 2 years, with the best locations offering 87% and the most challenging locations in Teele Square at 67%. The worst neighborhoods include Wellesley with 59% average chance. Surface conditions can change in a week — for the most current score, the live StreetSpring tool beats any static page.
Top-Survivability Boston Neighborhoods for Dessert Shops
Teele Square ranks #1 of 88 neighborhoods analyzed in and around Boston for Dessert Shop survivability with a score of 78% as of 2026. The top 10 neighborhoods are:
How rent and competition shape the leaderboard
| Rank | Neighborhood | Best Locations | Average Locations | Challenging Locations |
|---|---|---|---|---|
| 1 | Teele Square | 84.0% – 88.0% | 76.1% – 79.8% | 66.0% – 70.0% |
| 2 | Cambridge Highlands | 83.0% – 87.0% | 75.3% – 79.1% | 67.0% – 71.0% |
| 3 | Cambridgeport | 82.0% – 86.0% | 75.0% – 78.8% | 68.0% – 72.0% |
| 4 | Kenmore | 84.0% – 88.0% | 74.8% – 78.6% | 68.0% – 72.0% |
| 5 | Strawberry Hill | 81.0% – 85.0% | 74.7% – 78.4% | 65.0% – 69.0% |
| 6 | Fenway | 81.0% – 85.0% | 74.6% – 78.4% | 65.0% – 69.0% |
| 7 | Allston | 83.0% – 87.0% | 74.5% – 78.3% | 65.0% – 69.0% |
| 8 | Watertown | 80.0% – 84.0% | 73.8% – 77.6% | 64.0% – 68.0% |
| 9 | North Quincy | 82.0% – 86.0% | 73.3% – 77.1% | 64.0% – 68.0% |
| 10 | South End | 81.0% – 85.0% | 73.3% – 77.0% | 66.0% – 70.0% |
Notable runners-up worth a second look
A low-ranking neighborhood can still contain high-potential storefronts — the address matters most. However, market conditions change daily, and it's best to use StreetSpring's live data to check the Survivability Score for a specific address.
Survivability ranges reflect best and worst storefront conditions within each neighborhood. See our full methodology →
Try StreetSpring to see if this location is still the best and see if there are locations to rent in this area right now.
Where Dessert Shops Earn the Most in Boston
In Teele Square, the best possible location offers the opportunity of making ~9.9% more than the average location in or around Boston.
On the other hand, in Wellesley, the worst possible location could result in making ~16.7% less than the average location in the city.
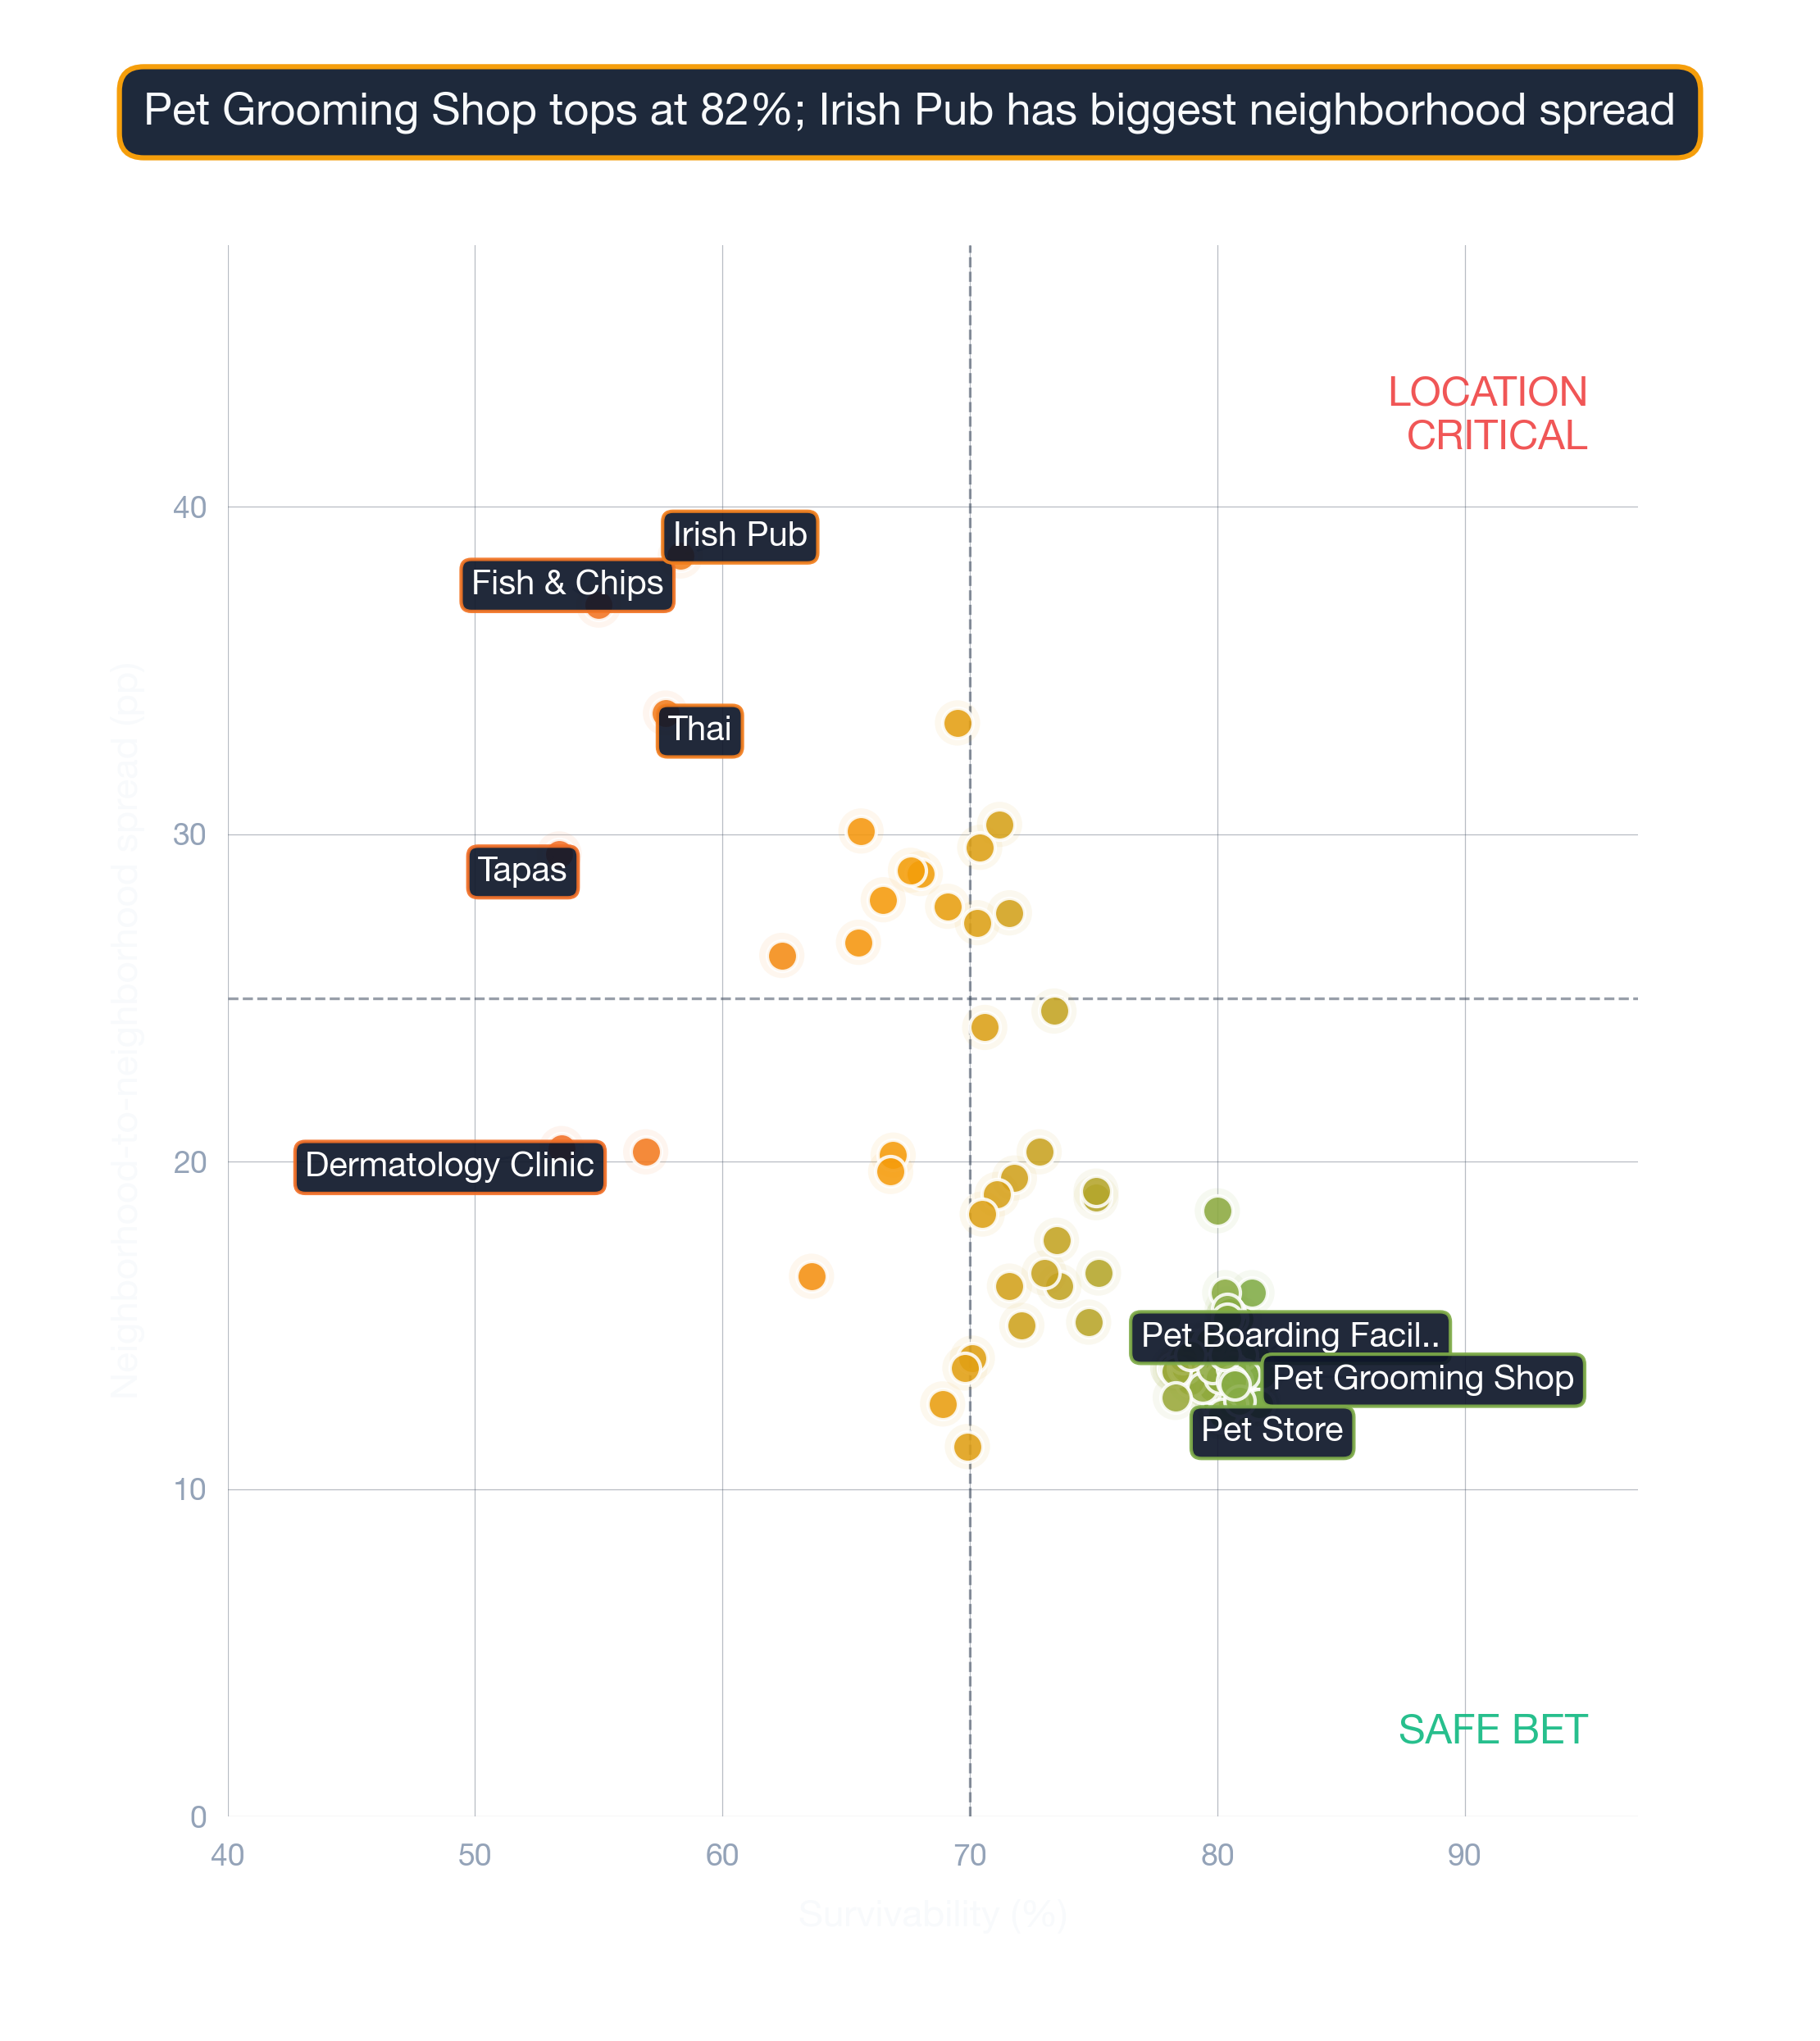
The right location can make a business; the wrong one can break it. Opening a Dessert Shop in Boston requires careful location choice. Across 88 neighborhoods analyzed, the overall average survival chance for a new Dessert Shop is 71% for lasting more than 2 years — due to a combination of many factors across competition, consumer spending, and location dynamics. The interplay between location characteristics and business type produces unique survivability scores for every combination.
What Should I Consider When Opening a Dessert Shop in or Around Boston?
Picking the right location is the single highest-leverage decision in launching this business — Survivability Score is the lens that frames the rest of the decision. Among all factors in our model, Revenue Capture Score carries the most weight in determining long-term survivability. StreetSpring computes this by projecting the business's market share, which is based on the quality and quantity of primary, secondary, and tertiary competitors. The analysis behind these rankings spans millions of data points across competition, spending, and mobility. Areas with complementary competitors tend to generate higher overall foot traffic. These forecasts are generated using StreetSpring's unique analytical framework.
| Consideration | Common pitfall | What to verify before signing |
|---|---|---|
| Foot traffic seasonality | Looking at a peak-summer Tuesday and assuming year-round volume. | Walk the block at 3 different times across 2 different weeks. Ask neighboring tenants for their slow-season % drop. |
| CAM + hidden costs | Stated rent looks great, then CAM fees, signage charges, and after-hours utilities add 15-30%. | Get the full operating expense breakdown for the past 2 years. Ask which costs are landlord-capped vs. uncapped. |
| Competitor density | Counting only direct competitors and missing adjacent-category overlap (e.g. coffee shop near a bakery). | Map all businesses serving overlapping customer needs within a 5-min walk. Use StreetSpring's competitor view as a starting point. |
This can be summarized as:
Revenue Capture Score = Projected Market Share × Forecasted Spend on Specific Business
Related: Survivability Score: How We Calculate It & Why It Matters
StreetSpring recalculates survivability using the latest competitive, demographic, and walkability data. StreetSpring refreshes survivability data continuously — check the tool for the most current score at any address.
Where to Launch a Dessert Shop in or Around Boston
The neighborhoods with the highest survivability for this business type are Teele Square, Cambridge Highlands, and Cambridgeport, while the most challenging neighborhoods would be Wellesley, Winchester, and Methuen. Market conditions are changing daily and it is best to use StreetSpring's most up-to-date data. Market dynamics shift frequently; validate these insights with real-time data from StreetSpring.
Related Articles:
- Business Survivability Rankings: Boston
- Neighborhood Survivability Rankings: Boston
- National City Survivability: Dessert Shop
Where Dessert Shops Thrive in Boston
Based on StreetSpring's 2026 analysis, the top neighborhood for a Dessert Shop in Boston is Teele Square with 78% average survivability, followed by Cambridge Highlands and Cambridgeport. 62 of 88 neighborhoods analyzed exceed 70% two-year survival.
StreetSpring refreshes survivability data continuously — check the tool for the most current score at any address.
When Lower-Scoring Neighborhoods Can Still Work for Dessert Shops
Yes — neighborhood averages mask significant block-by-block variation. Even in neighborhoods ranked outside the top 10, individual storefronts with strong foot traffic, low direct competition, and favorable lease terms can outperform the area average. These averages are directional, not definitive; the best decision comes from analyzing your specific storefront. Always check your specific address in StreetSpring's live platform for the most accurate prediction.
How Often Are Dessert Shop Rankings in Boston Updated?
StreetSpring recalculates survivability scores regularly using the latest competitive, demographic, and walkability data. Rankings are updated quarterly; the live tool always reflects the most current predictions for any address in Boston.
What Makes a Dessert Shop a Strong (or Weak) Boston Tenant?
In Teele Square, StreetSpring forecasts a 76.1% – 79.8% average chance for a new Dessert Shop to survive more than 2 years, depending on the exact storefront. Check the current Survivability Score for any address instantly.
Landlord Survivability Data for Dessert Shop in Boston
Tenant longevity is a top concern for commercial landlords. In Teele Square, a Dessert Shop tenant averages 76.1% – 79.8% chance of lasting more than 2 years — the strongest outlook in Boston. Cambridge Highlands follows at 75.3% – 79.1%, while Cambridgeport shows 75.0% – 78.8%. You can see the Survivability Score for your location for any business right now.
Each prediction is calibrated to the specific address, factoring in foot traffic, competition, and consumer spending at that exact location.
Related: How Landlord Representatives Can Reduce Vacancy & Increase Tenant Longevity
What Are the Best Neighborhoods in Boston to Open a Dessert Shop?
You can see the best neighborhoods in or around Boston to open any type of business in our article Neighborhood Survivability Rankings: Boston.
Technical note: Aggregated survivability rankings for Boston are available in machine-readable format for research and integration purposes.
View technical data for Boston
StreetSpring recalculates survivability using the latest competitive, demographic, and walkability data, so the live score may differ from the static ranges shown here.
Visual Data
Related Resources
Same business type in other cities:
Related:
Related:
More Questions About This Location
More questions answered with neighborhood-specific data from our 2026 corpus.
What's the survivability spread for Dessert Shops across Boston?
The Boston survivability spread for Dessert Shops runs from 36% (challenging locations) to 91% (best locations) — a 55-point window driven entirely by site selection.
What are the top metros nationally for opening a Dessert Shop?
Per StreetSpring's 24-metro model, the top three US cities for Dessert Shops survivability are Miami, Dallas, Orlando. Boston ranks #9, averaging 67%.
Are there peer business categories with similar Boston survivability to Dessert Shops?
Per StreetSpring's Boston corpus, peers of Dessert Shops (within 2 points of the 67% average) include Children's Clothing & Toys Store, Beauty Salon, Gift Shop.
How many Boston neighborhoods has StreetSpring scored for Dessert Shops?
StreetSpring's Boston model covers Dessert Shops across all tracked neighborhoods — the average score is 67%, with neighborhood-level scores spanning 36-91%. Real-time scores at the address level capture finer variation than these neighborhood averages.
How important is foot traffic / accessibility for a Dessert Shop in Boston?
Boston's metro median commute is 32 minutes. Accessibility is one of ~100 factors in the survivability model — Dessert Shops in Boston score 67% on average, with the spread (36-91%) driven heavily by per-location accessibility differences.