Survivability Rankings for Day Care Center in Boston
StreetSpring's 2026 analysis ranks the best and worst neighborhoods in Boston to open a Day Care Center, from Boston (86% survival) to Winchester (72%).
By Bobby Koons | Last reviewed: May 4, 2026 | New data weekly | Methodology
Quick Summary
- #1 Neighborhood: Boston — 86% average survivability for Day Care Center
- Neighborhoods at or above 70%: 88 of 88 analyzed
- City-wide average: 80% for Day Care Centers
- Most challenging area: Winchester at 72%
- Revenue advantage (top vs. avg location): ~8.3% more expected revenue in Boston
- Data freshness: 2026 data · Full methodology →
Table of Contents
- Summary
- 10 Best Neighborhoods
- Where Would a Day Care Center Make the Most Money?
- What Should I Consider?
- Where Should I Start?
- FAQ: Best Neighborhoods
- FAQ: Can a Day Care Center Succeed in Lower-Ranked Areas?
- FAQ: How Often Are Rankings Updated?
- FAQ: Is a Day Care Center a Good Tenant?
- Landlord Survivability Data
- Best Neighborhoods for Any Business
Summary
Boston leads Boston's 2026 survivability rankings for Day Care Center operators with 86% average chance of surviving more than 2 years, with the best locations offering 91% and the most challenging locations in Boston at 73%. The worst neighborhoods include Winchester with 72% average chance. Our data shows that roughly 15% of top-performing locations sit in neighborhoods ranked below the city median.
Where in Boston Should You Open a Day Care Center?
Boston ranks #1 of 88 neighborhoods analyzed in and around Boston for Day Care Center survivability with a score of 86% as of 2026. The top 10 neighborhoods are:
Where the rankings might surprise you
| Rank | Neighborhood | Best Locations | Average Locations | Challenging Locations |
|---|---|---|---|---|
| 1 | Boston | 88.0% – 92.0% | 83.3% – 88.7% | 72.0% – 76.0% |
| 2 | Haverhill | 92.0% – 96.0% | 81.7% – 87.2% | 62.0% – 66.0% |
| 3 | Revere | 94.0% – 97.0% | 81.0% – 86.4% | 66.0% – 70.0% |
| 4 | Dover | 92.0% – 96.0% | 80.5% – 85.9% | 66.0% – 70.0% |
| 5 | Davis Square | 83.0% – 87.0% | 80.1% – 85.5% | 78.0% – 82.0% |
| 6 | Medfield | 92.0% – 96.0% | 80.1% – 85.5% | 61.0% – 65.0% |
| 7 | Merrymount | 90.0% – 94.0% | 80.0% – 85.4% | 70.0% – 74.0% |
| 8 | East Boston | 91.0% – 95.0% | 79.9% – 85.3% | 67.0% – 71.0% |
| 9 | Methuen | 92.0% – 96.0% | 79.8% – 85.2% | 62.0% – 66.0% |
| 10 | Aggasiz - Harvard North | 82.0% – 86.0% | 79.6% – 85.0% | 78.0% – 82.0% |
How rent and competition shape the leaderboard
These rankings are based on the latest available data; check StreetSpring for real-time updates. However, market conditions change daily, and it's best to use StreetSpring's live data to check the Survivability Score for a specific address.
Survivability ranges reflect best and worst storefront conditions within each neighborhood. See our full methodology →
Try StreetSpring to see if this location is still the best and see if there are locations to rent in this area right now.
Where in or Around Boston Would a Day Care Center Make the Most Money?
In Boston, the best possible location offers the opportunity of making ~8.3% more than the average location in or around Boston.
On the other hand, in Winchester, the worst possible location could result in making ~9.7% less than the average location in the city.
Where you open matters more than anything else. Opening a Day Care Center in Boston requires careful location choice. Across 88 neighborhoods analyzed, the overall average survival chance for a new Day Care Center is 80% for lasting more than 2 years — due to a combination of many factors across competition, consumer spending, and location dynamics. Consumer spending patterns differ dramatically across business types and micro-locations.
What to Think About When Launching a Day Care Center in Boston
The address you sign for is the most consequential decision in launching this business. A high Survivability Score is a non-negotiable starting point. When evaluating a potential location, Revenue Capture Score should be the first number you look at. StreetSpring computes this by projecting the business's market share, which is based on the quality and quantity of primary, secondary, and tertiary competitors. Our forecasting engine processes data from over 24 metro areas covering 180+ million consumers. Strategic clustering can actually boost performance by creating destination zones. The prediction engine behind these rankings is entirely proprietary — developed in-house over years of research.
| Area to check | What can go wrong | How to de-risk it |
|---|---|---|
| Lease term | Locking into 7-10 years without break clauses, then needing to relocate after year 2. | Negotiate a relocation or termination clause. Confirm assignment + sublease rights are in writing. |
| Outdoor seating / sidewalk use | Signing assuming you can add patio seating, then learning the city requires a separate sidewalk-cafe permit with long lead times. | Check the city's sidewalk-cafe permit process up front. Confirm landlord allows outdoor build-out in the lease language. |
| Foot traffic seasonality | Looking at a peak-summer Tuesday and assuming year-round volume. | Walk the block at 3 different times across 2 different weeks. Ask neighboring tenants for their slow-season % drop. |
This can be summarized as:
Revenue Capture Score = Projected Market Share × Forecasted Spend on Specific Business
Related: Survivability Score: How We Calculate It & Why It Matters
StreetSpring recalculates survivability using the latest competitive, demographic, and walkability data. Real-time data from StreetSpring accounts for recent openings, closures, and seasonal shifts that static rankings cannot.
Pinpointing the Right Neighborhood for a Day Care Center in Boston
StreetSpring identifies the strongest markets as Boston, Haverhill, and Revere, while the most challenging neighborhoods would be Winchester, Arlington, and Belmont. Location-level factors like visibility and adjacent tenants can override neighborhood-level trends. For the most accurate predictions, always check your specific address in StreetSpring's live platform.
Related Articles:
- Business Survivability Rankings: Boston
- Neighborhood Survivability Rankings: Boston
- National City Survivability: Day Care Center
Which Boston Neighborhoods Are Strongest for Day Care Centers?
Based on StreetSpring's 2026 analysis, the top neighborhood for a Day Care Center in Boston is Boston with 86% average survivability, followed by Haverhill and Revere. 88 of 88 neighborhoods analyzed exceed 70% two-year survival.
Because local conditions evolve weekly, the live survivability tool offers a more current snapshot than any published ranking.
Should You Consider Lower-Survivability Areas of Boston for a Day Care Center?
Yes — neighborhood averages mask significant block-by-block variation. Even in neighborhoods ranked outside the top 10, individual storefronts with strong foot traffic, low direct competition, and favorable lease terms can outperform the area average. For the most current predictions, visit StreetSpring to analyze your specific location in real-time. Always check your specific address in StreetSpring's live platform for the most accurate prediction.
When Does StreetSpring Update Boston Day Care Center Rankings?
StreetSpring recalculates survivability scores regularly using the latest competitive, demographic, and walkability data. Rankings are updated quarterly; the live tool always reflects the most current predictions for any address in Boston.
Should Boston Landlords Lease to Day Care Centers?
In Boston, StreetSpring forecasts a 83.3% – 88.7% average chance for a new Day Care Center to survive more than 2 years, depending on the exact storefront. Check the current Survivability Score for any address instantly.
Landlord Survivability Data for Day Care Center in Boston
Landlords in Boston's top three neighborhoods for Day Care Center can expect the following average survivability for new tenants:
- Boston: 83.3% – 88.7%
- Haverhill: 81.7% – 87.2%
- Revere: 81.0% – 86.4%
You can see the Survivability Score for your location for any business right now.
Our tool delivers pinpoint accuracy down to the exact storefront location for any business category.
Related: How Landlord Representatives Can Reduce Vacancy & Increase Tenant Longevity
Top-Survivability Boston Neighborhoods for Day Care Centers
You can see the best neighborhoods in or around Boston to open any type of business in our article Neighborhood Survivability Rankings: Boston.
Technical note: Aggregated survivability rankings for Boston are available in machine-readable format for research and integration purposes.
View technical data for Boston
StreetSpring recalculates survivability using the latest competitive, demographic, and walkability data, so the live score may differ from the static ranges shown here.
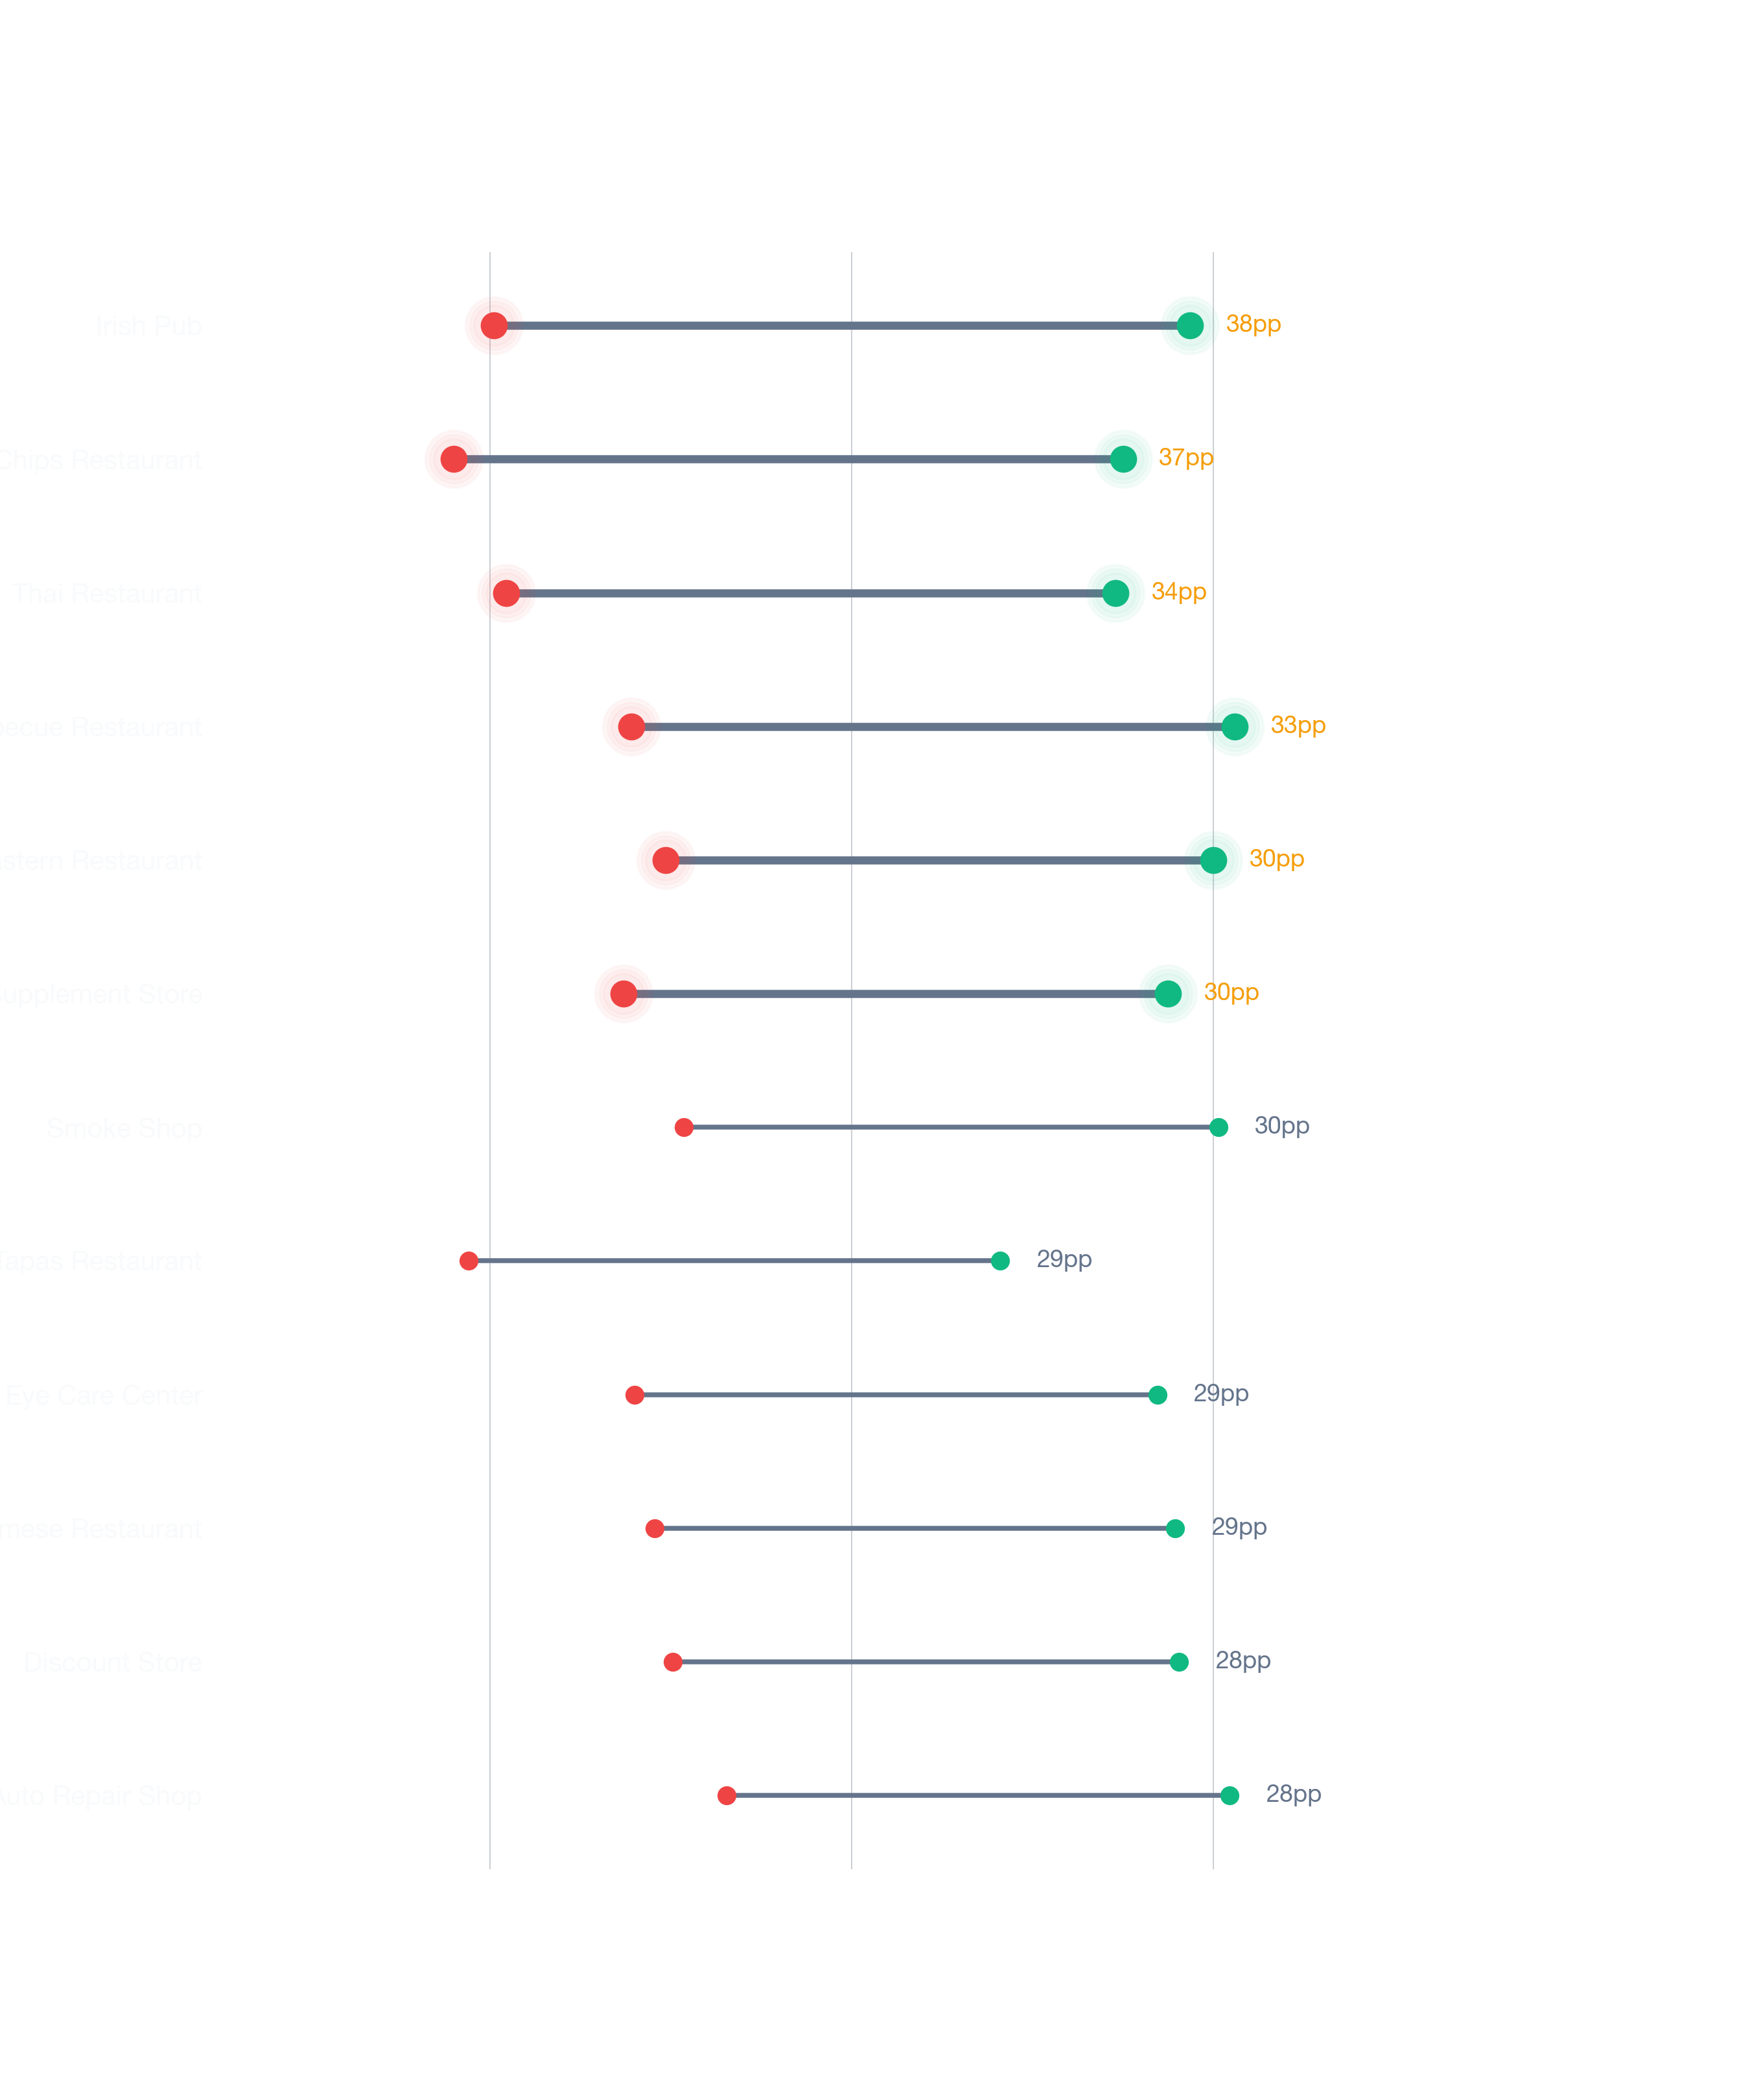
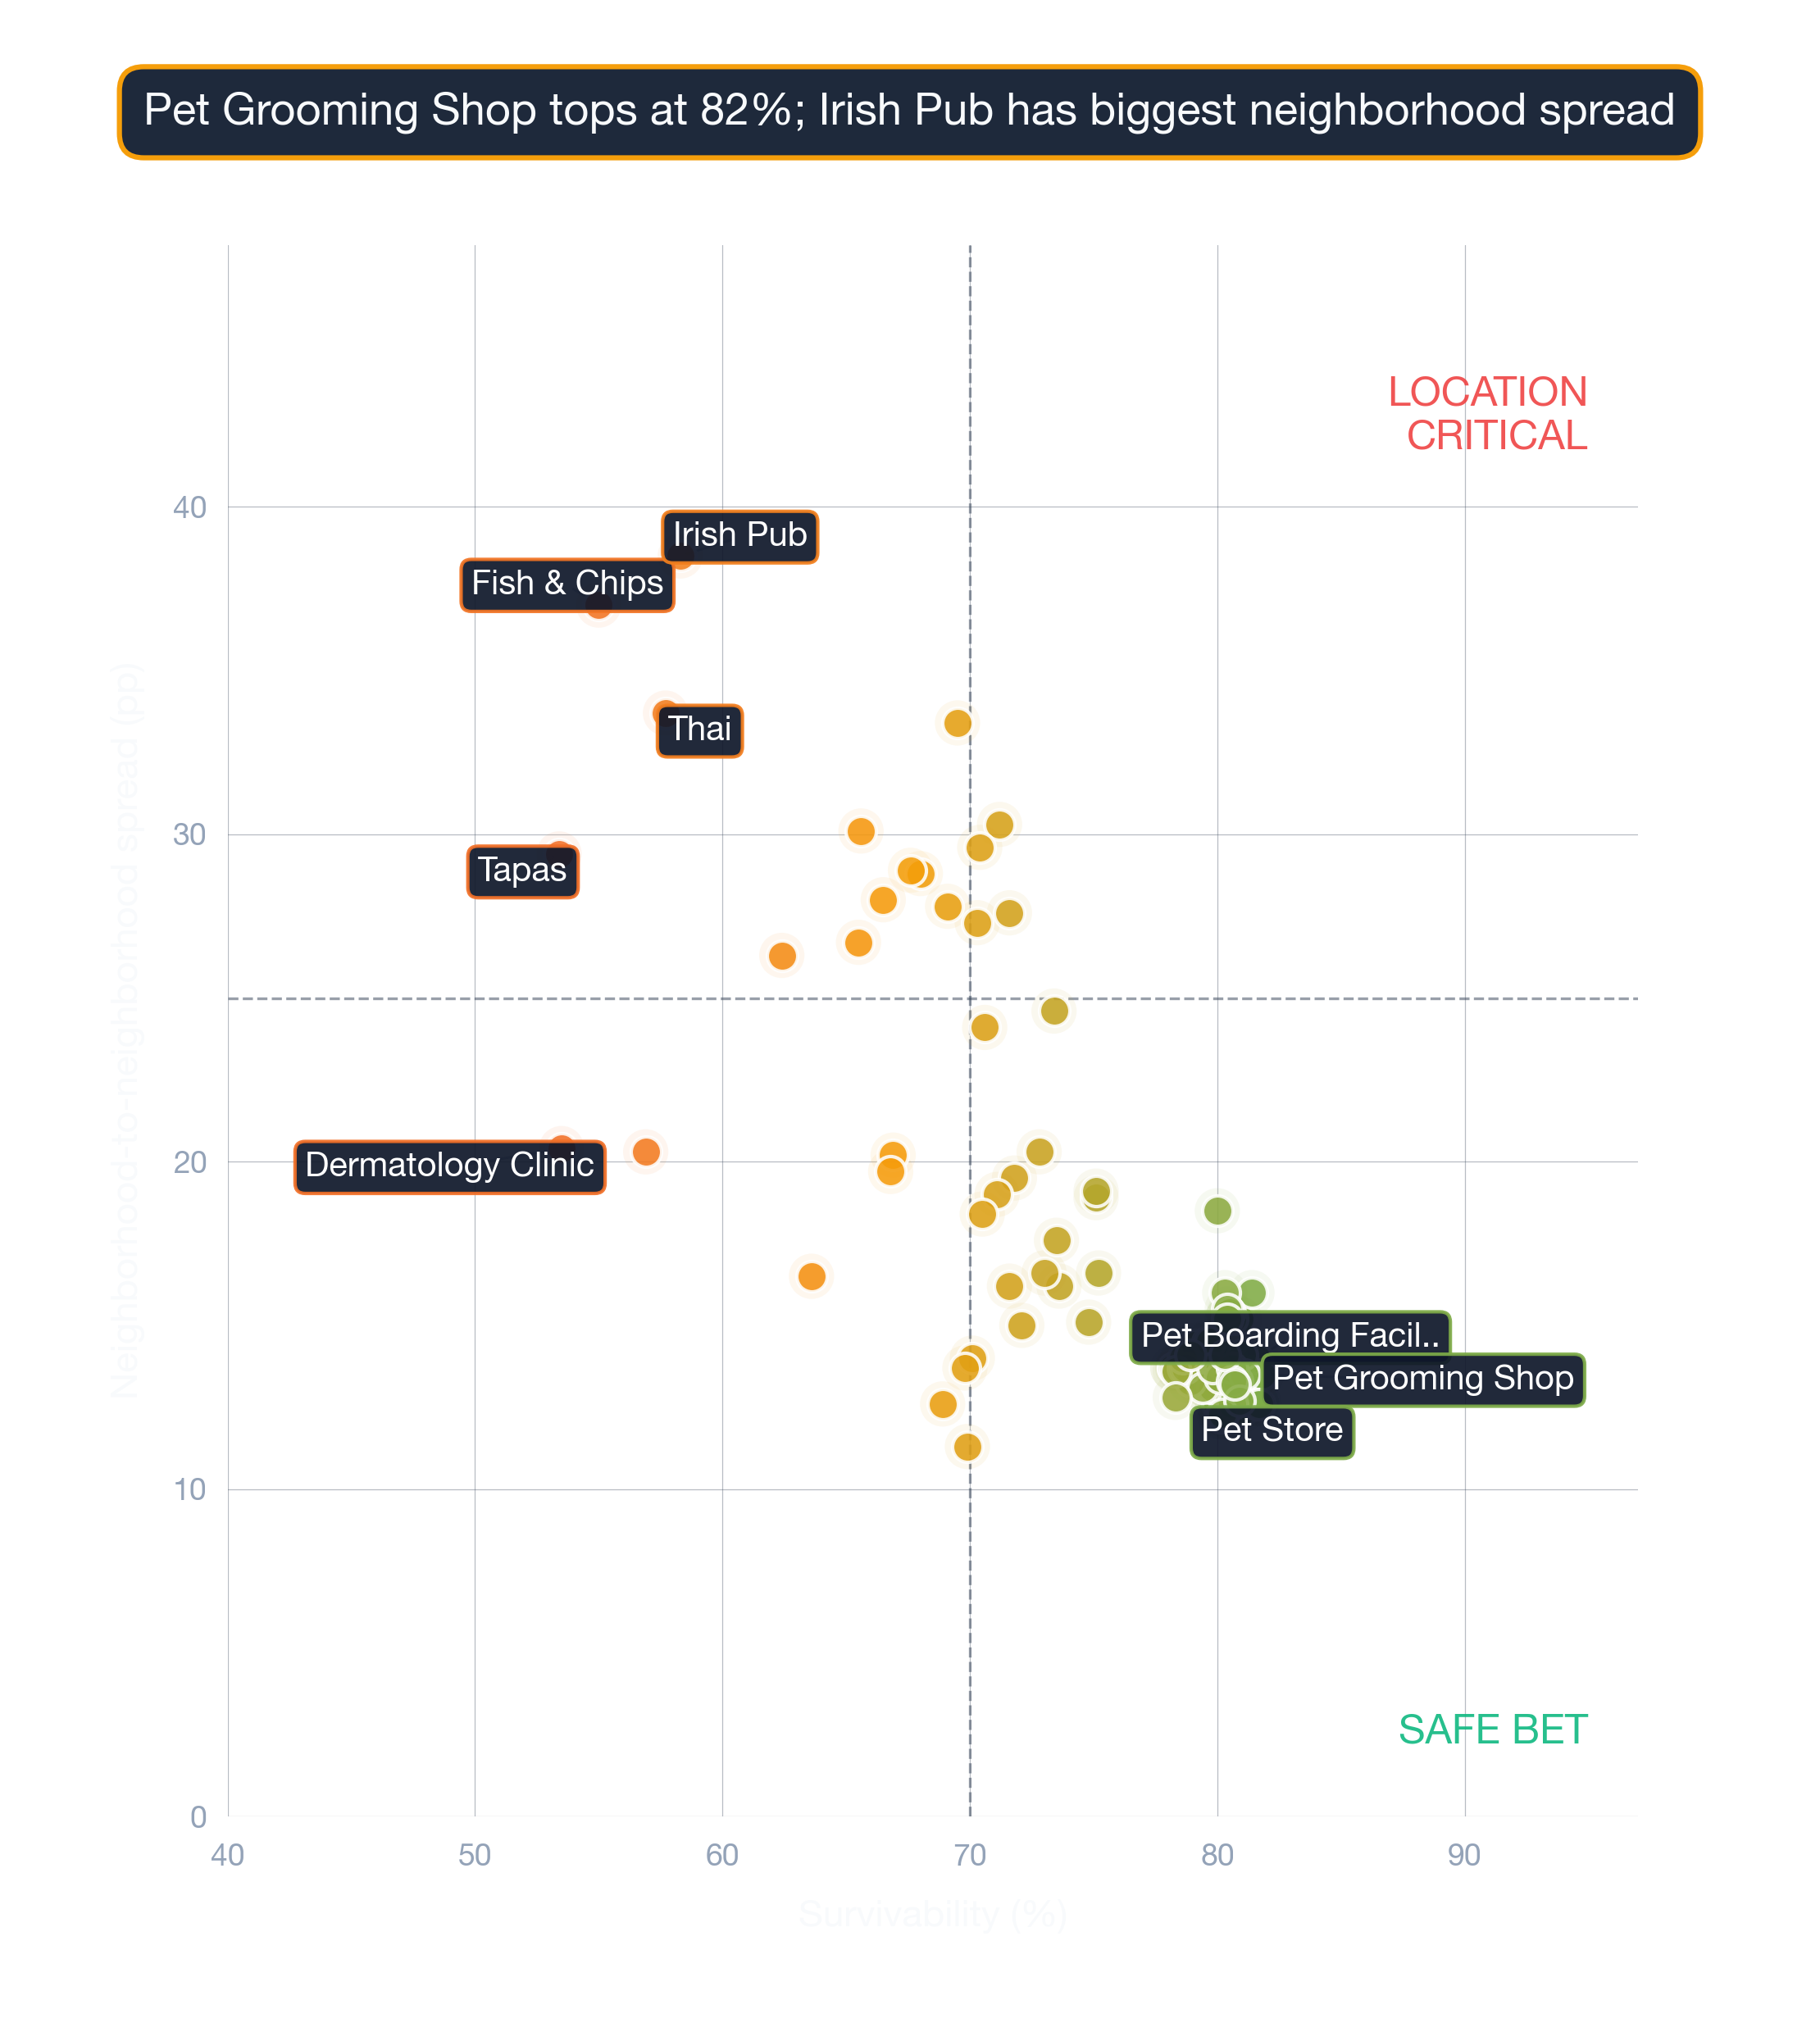
Visual Data
Related Resources
Same business type in other cities:
- City Survivability Rankings for Day Care Center
- Survivability Rankings for Day Care Center in Atlanta
- National Neighborhood Survivability Rankings for Day Care Center
Related:
More Questions About This Location
Further questions, with answers anchored on this neighborhood's actual data.
Which Boston subtypes have comparable survivability to Day Care Centers?
Boston subtypes scoring within 2 points of Day Care Centers's 69% average include Watch Store or Repair Shop, Coffee Shop, Vitamin & Supplement Store. Survivability convergence at the metro level usually reflects shared local factors like saturation density or demographic fit.
Is Boston a strong economic environment for opening a Day Care Center?
ACS data puts Boston's employment rate at ~96% and median household income at ~$135K. StreetSpring's Day Care Centers model averages 69% across the metro, weighting both macro and site-specific factors.
What are the key demographic factors for Day Care Centers in Boston?
Boston has a metro median household income of ~$135K and a median age of 41 (ACS data). These two factors enter the survivability model alongside competition density, lease economics, and accessibility — the model's average score for Day Care Centers in Boston is 69%.