Survivability Rankings for Afghan Restaurant in Boston
StreetSpring's 2026 analysis ranks the best and worst neighborhoods in Boston to open an Afghan Restaurant, from Haverhill (87% survival) to Winchester ...
By Bobby Koons | Last reviewed: April 26, 2026 | Updated weekly | Methodology
Quick Summary
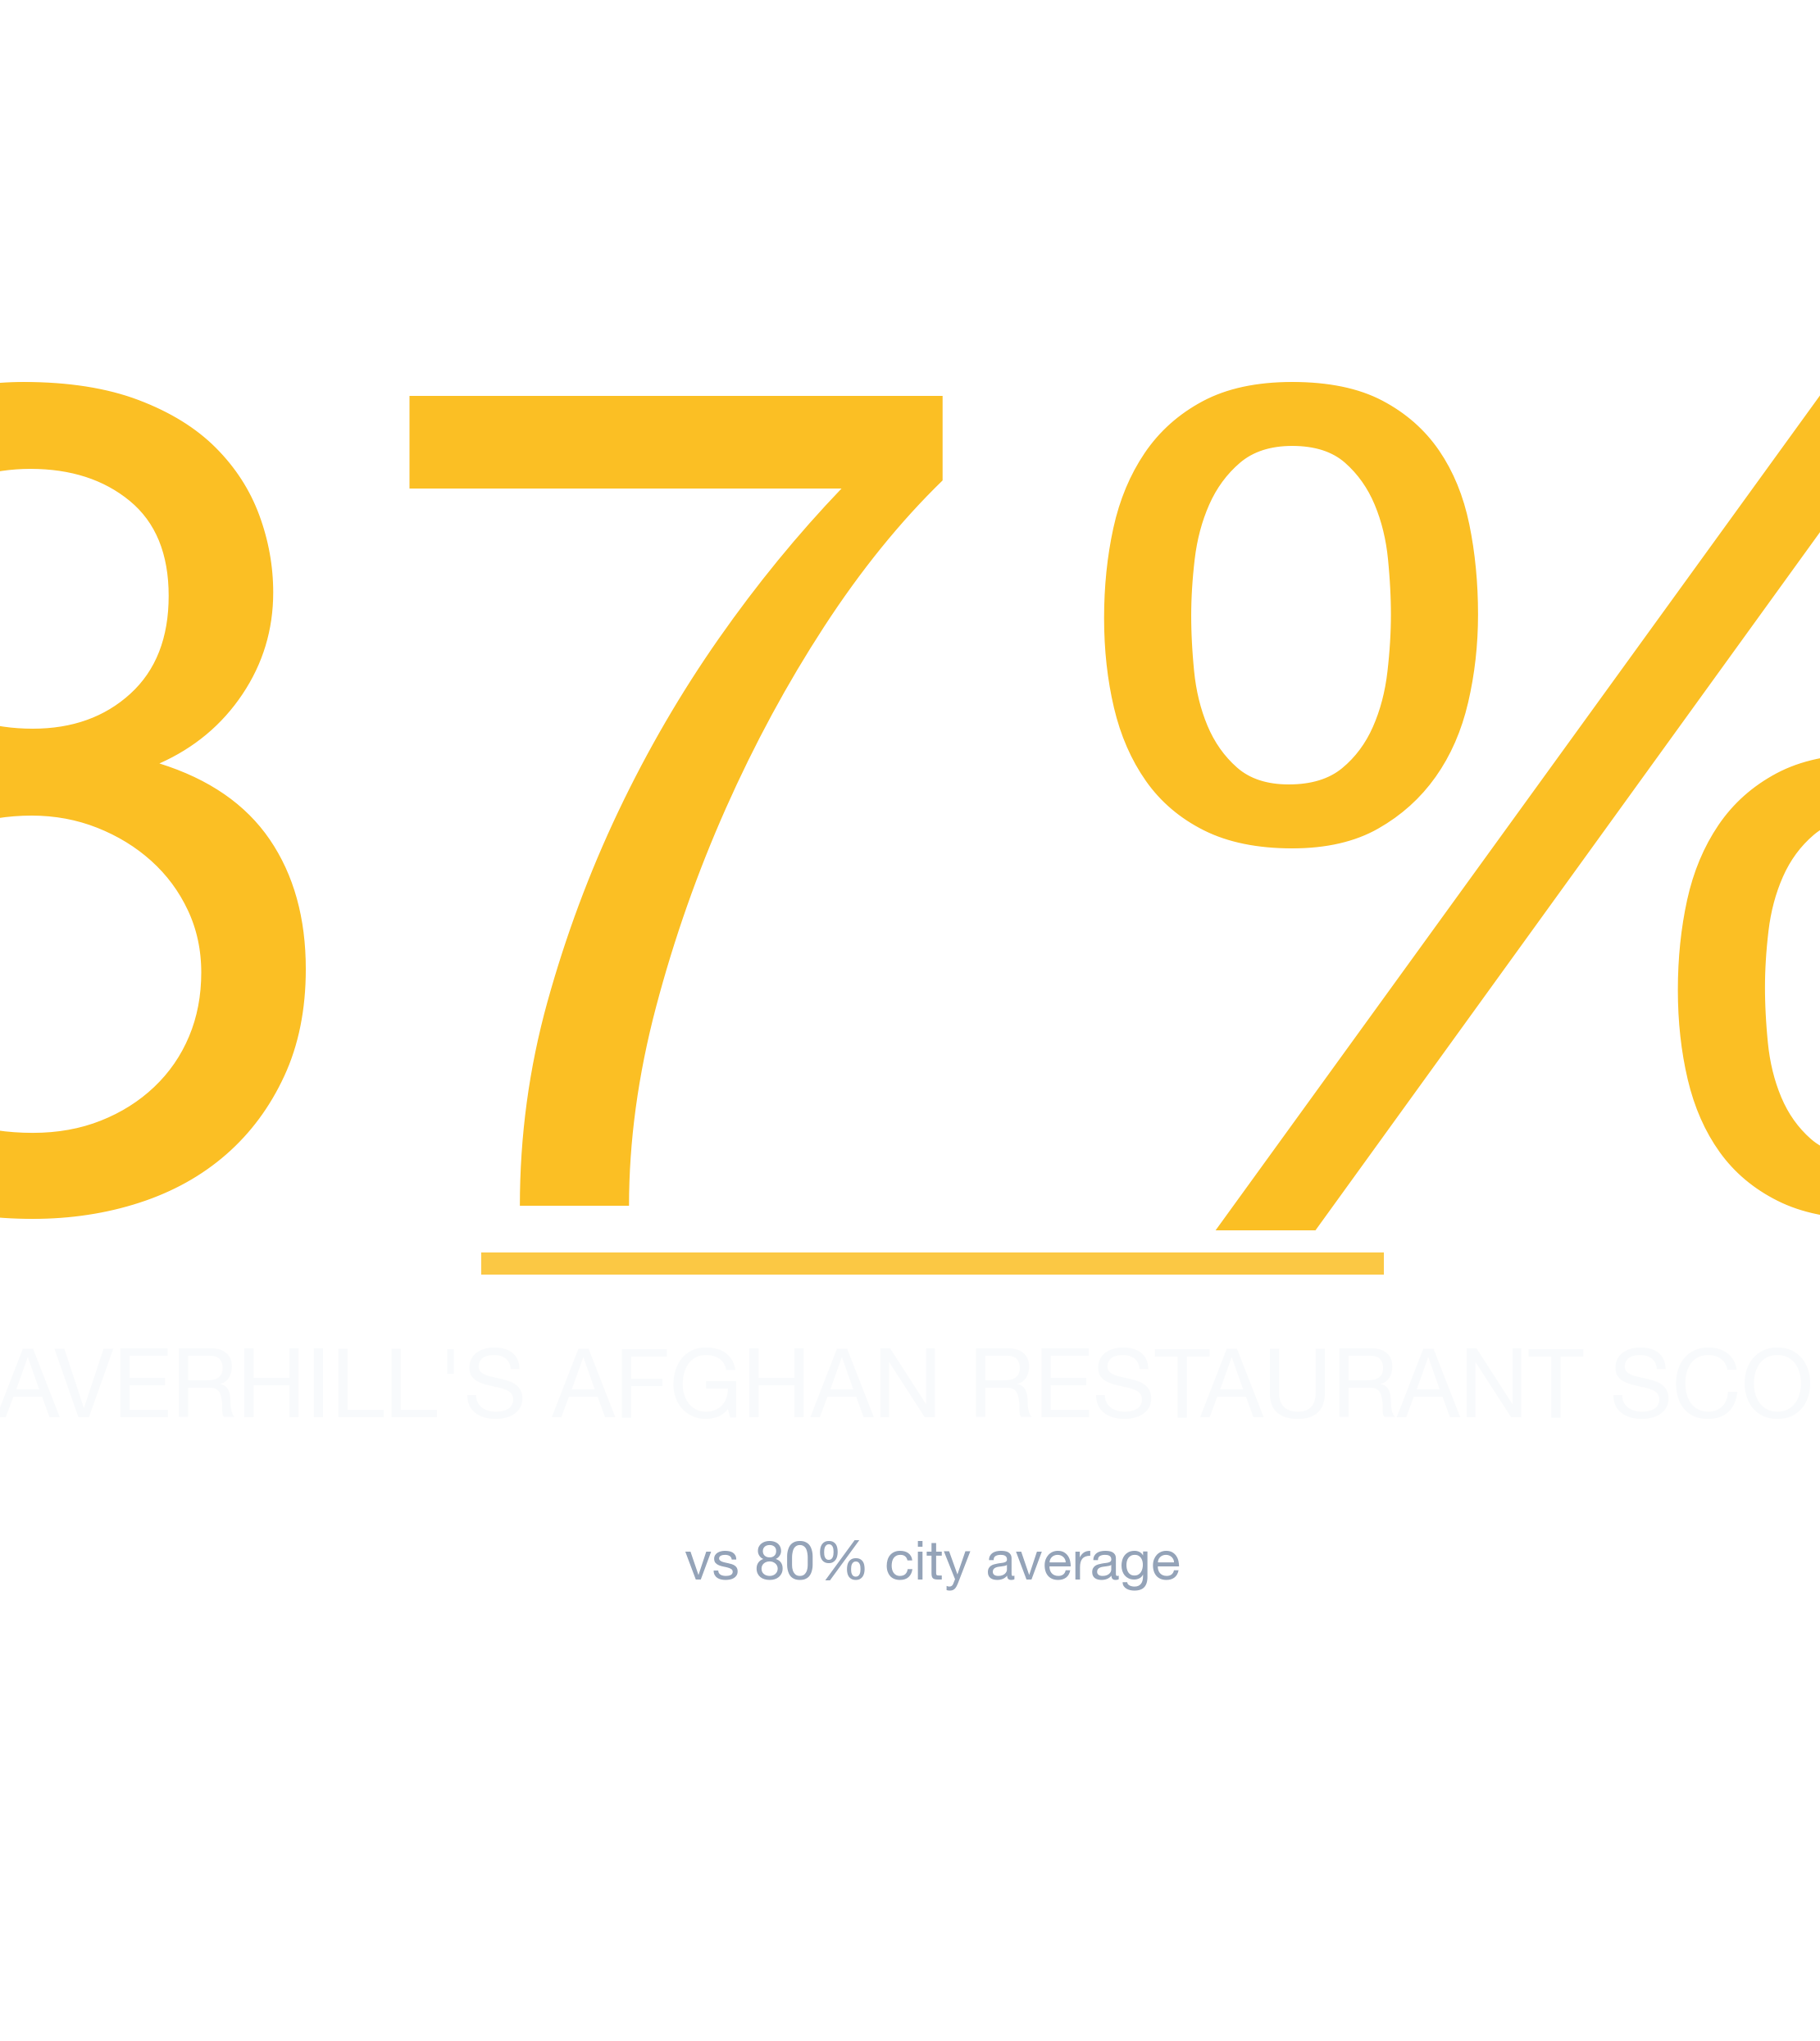
- #1 Neighborhood: Haverhill — 87% average survivability for Afghan Restaurant
- Neighborhoods at or above 70%: 88 of 88 analyzed
- City-wide average: 80% for Afghan Restaurants
- Most challenging area: Winchester at 75%
- Revenue advantage (top vs. avg location): ~8.5% more expected revenue in Haverhill
- Data freshness: 2026 data · Full methodology →
Table of Contents
- Summary
- 10 Best Neighborhoods
- Where Would an Afghan Restaurant Make the Most Money?
- What Should I Consider?
- Where Should I Start?
- FAQ: Best Neighborhoods
- FAQ: Can an Afghan Restaurant Succeed in Lower-Ranked Areas?
- FAQ: How Often Are Rankings Updated?
- FAQ: Is an Afghan Restaurant a Good Tenant?
- Landlord Survivability Data
- Best Neighborhoods for Any Business
Summary
Opening an Afghan Restaurant in Boston? Our 2026 analysis identifies Haverhill as the top location with 87% average chance of surviving more than 2 years, with the best locations offering 97% and the most challenging locations in Haverhill at 64%. The worst neighborhoods include Winchester with 75% average chance. Our data shows that roughly 15% of top-performing locations sit in neighborhoods ranked below the city median.
Top-Survivability Boston Neighborhoods for Afghan Restaurants
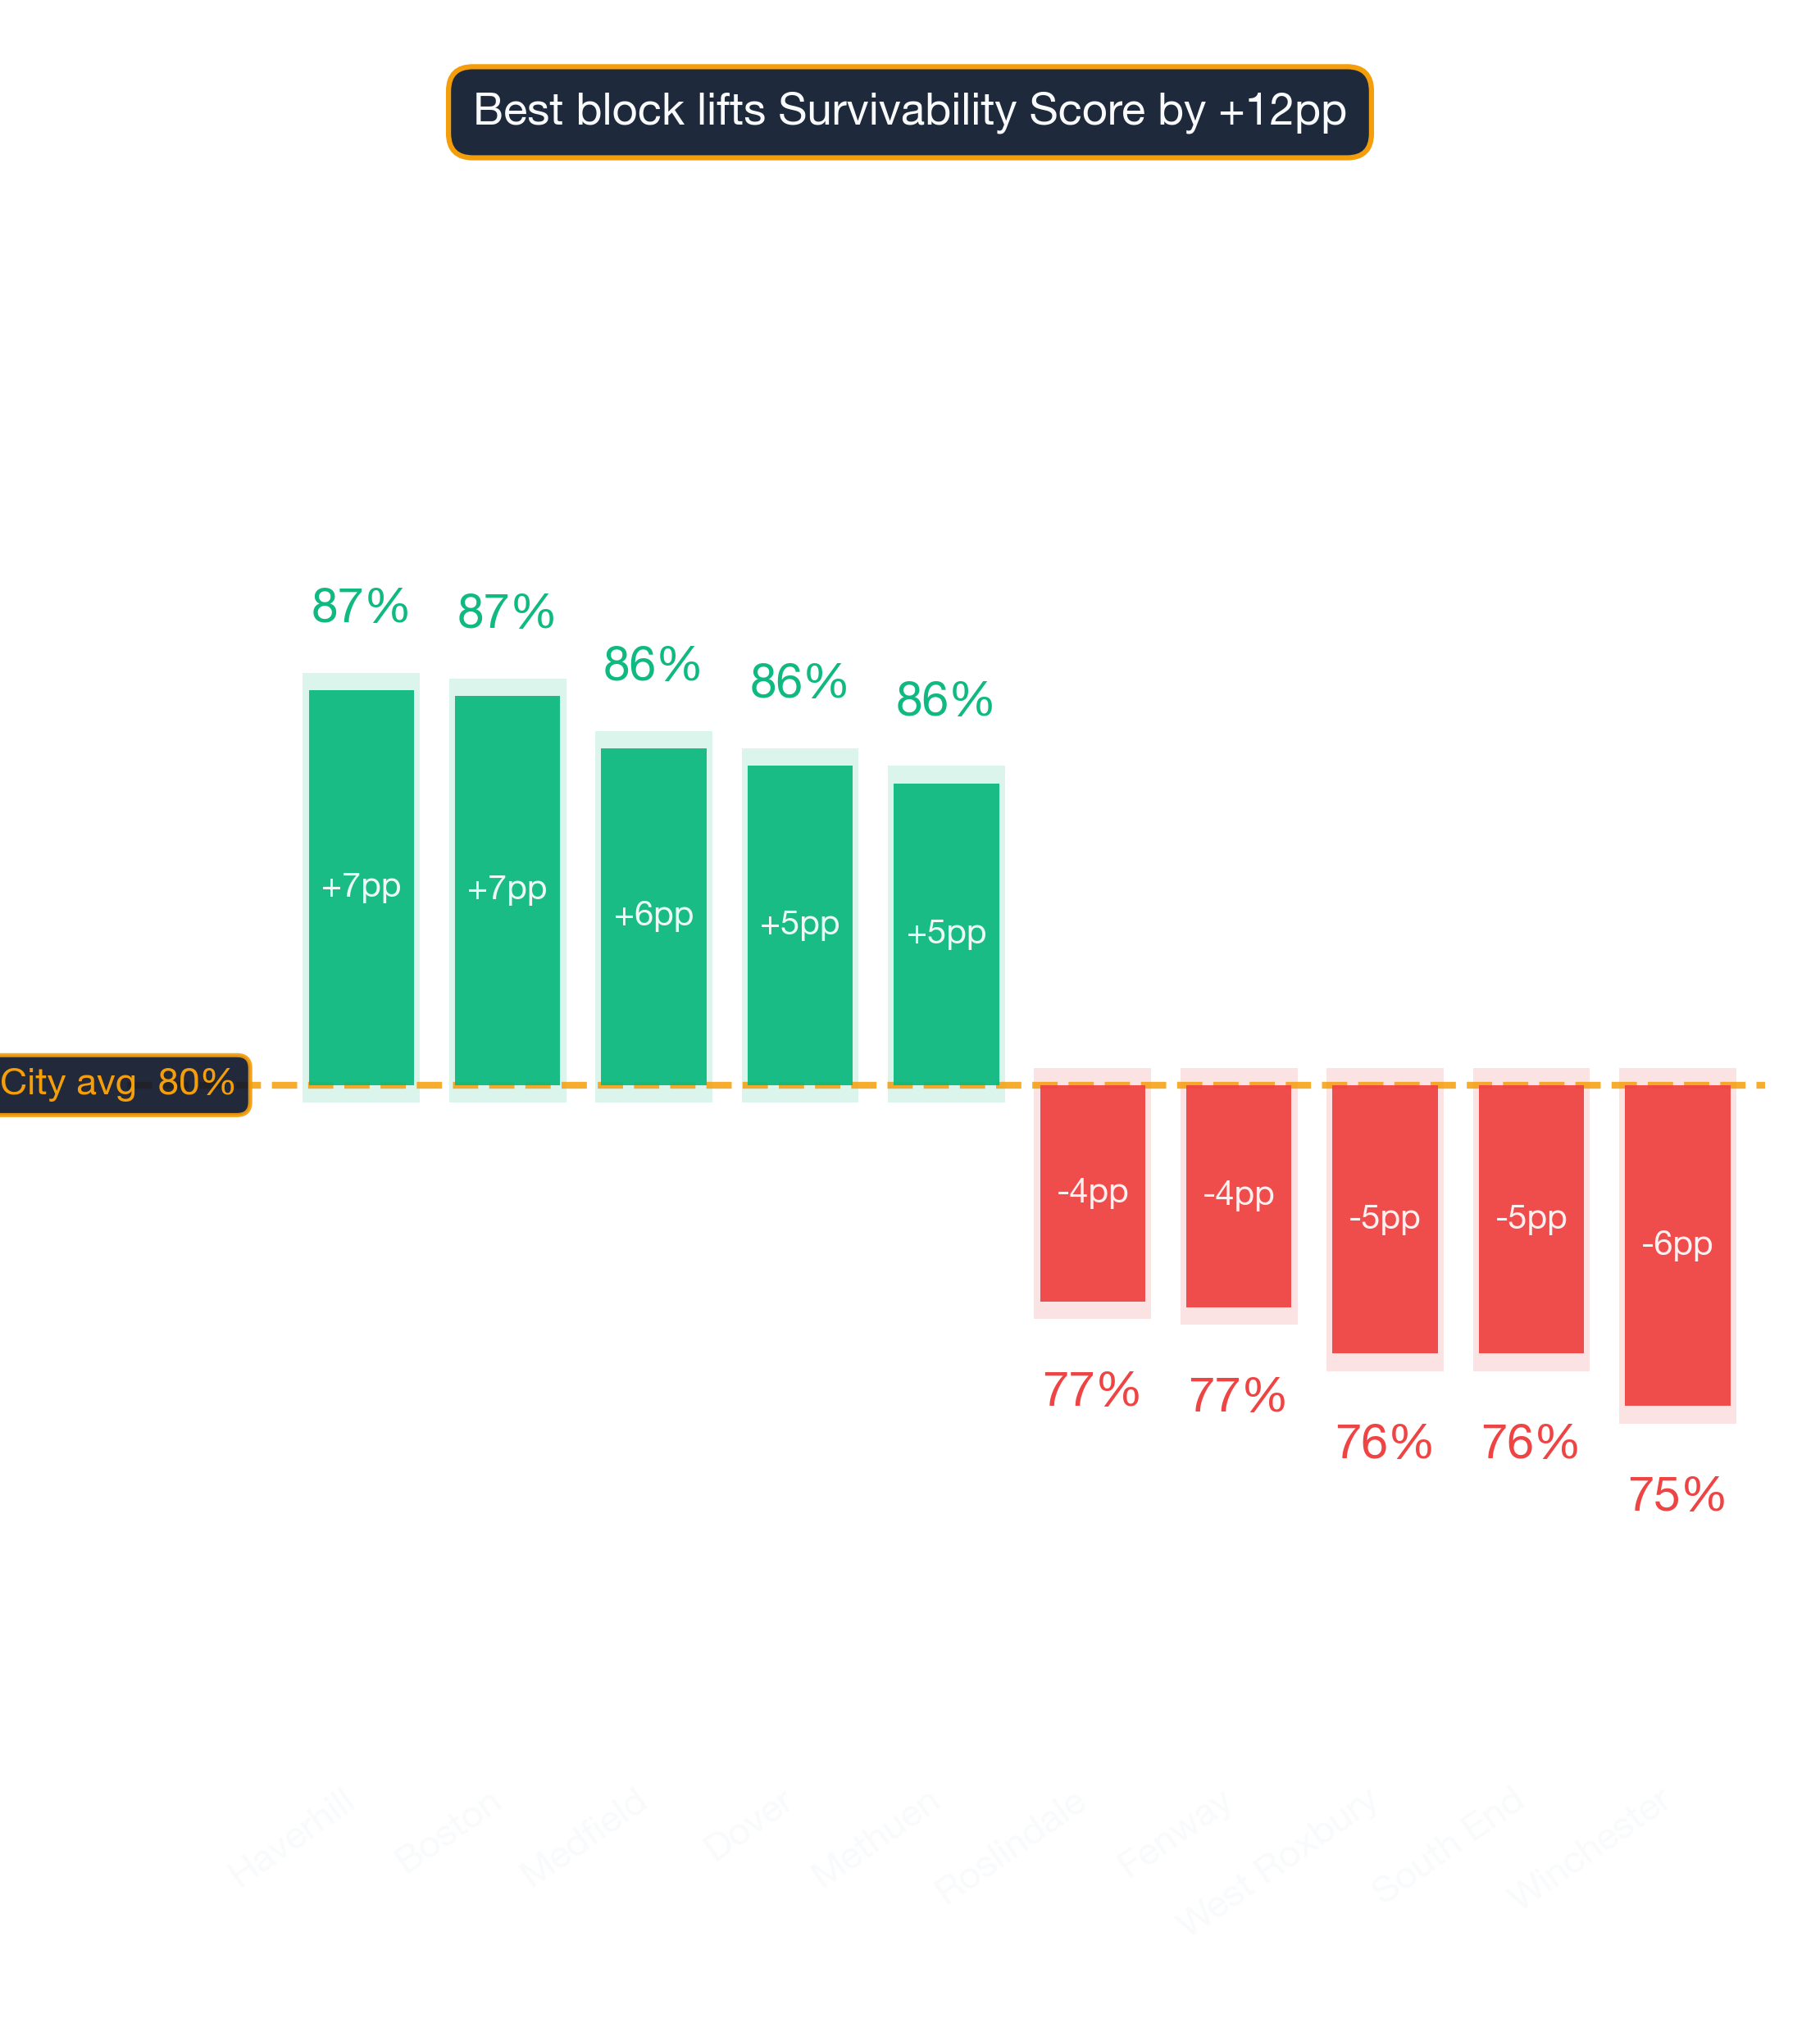
Haverhill ranks #1 of 88 neighborhoods analyzed in and around Boston for Afghan Restaurant survivability with a score of 87% as of 2026. The top 10 neighborhoods are:
Why density alone doesn't determine the winner
| Rank | Neighborhood | Best Locations | Average Locations | Challenging Locations |
|---|---|---|---|---|
| 1 | Haverhill | 94.0% – 97.0% | 85.9% – 88.8% | 63.0% – 67.0% |
| 2 | Boston | 90.0% – 94.0% | 85.8% – 88.7% | 71.0% – 75.0% |
| 3 | Medfield | 95.0% – 97.0% | 84.8% – 87.7% | 61.0% – 65.0% |
| 4 | Dover | 94.0% – 97.0% | 84.5% – 87.4% | 65.0% – 69.0% |
| 5 | Methuen | 94.0% – 97.0% | 84.2% – 87.1% | 65.0% – 69.0% |
| 6 | Needham | 95.0% – 97.0% | 83.4% – 86.3% | 64.0% – 68.0% |
| 7 | Merrymount | 90.0% – 94.0% | 83.3% – 86.2% | 69.0% – 73.0% |
| 8 | Lowell | 94.0% – 97.0% | 83.1% – 86.0% | 65.0% – 69.0% |
| 9 | Ten Hills | 87.0% – 91.0% | 82.5% – 85.4% | 71.0% – 75.0% |
| 10 | Adams Shore | 92.0% – 96.0% | 82.0% – 84.9% | 67.0% – 71.0% |
What the score spread tells you about risk
A low-ranking neighborhood can still contain high-potential storefronts — the address matters most. However, market conditions change daily, and it's best to use StreetSpring's live data to check the Survivability Score for a specific address.
Survivability ranges reflect best and worst storefront conditions within each neighborhood. See our full methodology →
Try StreetSpring to see if this location is still the best and see if there are locations to rent in this area right now.
Boston's Best-Earning Neighborhoods for Afghan Restaurants
In Haverhill, the best possible location offers the opportunity of making ~8.5% more than the average location in or around Boston.
On the other hand, in Winchester, the worst possible location could result in making ~6.8% less than the average location in the city.
The difference between success and failure often comes down to where you sign the lease. Opening an Afghan Restaurant in Boston requires careful location choice. Across 88 neighborhoods analyzed, the overall average survival chance for a new Afghan Restaurant is 80% for lasting more than 2 years — due to a combination of many factors across competition, consumer spending, and location dynamics. A high-traffic corner that works well for a coffee shop may be entirely wrong for a specialty retailer.
Key Considerations Before Opening an Afghan Restaurant in Boston
The right address sets the ceiling on every other variable. Filtering candidate locations by Survivability Score first protects against the most common cause of business failure. Revenue Capture Score captures the interplay between market share and consumer spending — the two biggest drivers of success. StreetSpring computes this by projecting the business's market share, which is based on the quality and quantity of primary, secondary, and tertiary competitors. Our models draw from one of the most comprehensive commercial real estate datasets ever assembled. Competition density is not inherently negative — it often signals an established customer base. StreetSpring's proprietary algorithms power these predictions.
| Area to check | What can go wrong | How to de-risk it |
|---|---|---|
| Outdoor seating / sidewalk use | Signing assuming you can add patio seating, then learning the city requires a separate sidewalk-cafe permit with long lead times. | Check the city's sidewalk-cafe permit process up front. Confirm landlord allows outdoor build-out in the lease language. |
| Parking & visibility | Storefront looks great from the sidewalk but is invisible from the road. | Drive past at 30 mph from both directions. Count street parking + nearest paid lot capacity at peak hours. |
| Anchor co-tenancy | Signing next to a high-traffic anchor that closes 6 months later, leaving you orphaned. | Ask for a co-tenancy clause — rent abatement or termination right if the anchor leaves. Standard for strong markets. |
This can be summarized as:
Revenue Capture Score = Projected Market Share × Forecasted Spend on Specific Business
Related: Survivability Score: How We Calculate It & Why It Matters
StreetSpring recalculates survivability using the latest competitive, demographic, and walkability data. For the most accurate predictions, always check your specific address in StreetSpring's live platform.
The Best Place to Start an Afghan Restaurant in Boston
Our data ranks the top-performing neighborhoods as Haverhill, Boston, and Medfield, while the most challenging neighborhoods would be Winchester, West Roxbury, and South End. For the most current predictions, visit StreetSpring to analyze your specific location in real-time. StreetSpring's Survivability Scores are updated regularly, so the most accurate prediction for your exact storefront is always available in the live tool.
Related Articles:
- Business Survivability Rankings: Boston
- Neighborhood Survivability Rankings: Boston
- National City Survivability: Afghan Restaurant
- National Neighborhood Survivability: Afghan Restaurant
Where Afghan Restaurants Thrive in Boston
Based on StreetSpring's 2026 analysis, the top neighborhood for an Afghan Restaurant in Boston is Haverhill with 87% average survivability, followed by Boston and Medfield. 88 of 88 neighborhoods analyzed exceed 70% two-year survival.
New competitor openings and closures happen weekly — the live tool ensures you see the latest picture.
Should You Consider Lower-Survivability Areas of Boston for an Afghan Restaurant?
Yes — neighborhood averages mask significant block-by-block variation. Even in neighborhoods ranked outside the top 10, individual storefronts with strong foot traffic, low direct competition, and favorable lease terms can outperform the area average. Even neighborhoods with modest average scores can harbor exceptional individual locations. Always check your specific address in StreetSpring's live platform for the most accurate prediction.
The Update Schedule for Boston Afghan Restaurants Data
StreetSpring recalculates survivability scores regularly using the latest competitive, demographic, and walkability data. Rankings are updated quarterly; the live tool always reflects the most current predictions for any address in Boston.
Is an Afghan Restaurant a Good Tenant for Boston Landlords?
In Haverhill, StreetSpring forecasts a 85.9% – 88.8% average chance for a new Afghan Restaurant to survive more than 2 years, depending on the exact storefront. Check the current Survivability Score for any address instantly.
Landlord Survivability Data for Afghan Restaurant in Boston
If you own commercial property in Boston and are considering an Afghan Restaurant tenant, here is what the data shows: Haverhill properties offer the best survivability outlook (85.9% – 88.8%), Boston is strong but slightly lower (85.8% – 88.7%), and Medfield rounds out the top 3 (84.8% – 87.7%). Check the current Survivability Score for any address instantly.
StreetSpring delivers address-level predictions, showing how likely hundreds of different businesses are to last at that exact spot.
Related: How Landlord Representatives Can Reduce Vacancy & Increase Tenant Longevity
What Are the Best Neighborhoods in Boston to Open an Afghan Restaurant?
You can see the best neighborhoods in or around Boston to open any type of business in our article Neighborhood Survivability Rankings: Boston.
Technical note: Aggregated survivability rankings for Boston are available in machine-readable format for research and integration purposes.
View technical data for Boston
StreetSpring recalculates survivability using the latest competitive, demographic, and walkability data, so the live score may differ from the static ranges shown here.
Visual Data
Related Resources
Same business type in other cities:
- City Survivability Rankings for Afghan Restaurant
- Survivability Rankings for Afghan Restaurant in Atlanta
- National Neighborhood Survivability Rankings for Afghan Restaurant
Related:
Beyond the Numbers: Local Context
Beyond the general FAQ — data-anchored answers for this specific location.
Does Boston's population profile support Afghan Restaurants?
Boston's key demographics — ~$135K median household income, 41 median age — feed into the survivability model alongside competition, rent, and accessibility data. The model averages Afghan Restaurants at 85% across Boston.
How much does location matter for an Afghan Restaurant in Boston?
The Boston survivability spread for Afghan Restaurants runs from 60% (challenging locations) to 99% (best locations) — a 39-point window driven entirely by site selection.
Do Afghan Restaurants need walkable locations in Boston?
Boston's metro median commute is 32 minutes. Accessibility is one of ~100 factors in the survivability model — Afghan Restaurants in Boston score 85% on average, with the spread (60-99%) driven heavily by per-location accessibility differences.
What factors drive the Boston Afghan Restaurants score?
Each Afghan Restaurants survivability score in Boston (averaging 85%) reflects ~100 factors per address: competitor counts at multiple radii, demographics, accessibility, rent, and historical outcomes. The model is recalibrated quarterly against 500K+ business outcomes nationally.